MACD Divergence Scanner
- インディケータ
- Reza Aghajanpour
- バージョン: 1.9
- アップデート済み: 3 8月 2024
- アクティベーション: 20
** All Symbols x All Time frames scan just by pressing scanner button **
Introduction
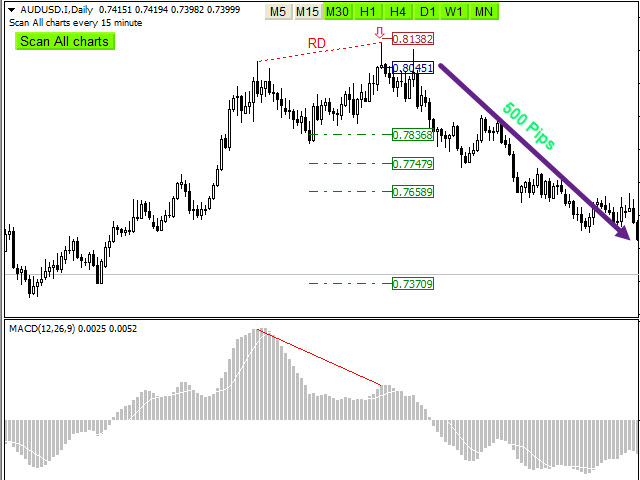
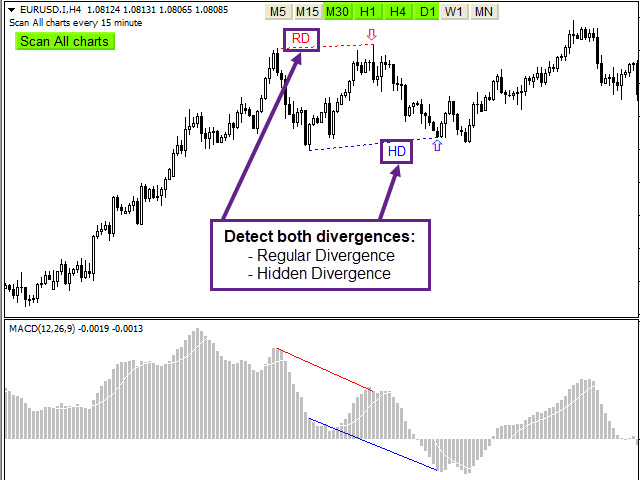
MACD divergence is a main technique used to determine trend reversing when it’s time to sell or buy because prices are likely to drop or pick in the charts. The MACD Divergence indicator can help you locate the top and bottom of the market. This indicator finds Regular divergence for pullback the market and also finds hidden MACD Divergence to show continuing trend.
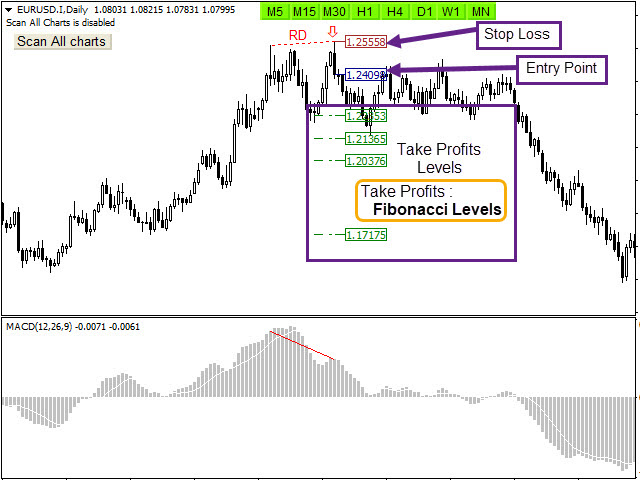
This indicator shows divergence on the MACD that is a strong hint for an excellent entry point and finds immediately with alarm and notification and also has stop loss, take profits and entry point with Fibonacci levels and candlestick checking for easy trading.
Main Features
- Detect the best and most successful point of trend or reversal trend
- Easy-to-use and user-friendly indicator
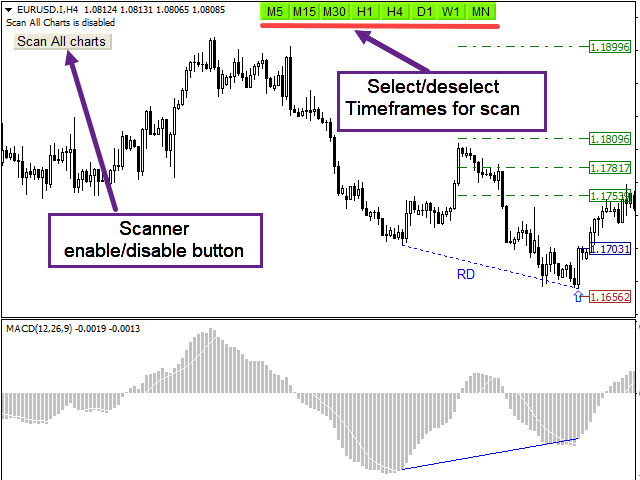
- Scan All charts button ( Forex, Crypto, Indices and commodities)
- Select and deselect time frames button for scan (M5,M15,M30,H1,H4,D1,W1,MN)
- It displays and pushes notification stop-loss, entry-point and take-profit levels
- Candlestick check for the best entry point
- Use Fibonacci levels
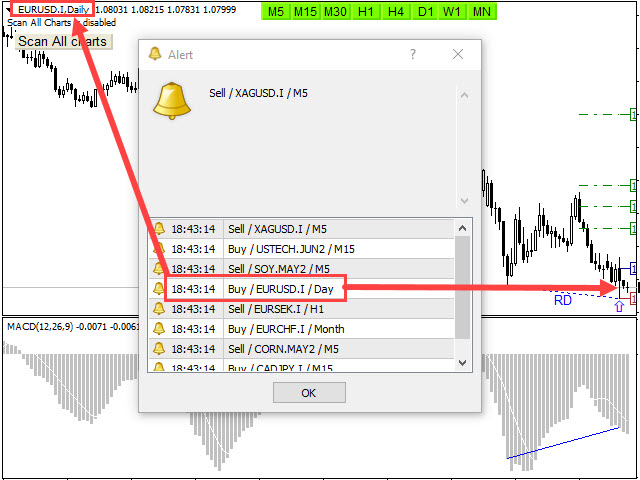
- Sending the alert and push notification
- Alert enable/disable base on your setting time
- Adjust the pattern setting
How to test:
You can find tester version here. It is free on USDCHF and AUDCHF real charts.
Input Parameters
=========Scanner============
- Scan All Charts – Enable
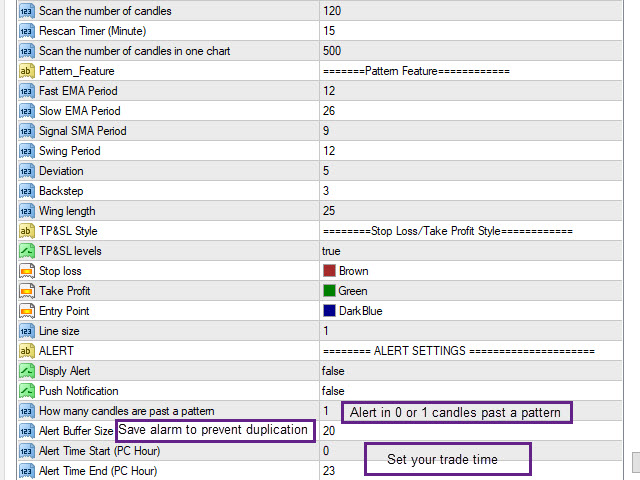
- Scan the number of candles – Amount of history bars to evaluate
- Re-scan Timer – Re-scan all charts in all time frames after passing time
=======Pattern Feature============
- MACD Feature(Fast EMA Period, Slow EMA Period, Signal SMA Period ) - MACD features
- Pattern Feature(Period, Deviation, Back step, Wing length) - Algorithm Parameters for pattern recognition
=======Display/style Options============
- Display Options – Display or do not Take Profit and Stop Loss levels
- Stop Loss/Take Profit levels and Breakout Style - Set the Fonts and colors of patterns
========ALERT SETTINGS ==========
- Display Alert or Push Notification – Enable or disable Alert or Push Notification
- How many candles are past a pattern – Maximum Number of candles Passed from a pattern to allow alert
- Alert Buffer Size – Maximum save alert to prevent duplicate alerts
- Alert start/end time – Determine trading hours based on the computer clock to activate and deactivate the alarm


A lot of thought has gone into developing this MACD Scanner. 10 out of 10 for simple and very user-friendly. Like trading hidden divergence in direction of the higher time frame