• 概要
  • レビュー
  • コメント (5)
  • 最新情報

Currency Power System

Indicator basic idea is buy strong currency and sell weak currency. If A/B currency pair is in an uptrend, it shows if it is due to A strength or B weakness.On these signals one can choose the most optimal pair to trade. You can use Currency Power  System for pattern trading as well, among basic patterns which can be used are:

So much for theory. I searched for a ready-made indicator (Currency Strength) to support my trade but did not find one. Well. I have to write my own. 

 The plan was:

  • The indicator must be simple. 
  • It needs to be intuitive.
  • Must be effective.
  • It needs to show the places where the big fish are locating capital and not the street.

Here we go!

  • Automatically add 28 currency pairs to Market Watch
  • Automatic suffix added
  • Automatic history download
  • Keyboard operations:
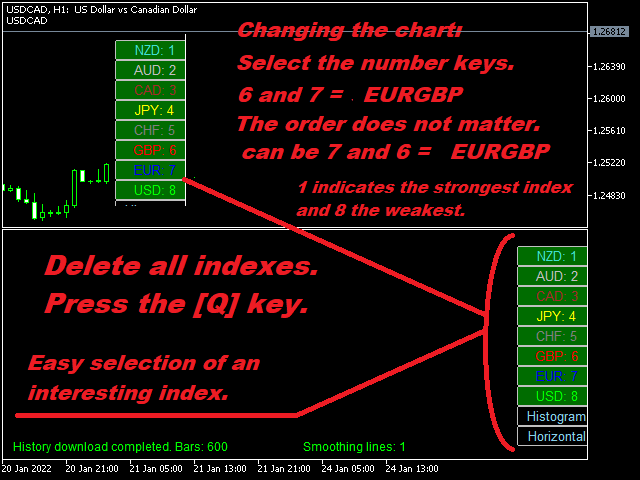
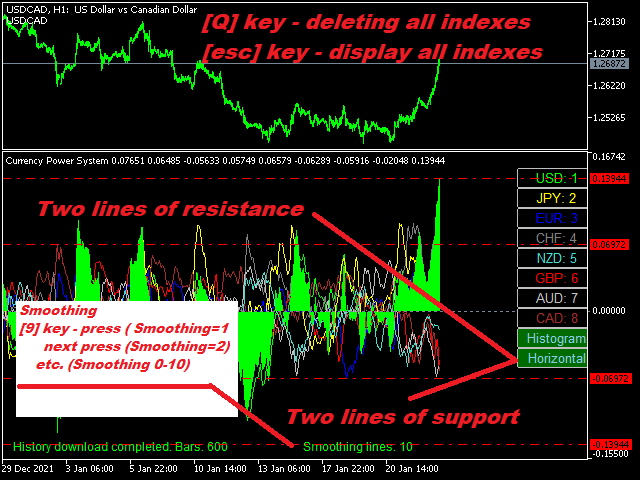
  • [esc] - Display all indexes.
  • [Q] - Delete all indexes.
  • [Tab] - Choice of 28 currency pairs.
  • [1-8] - symbols.
  • [9] - smoothing (0-10)
  • Buttons on the chart with a symbol.
  • Button for the histogram.
  • Button for support and resistance lines [horizontal]

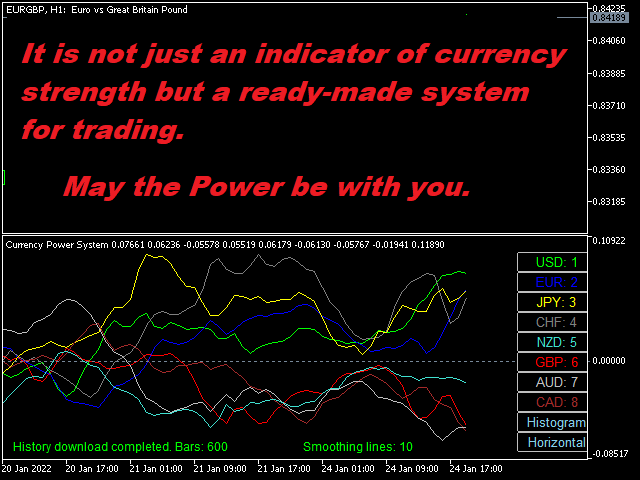
Understanding currency strength will be key for developing forex trading strategy. The strength of a currency is a clear indicator of whether corresponding currency pairs are about to experience a change in value. The currency strength index, the currency strength meter, and other currency strength indicators will directly affect your ability to determine whether a relative value change is likely to occur.The currency strength indicator can be very appealing especially for beginner traders who are still in the process of learning how to trade. 

There are several ways to calculate the strength, however, the main rules are:

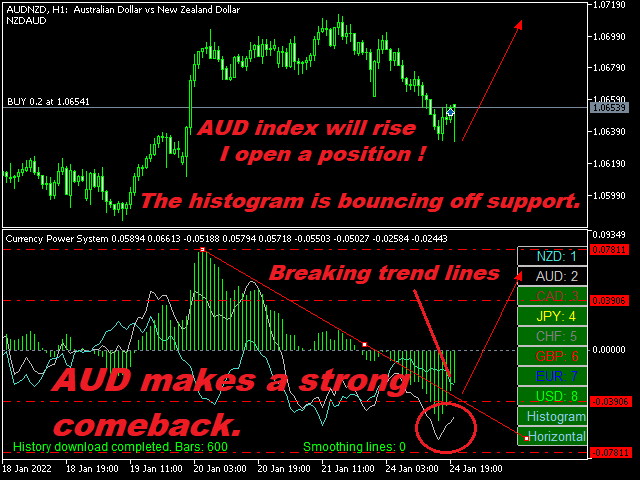
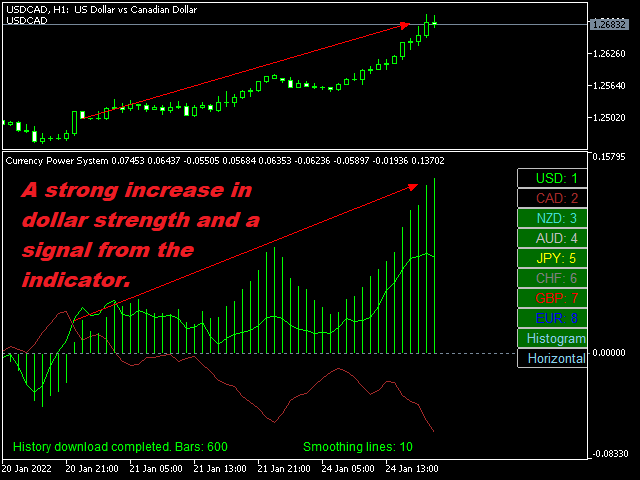
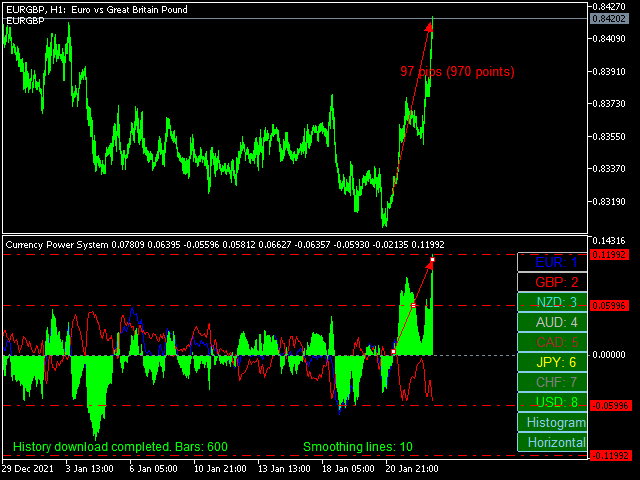
  • A line going upwards means that the currency is gaining strength.
  • A line pointing downwards means that the currency is becoming weak.
  • Flat lines, or almost flat, represent currencies that are maintaining their current strength.
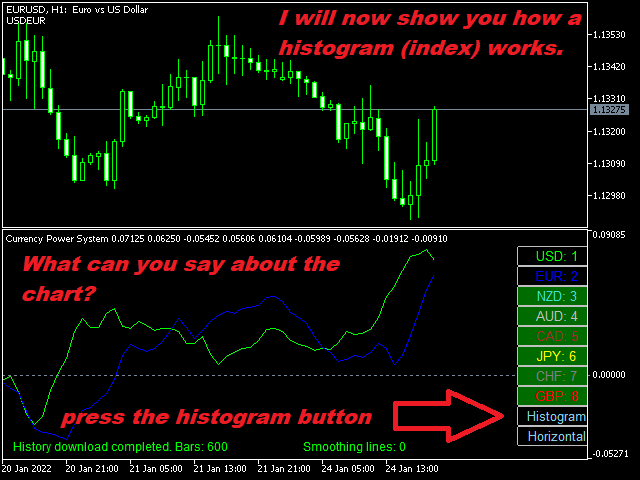
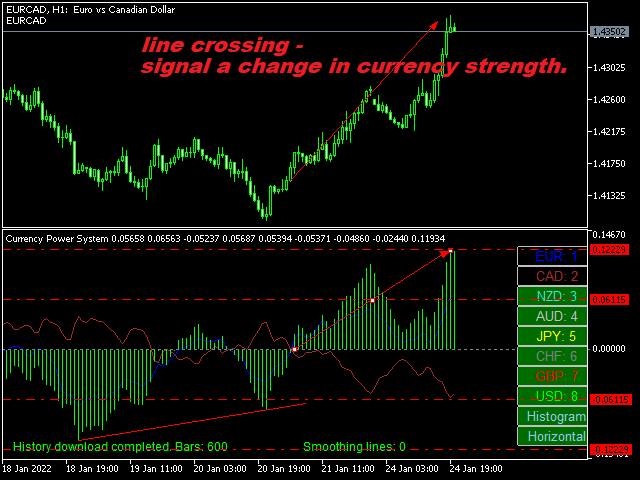
  • A line above another one means that one currency is stronger than the other one (enable histogram).
  • A line above zero is likely to have a bullish trend against currencies below zero and vice versa.
  • The red [horizontal] lines are support and resistance levels but also potential price range.


Hybrid trading

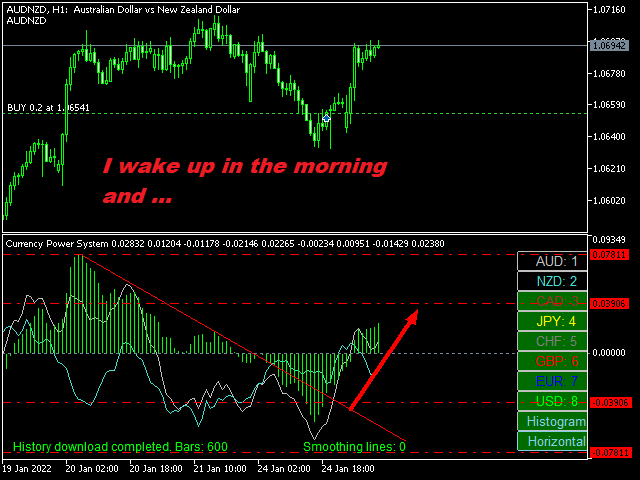
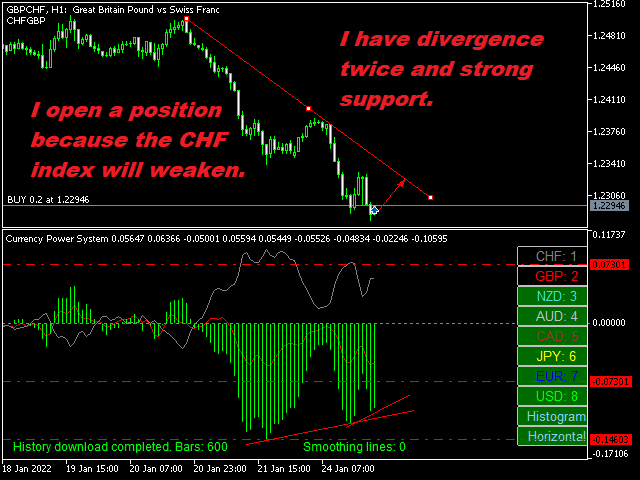
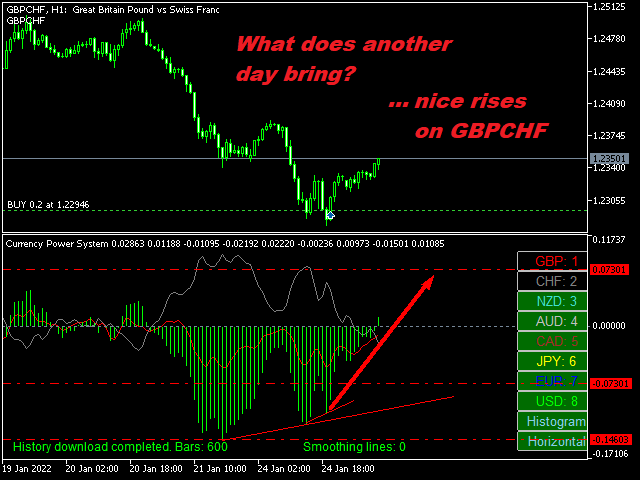
Personally, I am waiting one currency shows an extreme strength reading and another currency shows extreme weakness reading and try to trade a reversal.

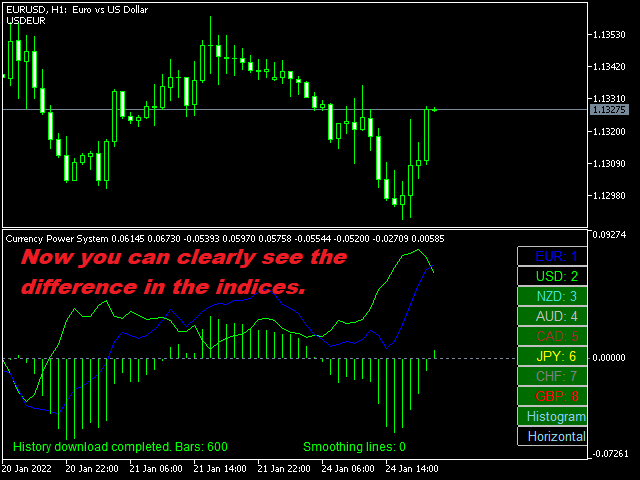
I never trust the market. I take into account that the market may go further. Analyze the screenshots below and think about your own strategy.

Quickly view the following currency pairs. Press the [Tab] key.

         "AUDCAD","AUDCHF","AUDJPY","AUDNZD","AUDUSD","CADCHF","CADJPY",

        "CHFJPY","EURAUD","EURCAD","EURCHF","EURGBP","EURJPY","EURNZD",

        "EURUSD","GBPAUD","GBPCAD","GBPCHF","GBPJPY","GBPNZD","GBPUSD",

        "NZDCAD","NZDCHF","NZDJPY","NZDUSD","USDCAD","USDCHF","USDJPY"    

Note!

Analyze the screenshots below and think about your own strategy.

See in the strategy tester.


おすすめのプロダクト
RSI / TDIアラートダッシュボードを使用すると、取引するすべての主要ペアでRSIを一度に(ユーザーが選択可能に)監視できます。 次の2つの方法で使用できます。 1.複数の時間枠を選択すると、通常の取引条件を超えて延長された複数の時間枠がある場合にダッシュが表示されます。複数の時間枠にわたって買われ過ぎまたは売られ過ぎのレベルを達成したため、価格が最近激しく押し上げられたため、引き戻しまたは逆転が間もなく行われることを示す優れた指標です。 2. 1つの時間枠(トレードするのが好き)と複数のRSIレベルを使用して、その時間枠でのRSIの延長の強さを示します。これは、価格が一方向に非常に長く押し込まれ、市場が利益を得ることになっている場合に、平均回帰取引を行うための優れた戦略です。スクリーンショットの例では、H4 RSIが25レベルを超えて2ペアで拡張されていることがわかります。これは、通常の価格アクションよりもはるかに遠いため、長く行く良い機会です。 ダッシュボードは、選択した時間枠でろうそくが閉じたときに、選択したレベルでの延長された状態(買われ過ぎと売られ過ぎ)を警告
Plucking Machine Plucking Machine   is a trend indicator designed specifically for gold and can also be used on any financial instrument. The indicator does not redraw and does not lag. Recommended time frame H1. The current setting is applicable for all time periods. It shows the current direction of the market based on price movements. Corresponding products of indicators: https://www.mql5.com/zh/market/product/61388?source=Site+Market+Product+Page#description The brother Indicator :  http
インジケータMTFクリスタリウム矢印は、半自動取引システムであります. これは、すべての通貨ペアで動作します。  インジケータは、三つのルールを使用しています:1)我々は唯一のトレンドで取引、2)"誰もが販売しているときに購入し、誰もが買うときに販売する"、3)価格  インジケータMTF矢印は、内蔵の指標を使用して、複数の時間枠全体のクリスタリウムフィルタルール。 トレンドは、選択した時間間隔で一致した場合、インジケータは、市場に参入するための矢印を与えます。 それからあなた自身の決定をする。 購入する-緑の矢印、売る-赤い矢印。 指標では、ロットを変更したり、EAの取引時間とシャットダウン時間を設定することができます。 また、作業期間と時間フィルタを変更することができます。 ビープ音が鳴ってる  推薦された働く期間D1。 フィルタH1とH4。  設定: TF働く期間(推薦されたD1) Cci_cperiodcomment CCIレベルアップ CCIレベルDn CCI価格 SARステップ SAR最大値 TFのFilter1–(推薦されたH1) TFのFilter2
概要 ATRマルチレベルおよび移動平均バンドインジケーターは、トレーダーが市場のトレンド、サポートおよびレジスタンスレベル、ボラティリティを特定するのを支援する強力なツールです。このインジケーターは、価格変動の周りにビジュアルバンドを作成するために、複数の移動平均とATR(平均真の範囲)乗数を組み合わせています。これにより、トレーダーは潜在的な反転ポイント、トレンド条件、および市場の統合ゾーンを検出するのに役立ちます。 特徴 複数バンドの視覚化: トレンドを簡単に識別するために、赤、オレンジ、黄色、緑、青、紫などの異なる色で、6つの動的バンドを表示します。 ATRボラティリティバンド: 市場のボラティリティに基づいてバンドのグラフを調整し、反転または価格の継続の可能性について明確な視覚的信号を提供します。 カスタマイズ可能なパラメーター: ATR乗数と移動平均の期間を調整可能で、市場の異なる条件やトレーディング戦略に適応します。 トレンドの明確な識別: バンドはボラティリティに応じて拡張および収縮し、トレーダーがトレンド、統合期間、および潜在的なブレイクポイントを簡単に視認できます。
It is one of the famous indicator in TradingView platform. Supertrend indicator shows the trend of the market intuitively . You can use it for understanding the trend or get insight about the market. ------- Value & Color -------- You can change the colour (line, filled). Default value is the same as Tradingview Supertrend default value ( period 10, ATR multiplier 3.0)
Orders Indicator MT5
Andrey Khatimlianskii
5 (1)
i-Orders is a simple indicator to monitor your own trade/analyze others' trades. I use it for a long time and do not imagine a chart without these arrows, lines and trade result numbers. The features allow you to: change the size and location of the control buttons ( Control buttons size , Control buttons corner ), disable display of opened and closed positions ( Show OPENED , Show CLOSED , Show PENDING ), change colors of arrows and lines for profitable and unprofitable buy and sell positions s
Ichimoku Kinko Hyo is a purpose-built trend trading charting system that has been successfully used in nearly every tradable market. It is unique in many ways, but its primary strength is its use of multiple data points to give the trader a deeper, more comprehensive view into price action. This deeper view, and the fact that Ichimoku is a very visual system, enables the trader to quickly discern and filter "at a glance" the low-probability trading setups from those of higher probability. This i
Knowledge of the strength and weakness of each currency is vital for every forex trader. Our   Currency Strength Meter indicator   measures the strength of eight major currencies (USD, EUR, GBP, CHF, JPY, CAD, AUD, NZD) by using the Relative Strength Index indicator, also known as RSI. The Currency Strength Meter indicator shows you, simply and quickly, when a currency is oversold, overbought, or in "normal area". This way, you can identify which currency is the strongest and the weakest. Our
Currency Strength Meter is the easiest way to identify strong and weak currencies. This indicator shows the relative strength of 8 major currencies + Gold: AUD, CAD, CHF, EUR, GBP, JPY, NZD, USD, XAU. Gold symbol can be changed to other symbols like XAG, XAU etc. By default the strength value is normalised to the range from 0 to 100 for RSI algorithm: The value above 60 means strong currency; The value below 40 means weak currency; This indicator needs the history data of all 28 major currenc
The Multi Pairs Forex Indicator is an   advanced trading too l that allows traders to track and analyze the performance of   multiple currency pairs in real-time   on a single chart. It consolidates data from various Forex pairs, providing an at-a-glance overview of market conditions across different currencies and helps you save time. Useful for various trading styles, including scalping, day trading, and swing trading. Whether you're monitoring major pairs like EUR/USD, GBP/USD, or more exoti
The Trade Helper indicator is a modification of the Trade Assistant indicator (by Andriy Moraru). The Trade Helper multitimeframe indicator is a good assistant for traders, useful as a filter in most trading strategies. This indicator combines the tactics of Elder's Triple Screen in a single chart, which lies in entering a trade when the same trend is present on three adjacent timeframes. The indicator operation is based on the principle of determining the trend on the three selected timeframes
Introducing PivotWave – your ultimate trading companion that redefines precision and market analysis. Designed with traders in mind, PivotWave is more than just an indicator; it’s a powerful tool that captures the pulse of the market, identifying key turning points and trends with pinpoint accuracy. PivotWave leverages advanced algorithms to provide clear visual signals for optimal entry and exit points, making it easier for traders to navigate volatile market conditions. Whether you are a begin
インディケータは現在のクオートを作成し、これを過去のものと比較して、これに基づいて価格変動予測を行います。インジケータには、目的の日付にすばやく移動するためのテキスト フィールドがあります。 オプション: シンボル - インジケーターが表示するシンボルの選択; SymbolPeriod - 指標がデータを取る期間の選択; IndicatorColor - インジケータの色; HorisontalShift - 指定されたバー数だけインディケータによって描画されたクオートのシフト; Inverse - true は引用符を逆にします。false - 元のビュー。 ChartVerticalShiftStep - チャートを垂直方向にシフトします (キーボードの上下矢印)。 次は日付を入力できるテキストフィールドの設定で、「Enter」を押すとすぐにジャンプできます。
The Standard Deviation (StdDev) indicator drawn using a tick chart. After launching it, wait for enough ticks to come. Parameters: Period - period of averaging. Method - method of averaging. calculated bar - number of bars for the indicator calculation.
Introducing FX Zone Trend – Your Ultimate MT5 Trend Indicator! Why FX Zone Trend? Versatile: Use it on any timeframe and pair, but optimized for USDJPY and NAS100 on the hourly timeframe. Mobile Alerts: Stay in the loop even when you're on the go! Set up notifications through MT5 and receive instant alerts on your phone. Trade Smarter. Trade with FX Zone Trend. How to Maximize FX Zone Trend: Discover the freedom to shape your trading journey: 1️⃣ Create Your Strategy: Use FX Zon
Spike Detector for Boom and Crash Indices The Spike Detector is specifically designed to cater to the unique needs of traders in the Boom and Crash indices markets. Optimized for M1 (1-minute) and M5 (5-minute) timeframes, this tool ensures you receive timely and actionable insights. Below, you'll find a comprehensive guide on its key features, advantages, installation process, and how to use it effectively. Key Features and Advantages 1. Non-Repainting: The Spike Detector guarantees accurac
Magic sl NASDAQ 100
Benyamin Naser Mokhtari Karchegani
The indicator now at your disposal is undoubtedly one of the best tools for trading in the NASDAQ 100 market, especially in the 1-minute and 5-minute timeframes. This indicator is meticulously designed for high precision and can be adjusted for other timeframes as well. Simply run it and receive good exit signals. Key Features: Specialized performance in the 1-minute and 5-minute timeframes: While this indicator works in other timeframes as well, its primary focus is on these two timeframes. Co
Currency Strength Meter is the easiest way to identify strong and weak currencies. This indicator shows the relative strength of 8 major currencies + Gold: AUD, CAD, CHF, EUR, GBP, JPY, NZD, USD, XAU. Gold symbol can be changed to other symbols like XAG, XAU etc. By default the strength value is normalised to the range from 0 to 100 for RSI algorithm: The value above 60 means strong currency; The value below 40 means weak currency; This indicator needs the history data of all 28 major currenc
VR Grid Mt5
Vladimir Pastushak
3.43 (7)
VR グリッド インジケーターは、ユーザー定義の設定を使用してグラフィカル グリッドを作成するように 設計 されています。 標準グリッド とは異なり、VR グリッドは 円形レベル を構築するために使用されます。ユーザーの選択に応じて、ラウンド レベル間のステップは任意に設定できます。さらに、他のインジケーターやユーティリティとは異なり、VR Grid は期間が変更されたり、端末が再起動されたりした場合でも、 グリッドの位置を維持 します。 設定、設定ファイル、デモ版、説明書、問題解決方法は、以下から入手できます。 [ブログ] レビューを読んだり書いたりすることができます。 [リンク] のバージョン [MetaTrader 4] 垂直レベル は実際の時間間隔に基づいており、 欠落している または存在しない期間は無視します。したがって、レベル間のステップは、ユーザーが選択した値に厳密に対応します。 VR グリッド インジケーターを使用すると、トレーダーは任意のレベルで 垂直線と水平線のスタイル 、色、太さを変更できます。これにより、金融商品の ラウンドレベル を制御できます。 ラウンド
FREE
HiperCube VIX へようこそ Darwinex Zero 25%割引コード: DWZ2328770MGM この指標は、sp500 / us500 の市場のボリュームに関する実際の情報を提供します 定義 CBOE ボラティリティ インデックスとして知られる HiperCube VIX は、市場の恐怖やストレスを測る広く認知された指標です。株式市場の不確実性とボラティリティのレベルを示し、S&P 500 インデックスを広範な市場の代理として使用します。VIX インデックスは、S&P 500 インデックスのオプション契約の価格に基づいて計算されます。 機能: カスタムカラー カスタムチャートカラー メイングラフを明瞭に保つためにサブウィンドウにインジケーターを表示 解釈が簡単 完全にカスタマイズ可能 Chat gptとAIが開発に使用されました 使用例: VIX は実際の市場に関する優れた情報を提供するボリュームインジケーターです。このインジケーターの値が高いということは、ボラティリティが高いことを意味します ボラティリティが高いということは、市場の動きにアプローチし、市場
FREE
Description : Rainbow EA MT5 is a simple Expert advisor based on   Rainbow MT5 indicator witch is based on Moving average with period 34. The indicator is incorporated in the EA, therefore, it is not required for the EA to operate, but if you wish, you can download it from   my product page . The Expert Advisor settings are as follows : Suitable for Timeframes up to H1 The parameters below can be set according to your trading rules. StopLoss ( Stop Loss in pips) TakeProfit ( Take Profit in pips
Gartley Hunter Multi - An indicator for searching for harmonic patterns simultaneously on dozens of trading instruments and on all possible timeframes. Manual (Be sure to read before purchasing) | Version for MT4 Advantages 1. Patterns: Gartley, Butterfly, Shark, Crab. Bat, Alternate Bat, Deep Crab, Cypher 2. Simultaneous search for patterns on dozens of trading instruments and on all possible timeframes 3. Search for patterns of all possible sizes. From the smallest to the largest 4. All fou
SlopeChannelB – 価格の傾斜チャネルを構築するテクニカル分析ツールで、市場の現状を評価し、取引シグナルを見つけるためのユニークな機会を提供します。 インジケーターの主な特徴: 価格の傾斜チャネル : このインジケーターは、サポートとレジスタンスのレベルを視覚化するのに役立ち、トレンドの逆転または継続の可能性を示すことができます。 ラインの色と背景の強調表示が異なる : 傾斜したサポートとレジスタンスのレベルは異なる色で表示され、チャネル自体はさらに背景で強調され、チャートの視覚的分析を簡素化します。 ライン計算のための3つのオプション : このインジケーターは回帰分析を使用してチャネルラインを構築します。3つの方法から選択できます: Robust(デフォルト) – 外れ値に強い方法。 OLS(最小二乗法) . Median(中央値計算) . 最適なモデル選択 : SlopeChannelBは5つの品質基準の分析に基づいて最も適切なチャネルラインのバリエーションを自動的に選択します。 品質パラメータはチャートに直接表示され、結果の評価に役立ちます。また、ボタンを使
Currency Strength Dynamic 通貨強さのダイナミックは通貨の強さを示す指標です。 通貨の強さは、通貨が含まれるほとんどまたはすべての通貨ペアのトレンドの方向を指します。 この指標は、MACD 指標と同様に、28 の最も人気のある通貨ペア (メジャー通貨ペアとマイナー通貨ペア) の移動平均間の差の測定値に基づいています。 利点 独自の振動計算法 特定の通貨の明細を無効または有効にするボタンの利用可能性 情報テーブル 2 種類のアラート: インジケーターのラインが交差したときと、ラインが指定されたレベルを交差したとき。 描画されるバーの数はオプションです。 各ポイントを詳しく見てみましょう。 独自の振動計算方法により、インジケーターが長時間最大値に留まらず、発散と収束のよく知られた効果と同様に、事前に最大値から抜け出すことができます。 この方法には、指定された計算期間と読み取り値をより滑らかにする平滑化レベルも含まれます。 計算には無駄な計算式や冗長な計算式が含まれないため、端末への負荷が軽減されます。 特定の通貨の行を無効または有効にするボタンがあることは、
40% off. Original price: $50 Ichimoku Trend Finder is a multi symbol multi timeframe trend dashboard that helps traders to monitor and identify potential market trends from one chart. This panel scans the Ichimoku Kinko Hyo indicator in 28 configurable instruments and 9 timeframes for classic Ichimoku trend signals with a deep scan feature to scan all market watch symbols (up to 1000 instruments!).     Download Demo here  (Scans only M1 and M6) Settings description   here MT4 version   here
Antabod Multiplier
Rev Anthony Olusegun Aboderin
Antabod Multiplier , the ultimate trading indicator designed to simplify your decision-making process and maximize your trading potential. Built with a robust combination of moving averages and stochastic oscillators, this tool provides clear, actionable signals for both buy and sell opportunities. The Antabod Multiplier stands out with its dynamic trend detection and precision filtering, giving you real-time visual signals to catch trend reversals and optimal entry/exit points with ease. Whethe
The Supertrend Multicurrency Scanner Dashboard MT5 is a powerful tool designed to monitor multiple currency pairs and timeframes using the Supertrend indicator. It organizes signals in a grid format, displaying each symbol’s trend status across timeframes from M1 to MN1. Traders can enable or disable specific timeframes to align with their strategies. You can find the MT4 version here    Supertrend  Multicurrency  Scanner  MT4   For detailed documentation click here Supertrend Integration: The d
Introducing the Ultimate Custom Time Range Indicator: Unlock Precision in Your Trading Strategies! Versatile Applications: Ideal for kill zones, trading sessions, and time macro analysis, silver bullet timings. You can have as many time ranges as you need to help identify the highest to lowest range within the specified start to end broker time. Note: most brokers operate in GMT +3 - so please convert and use your own broker time. 
Current strength of the 8 major currencies My   #1 Utility:  includes 65+ functions, including this indicator  |   Contact me  if you have any questions The indicator is displayed in a separate window, it can be moved to any place on the chart. In the input settings   you can adjust: Interface theme : dark / white; Prefix and Suffix,  if the currency pairs on your broker have it: (e.g. if Symbol is "EURUSD .pro ", please set " .pro " as a Suffix); Panel size Font size
このプロダクトを購入した人は以下も購入しています
トレンド スクリーナー インジケーターでトレンド取引の力を解き放ちます。ファジー ロジックと複数通貨システムを活用した究極のトレンド取引ソリューションです。 ファジー ロジックを活用した革新的なトレンド インジケーターである Trend Screener を使用して、トレンド取引を向上させます。 これは、13 を超えるプレミアム ツールと機能、および 3 つの取引戦略を組み合わせた強力なトレンド追跡インジケーターであり、Metatrader をトレンド アナライザーにする多用途の選択肢となります。 期間限定オファー : トレンド スクリーナー インジケーターは、わずか 100 ドルで生涯ご利用いただけます。 (元の価格 50$ ) (オファー延長) Trend Screener の 100% 非再描画精度の揺るぎない精度を体験して、取引の決定が過去の価格変動の影響を受けないようにしてください。 マルチタイムフレームおよびマルチ通貨機能の多用途性を解放し、比類のない自信を持って外国為替、商品、暗号通貨、インデックスの世界を取引できるようにします。 Trend Screener の包括的な
Quantum TrendPulse を ご紹介します。これは、   SuperTrend   、   RSI   、および Stochastic のパワーを 1 つの包括的なインジケーターに組み合わせて、取引の可能性を最大限に引き出す究極の取引ツールです。精度と効率を求めるトレーダー向けに設計されたこのインジケーターは、市場のトレンド、勢いの変化、最適なエントリー ポイントとエグジット ポイントを自信を持って特定するのに役立ちます。 主な特徴: SuperTrend 統合: 現在の市場動向に簡単に追従し、収益性の波に乗ることができます。 RSI精度: 買われすぎと売られすぎのレベルを検出し、市場の反転のタイミングに最適で、SuperTrendのフィルターとして使用されます。 確率的精度: 確率的振動を活用して、変動の激しい市場で隠れたチャンスを見つけます。SuperTrend のフィルターとして使用されます。 マルチタイムフレーム分析:   M5 から H1 または H4 まで、さまざまなタイムフレームで市場を常に把握します。 カスタマイズ可能なアラート: カスタム取引条件が満たされ
FX Volume MT5
Daniel Stein
4.82 (17)
FX Volume:ブローカー視点で捉える本物の市場センチメント クイック概要 トレード手法をさらに高めたいとお考えですか? FX Volume は、リテールトレーダーやブローカーのポジション状況をリアルタイムで提供します。これは、COTのような遅延レポートよりもはるかに早く知ることができます。安定した利益を目指す方も、さらなる優位性を求める方も、 FX Volume は大きな不均衡を見極め、ブレイクアウトを確認し、リスク管理を洗練させるのに役立ちます。今すぐ始めて、実際の出来高データがどのように意思決定を変革するかを体感してください! 1. FX Volume がトレーダーにとって非常に有益な理由 高精度の早期警戒シグナル • 各通貨ペアを売買しているトレーダー数を、他者よりも早く、ほぼリアルタイムで把握できます。 • FX Volume は、複数のリテールブローカーから得られる本物の出来高データを収集し、分かりやすい形式で提供する 唯一 のツールです。 強力なリスク管理 • ロングやショートの大きな偏り(インバランス)を特定し、潜在的なトレンド転換を見逃しません。ストップ
TPSpro TREND PRO は 、市場を自動的に分析し、トレンドとその各変化に関する情報を提供し、再描画せずに取引にエントリーするためのシグナルを提供するトレンド指標です。 インジケーターは各ローソク足を使用し、個別に分析します。上向きまたは下向きのさまざまな衝撃を指します。通貨、仮想通貨、金属、株、指数の取引への正確なエントリーポイント! バージョンMT5                   インジケーターの完全な説明     RFI LEVELS インジケーター と併用することをお勧めします。 主な機能: レンダリングなしで正確な入力信号! シグナルが表示されると、それは関連性を維持します。これは、シグナルを提供してからそれを変更し、その結果、入金された資金が失われる可能性があるリドローインジケーターとの重要な違いです。より高い確率と精度で市場に参入できるようになりました。矢印が表示された後、ターゲットに到達する (利益確定) か反転シグナルが表示されるまで、ローソク足に色を付ける機能もあります。 STOP-LOSS/TAKE-PROFITゾーンの表示 エントリーポイントを
Golden Trend Indicator MT5
Noha Mohamed Fathy Younes Badr
4.86 (14)
Golden Trend indicator  is The best indicator for predicting trend movement this indicator never lags and never repaints and never back paints    and give  arrow buy and sell    before the candle appear  and it will help you and  will make your trading decisions clearer its work on all currencies and  gold and crypto and all time frame This unique  indicator uses very secret algorithms to catch the  trends, so you can trade using this indicator and see the trend clear on charts  manual guide and
FX Levels: あらゆる市場における非常に高精度なサポート&レジスタンス 概要 通貨ペア、株式指数、個別銘柄やコモディティなど、どのような市場でも信頼できるサポートとレジスタンスを特定したいですか? FX Levels は伝統的な “Lighthouse” メソッドと先進的な動的アプローチを融合し、ほぼ汎用的な精度を実現します。ブローカーの実務経験を活かし、自動化されたデイリー更新とリアルタイム更新を組み合わせることで、 FX Levels は反転ポイントを見つけ、利益目標を設定し、自信をもってトレードを管理するための手助けをします。今すぐ試してみて、サポート/レジスタンス分析の正確性がどれほどトレードを向上させるかを実感してください! 1. FX Levels がトレーダーにとって非常に有用な理由 非常に正確なサポート&レジスタンスゾーン • FX Levels は異なるブローカー環境でもほぼ同一のゾーンを生成するよう設計されており、データフィードの差異や時刻設定のずれによる不一致を解消します。 • つまり、どのブローカーを利用していても一貫したレベルが得られるため、戦
指示する     ロシア     -        utilizar con   el indicador の ESP 推奨事項 -   TPSpro トレンド プロフェッショナル版 -   MT5のバージョン 最も重要なことは、将来においても最も重要なことです。 機能のプリンシパル: ゾーンのほとんどは、ベンダーとコンプラドールによってアクティブ化されます。 状況を直感的に把握できるよう、初期の衝動を修正します。 LOGIC AI: MUESTRA zonas (círculos) parabuscar puntos de entrada cuando se activa una plantilla 視覚的に優れた視覚効果があり、最も重要な機能がすべて揃っていることに注意してください。 優れたニベレス/ゾーンの視覚化 (modo MTF) 世界で最も人気のある場所/ゾーンです。これを使用するのに最適な方法です (   TPSproTREND PRO   )。 アルゴリズム プロフェッショナル セパラド パソ ア パソ パラ オペラ それは、オペラハウスやコントラ・デ・エラの指導におい
Gold Stuff mt5
Vasiliy Strukov
4.92 (173)
Gold Stuff mt5 は、金専用に設計されたトレンド指標であり、あらゆる金融商品にも使用できます。 インジケーターは再描画せず、遅れません。 推奨時間枠 H1. 設定と個人的なボーナスを得るために、購入後すぐに私に連絡してください!  トレンド スキャナーの強力なサポートを利用して、無料のインジケーターを入手し、プライバシーを守ります。あーみー!   設定 矢印を描く - オンオフ。 チャートに矢印を描く。 アラート - 可聴アラートのオンオフ。 メール通知 - オンオフ。 電子メール通知。 プチ通知 - オンオフ。 プッシュ通知。 次に、色域を調整します。 Gold Stuff mt5 は、金専用に設計されたトレンド指標であり、あらゆる金融商品にも使用できます。 インジケーターは再描画せず、遅れません。 推奨時間枠 H1. 設定と個人的なボーナスを得るために、購入後すぐに私に連絡してください!   設定 矢印を描く - オンオフ。 チャートに矢印を描く。 アラート - 可聴アラートのオンオフ。 メール通知 - オンオフ。 電子メール通知。 プチ通知 - オンオ
FX Power: 通貨の強弱を分析して、より賢い取引を実現 概要 FX Power は主要通貨と金の実際の強弱をあらゆる市場状況で理解するための必須ツールです。強い通貨を買い、弱い通貨を売ることで、 FX Power は取引の意思決定を簡素化し、高い確率の取引機会を見出します。トレンドを追従する場合でも、極端なデルタ値を使用して反転を予測する場合でも、このツールはあなたの取引スタイルに完全に適応します。ただ取引するだけではなく、 FX Power で賢く取引をしましょう。 1. なぜ FX Power がトレーダーにとって非常に有益なのか 通貨と金のリアルタイム強弱分析 • FX Power は主要通貨と金の相対的な強弱を計算し、マーケットダイナミクスに関する明確な洞察を提供します。 • どの資産がリードしているか、または後れを取っているかを監視して、取引するペアを賢く選びましょう。 マルチタイムフレームの包括的なビュー • 短期、中期、長期のタイムフレームで通貨と金の強弱を追跡し、マーケットトレンドに基づいて取引戦略を調整できます。 • スキャルピングからスイングトレード
これはMT5のインジケーターで、再描画なしで取引に参入するための正確なシグナルを提供します。 外国為替、暗号通貨、金属、株式、インデックスなど、あらゆる金融資産に適用できます。かなり正確な見積もりを提供し、取引を開始して終了するのに最適な時期を教えてくれます。1つのシグナルを処理しただけでインジケーターの元が取れた例の 動画 (6:22)をご覧ください。Entry PointsPro インジケーターの助けを借りたほとんどのトレーダーの最初の1週間の結果が改善しています。 Telegramグループ に登録してください。Entry Points Proインジケーターのメリットは次の通りです。 再描画のないエントリーシグナル 再描画されるインジケーターでは一度表示されたシグナルが削除されて大きな金銭的損失につながることがありますが、これと異なり、表示されて確認されたシグナルは消えることがありません。 エラーなしの取引開始 インジケーターアルゴリズムによって取引を開始する(資産を売買する)理想的な瞬間を見つけることができます。それを使用するすべてのトレーダーの成功率が向上します。 あら
まず第一に、この取引ツールはノンリペイント、ノンリドロー、ノンラグの指標であり、プロの取引に理想的ですことを強調する価値があります。 オンラインコース、ユーザーマニュアル、デモ。 スマートプライスアクションコンセプトインジケーターは、新米から経験豊富なトレーダーまで、非常 に強力なツールです。Inner Circle Trader AnalysisやSmart Money Concepts Trading Strategiesなど、20以上の有用な指標を1つに組み合わせています。このインジケーターはスマートマネーコンセプトに焦点を当て、大手機関の取引方法を提供し、彼らの動きを予測するのに役立ちます。 特に、流動性分析に優れており、機関がどのように取引しているかを理解しやすくしています。市場のトレンドを予測し、価格の動きを慎重に分析するのに優れています。機関の戦略とトレードを合わせることで、市場の動向についてより正確な予測ができます。このインジケーターは多目的であり、市場構造を分析し、重要な注文ブロックを特定し、さまざまなパターンを認識するのに優れています。 このインジケーター
Matrix Arrow Indicator MT5
Juvenille Emperor Limited
5 (13)
マトリックスアローインジケーターMT5は、すべてのシンボル/商品(外国為替、商品、暗号通貨、インデックス、株式)で使用できる100%再描画されていないマルチタイムフレームインジケーターに続くユニークな10in1トレンドです。マトリックスアローインジケーターMT5は、初期段階で現在のトレンドを判断し、最大10の標準インジケーターから情報とデータを収集します。 平均方向移動指数(ADX) 商品チャネルインデックス(CCI) クラシック平研アシキャンドル 移動平均 移動平均収束発散(MACD) 相対活力指数(RVI) 相対力指数(RSI) 放物線SAR ストキャスティクス ウィリアムズのパーセント範囲 すべてのインジケーターが有効な買いまたは売りシグナルを与えると、対応する矢印がチャートに印刷され、次のろうそく/バーの開始時に強い上昇トレンド/下降トレンドを示します。ユーザーは、使用するインジケーターを選択し、各インジケーターのパラメーターを個別に調整できます。マトリックスアローインジケーターMT5は選択されたインディケーターからのみ情報を収集し、それらのデータのみに基づいてアローを印刷
FX Dynamic: カスタマイズ可能なATR分析でボラティリティとトレンドを把握 概要 FX Dynamic は平均的な真のレンジ(ATR)の計算を活用して、日次および日中ボラティリティに関する卓越した情報をトレーダーに提供する強力なツールです。80%、100%、130%などのボラティリティ閾値を設定することで、通常の範囲を超えた際にすぐに警告を受け取ったり、有望な利益機会を素早く捉えられます。 FX Dynamic はブローカーのタイムゾーンに合わせて調整でき、安定したボラティリティ測定を維持しながら、リアルタイム分析のためにMetaTraderとシームレスに連携します。 1. なぜFX Dynamicがトレーダーにとって非常に有益か リアルタイムのATRインサイト • 日次・日中のボラティリティをひと目で把握。価格がATRの80%、100%、130%などに達したときに警告を受け取り、重要な水準にあるかどうかを確認できます。 • ボラティリティが完全に爆発する前に潜在的な反転やブレイクアウトを先取り可能。 幅広いマーケットへの適用 • 外国為替、コモディティ、株価指数な
IX Power: 指数、商品、暗号資産、外国為替市場の洞察を発見 概要 IX Power は、指数、商品、暗号資産、外国為替市場の強弱を分析するための多用途ツールです。 FX Power が全ての利用可能な通貨ペアデータを活用して外為ペアで最高の精度を提供する一方、 IX Power は基礎資産の市場データにのみ焦点を当てています。この特性により、 IX Power は非外為市場に最適であり、単純な外為分析にも信頼性の高いツールです。どのチャートでもスムーズに機能し、取引判断を向上させるための明確で実行可能な洞察を提供します。 1. IX Power がトレーダーにとって価値がある理由 複数市場での強弱分析 • IX Power は指数、商品、暗号資産、外為シンボルの強弱を計算し、それぞれの市場に合わせた洞察を提供します。 • US30、WTI、ゴールド、ビットコイン、または通貨ペアなどの資産を監視して取引機会を発見できます。 幅広い市場に適応 • 外為取引では、 FX Power が関連する全ての通貨ペアを分析することで比類のない精度を提供します。 • IX Power
このダッシュボードは、選択されたシンボルの最新の利用可能なハーモニックパターンを表示するので、時間を節約し、より効率的に /   MT4バージョン 。 無料インジケーター:   Basic Harmonic Pattern インジケーター列 Symbol : 選択したシンボルが表示されます。 Trend :   強気または弱気 Pattern : パターンの種類(ガートレー、バタフライ、バット、カニ、サメ、サイファー、ABCD) Entry : エントリー価格 SL: ストップロス価格 TP1: 1回目の利食い価格 TP2: 2回目の利食い価格 TP3:   3回目の利食い価格 Current price :   現在値 Age (in bars):    最後に描画されたパターンの年齢 主な入力項目 Symbols:   "28 Major Currency Pairs "または "Selected Symbols "から選択。 Selected Symbols:   カンマで区切られた監視したいシンボル("EURUSD,GBPUSD,XAUUSD")。ブローカーがペアに接
まず第一に、このトレーディングシステムがノンリペイント、ノンリドロー、ノンラグのインジケーターであることを強調する価値がある。これにより、手動取引とロボット取引の両方に理想的なものになっています。 オンラインコース、マニュアル、プリセットのダウンロード。 「スマートトレンドトレーディングシステム MT5」は、新規および経験豊富なトレーダー向けにカスタマイズされた包括的なトレーディングソリューションです。10以上のプレミアムインジケーターを組み合わせ、7つ以上の堅実なトレーディング戦略を備えており、多様な市場状況に対応する多目的な選択肢となっています。 トレンドフォロー戦略:トレンドを効果的に乗り越えるための正確なエントリーとストップロス管理を提供します。 リバーサル戦略:潜在的なトレンドの反転を特定し、トレーダーがレンジ相場を活用できるようにします。 スキャルピング戦略:高速で正確なデイトレードおよび短期取引のために設計されています。 安定性:すべてのインジケーターはノンリペイント、ノンリドロー、ノンラグであり、信頼性の高いシグナルを保証します。 カスタマイズ:個々の取引の嗜好に合わせ
サポートとレジスタンススクリーナーは、1つのインジケーター内に複数のツールを提供するMetaTraderの1つのレベルインジケーターにあります。 利用可能なツールは次のとおりです。 1.市場構造スクリーナー。 2.強気のプルバックゾーン。 3.弱気プルバックゾーン。 4.デイリーピボットポイント 5.毎週のピボットポイント 6.毎月のピボットポイント 7.ハーモニックパターンとボリュームに基づく強力なサポートとレジスタンス。 8.銀行レベルのゾーン。 期間限定オファー:HVサポートおよびレジスタンスインジケーターは、50ドルと生涯でのみご利用いただけます。 (元の価格125 $) MQL5ブログにアクセスすると、分析例を含むすべてのプレミアム指標を見つけることができます。 ここをクリックしてください。 主な機能 ハーモニックおよびボリュームアルゴリズムに基づく強力なサポートおよびレジスタンスゾーン。 ハーモニックおよびボリュームアルゴリズムに基づく強気および弱気のプルバックゾーン。  市場構造スクリーナー 毎日、毎週、毎月のピボットポイント。 ドキュメント すべてのサポートおよび
ATrend
Zaha Feiz
4.75 (12)
ATrend: その仕組みと使い方 仕組み MT5プラットフォーム向けの「ATREND」インジケーターは、テクニカル分析手法の組み合わせを利用して、トレーダーに堅牢な買いと売りのシグナルを提供するように設計されています。このインジケーターは主に、ボラティリティ測定のために平均真の範囲(ATR)を活用し、潜在的な市場動向を特定するためのトレンド検出アルゴリズムを併用しています。 購入後にメッセージを残すと、特別なボーナスギフトが贈呈されます。 主な特徴: - ダイナミックなトレンド検出: インジケーターは市場トレンドを評価し、シグナルを適宜調整することで、トレーダーが優位な市場環境に合わせて戦略を立てるのを支援します。     - ボラティリティ測定: ATRを使用することで、インジケーターは最適なストップロス(SL)とテイクプロフィット(TP)レベルを決定するために不可欠な市場ボラティリティを測定します。 - シグナルの視覚化: インジケーターは、チャート上に買いと売りのシグナルを視覚的に表示することで、トレーダーの意思決定を強化します。 操作手順 入力とセッティング - TimeF
今、147ドル(いくつかの更新後に499ドルに増加します) - 無制限のアカウント(PCSまたはMac) RelicusRoad ユーザー マニュアル + トレーニング ビデオ + プライベート Discord グループへのアクセス + VIP ステータス 市場の新しい見方 RelicusRoad は、外国為替、先物、暗号通貨、株式、および指数の世界で最も強力な取引インジケーターであり、トレーダーに収益を維持するために必要なすべての情報とツールを提供します。初心者から上級者まで、すべてのトレーダーが成功するためのテクニカル分析と取引計画を提供します。これは、将来の市場を予測するのに十分な情報を提供する重要な取引指標です。意味をなさないチャート上のいくつかの異なる指標ではなく、完全な解決策を信じています.これは、信号、矢印 + 価格アクション情報を表示するオールインワンのインジケーターで、他に類を見ない非常に正確です。 強力な AI に基づいて、RelicusRoad は不足している情報とツールを提供して、あなたを教育し、トレーディングのプロ、成功したトレーダーにします。 ほと
トレンド検出インジケーターはあらゆる戦略を補完し、独立したツールとしても使用できます。 インジケーターの操作に関する推奨事項、コメント   #8   でダウンロードできます 利点 使いやすく、不要な情報でチャートを過負荷にしません。 あらゆる戦略のフィルターとして使用できます。 利益を得るのとストップロスを設定するの両方に使用できる動的なサポートとレジスタンスのレベルが組み込まれています。 ローソク足が閉じた後、インジケーターの色は変わりません。  株式市場、指数、石油、金、およびすべての時間枠で機能します。 トースト通知、電子メール通知、プッシュ通知、サウンドアラートの機能があります。 私の他の開発はここで見つけることができます: https://www.mql5.com/ja/users/mechanic/seller 入力パラメータ Alert-オン/オフ。アラート; Push Notification-オン/オフ。プッシュ通知; Mail-オン/オフ電子メール通知; Fibo 1,2,3,4,5,6,7,11,21,31,41,51,61,71-動的サポートと抵抗レベル
Was: $249  Now: $149   Market Profile defines a number of day types that can help the trader to determine market behaviour. A key feature is the Value Area, representing the range of price action where 70% of trading took place. Understanding the Value Area can give traders valuable insight into market direction and establish the higher odds trade. It is an excellent addition to any system you may be using. Inspired by Jim Dalton’s book “Mind Over Markets”, this indicator is designed to suit the
I just sell my products in mql5.com, any other websites are stolen old versions, So no any new updates or support. - Lifetime update free -   Real price is 80$   - 25% Discount ( It is 59$ now ) Contact me for instruction, any questions! Related Product:  Gold Trade Expert MT5 - Non-repaint Introduction The breakout and retest strategy is traded support and resistance levels. it involves price breaking through a previous level.  The break and retest strategy is designed to help traders do two
Was: $299  Now: $149  Supply Demand uses previous price action to identify potential imbalances between buyers and sellers. The key is to identify the better odds zones, not just the untouched ones. Blahtech Supply Demand indicator delivers functionality previously unavailable on any trading platform. This 4-in-1 indicator not only highlights the higher probability zones using a multi-criteria strength engine, but also combines it with multi-timeframe trend analysis, previously confirmed swings
!SPECIAL SALE!  The Trend Forecaster indicator utilizes a unique proprietary algorithm to determine entry points for a breakout trading strategy. The indicator identifies price clusters, analyzes price movement near levels, and provides a signal when the price breaks through a level. The Trend Forecaster indicator is suitable for all financial assets, including currencies (Forex), metals, stocks, indices, and cryptocurrencies. You can also adjust the indicator to work on any time frames, althoug
まず第一に、この取引インジケーターは再描画されず、再描画されず、遅延しないことを強調する価値があります。これにより、手動取引とロボット取引の両方に理想的なものになります。 ユーザーマニュアル:設定、入力、戦略。 アトミックアナリストは、価格の強さとモメンタムを利用して市場でより良いエッジを見つけるためのPA価格アクションインジケーターです。ノイズや誤ったシグナルを除去し、取引ポテンシャルを高めるための高度なフィルターを備えています。複雑なインジケーターの複数のレイヤーを使用して、アトミックアナリストはチャートをスキャンし、複雑な数学的計算をシンプルなシグナルと色に変換します。これにより、どのような初心者トレーダーでも理解して使用し、一貫した取引の決定を行うことができます。 「アトミックアナリスト」は、新規および経験豊富なトレーダー向けにカスタマイズされた包括的な取引ソリューションです。プレミアムインジケーターとトップノッチの機能を1つの取引戦略に組み合わせ、すべてのタイプのトレーダーにとって汎用性のある選択肢にします。 デイリートレーディングとスキャルピング戦略:高速で正確なデイ
Fxaccurate Trend Trading is a method that focuses on identifying and capitalizing on market trends in the foreign exchange (Forex) market. This strategy is grounded in the principle that once a trend is established, it tends to persist, allowing traders to enter positions that align with the market's prevailing direction. Fxaccurate Trend Trading relies on various tools, indicators, and methodologies to spot, confirm, and trade in the direction of a trend, whether it’s upward (bullish) or downwa
スイングトレーディング は、トレンドの方向のスイングと可能な反転スイングを検出するように設計された最初のインジケーターです。トレーディングの文献で広く説明されているベースラインスイングトレーディングアプローチを使用します。インディケータは、いくつかの価格と時間のベクトルを調査して、全体的なトレンドの方向を追跡し、市場が売られ過ぎまたは買われ過ぎて修正の準備ができている状況を検出します。 [ インストールガイド | 更新ガイド | トラブルシューティング | よくある質問 | すべての製品 ] むち打ちを起こさずに市場スイングの利益 インジケーターは常にトレンドの方向を表示します 色付きの価格帯は機会のベースラインを表します 色付きのダッシュは、可能な反転スイングを表します この指標は、独自の品質とパフォーマンスを分析します 複数時間枠のダッシュボードを実装します カスタマイズ可能なトレンドおよびスイング期間 電子メール/サウンド/プッシュアラートを実装します インジケータは再描画またはバックペインティングではありません Swing Tradingとは Swing Tradingは
The indicator very accurately determines the levels of the possible end of the trend and profit fixing. The method of determining levels is based on the ideas of W.D.Gann, using an algorithm developed by his follower Kirill Borovsky. Extremely high reliability of reaching levels (according to K. Borovsky  - 80-90%) Indispensable for any trading strategy – every trader needs to determine the exit point from the market! Precisely determines targets on any timeframes and any instruments (forex, met
このインディケータは、1つのウィンドウで複数のタイムフレームのトレン ド方向を表示します。複数のタイムフレームのトレンドが一致する場合、矢印が描かれます。 また、ヒストグラムに切り替えて、現在のタイムフレームのトレンドを表示することもできます。 このインディケータは、チャート上にエントリーポイントとおおよそのエグジットポ イントを描画します。 警告:このインディケータはマルチタイムフレームであるため、ストラテジーテスターで使用する場合は、必要なすべてのタイムフレームの相場を事前にダウンロードしておく必要があります。テスターで長い間相場のダウンロードを待たずに済むように、開始日を2025.01.01とし、モデルを「オープンプライスのみ」または「コントロールポイント」とすることができます。 MT4用インジケーターバージョン 特徴     このインディケータは再描画しません。ヒストリカルチャートに表示されているものがリアルタイムで表示されます。     暗号通貨、株式、金属、指数、商品、通貨など、あらゆる資産の取引に使用できます。     すべてのタイムフレームに対応。     エン
Royal Scalping Indicator is an advanced price adaptive indicator designed to generate high-quality trading signals. Built-in multi-timeframe and multi-currency capabilities make it even more powerful to have configurations based on different symbols and timeframes. This indicator is perfect for scalp trades as well as swing trades. Royal Scalping is not just an indicator, but a trading strategy itself. Features Price Adaptive Trend Detector Algorithm Multi-Timeframe and Multi-Currency Trend Low
作者のその他のプロダクト
The fact that round number levels have a significant influence on the market cannot be denied and should not be overlooked. These psychological levels are used by both retail Forex traders and major banks that deal in Forex.  Very simple and effective indicator and most importantly free. ////////////////////////////////////////////////////////////////////////////////////////////////////////////////////////////////////////////////////////////// The program does not work in the strategy tester.
FREE
This indicator displays the histogram and arrows on chart. When Simple The Best Pro are placed on a chart, they identify the trend.  The color of may be blue or red. The blue color stands for upside moves and the red color stands for downside trends. The indicator offers to set Stop Loss (SL) and  Take Profit (TP)  setting. The default value is ATR. Indicator has automatic optimization. The STB is a unique indicator that shows the tendency (button Bars) of a particular signals. The STB tells us
Do you like to trade on EURUSD and GBPUSD?  This expert may be for you. Trading starts with pending orders: buylimit and selllimit. The second order is at the market price - the so-called probing order (reduces risk). Then the EA adjusts subsequent orders according to the market situation. Both the first and subsequent orders are closed based on a trailing stop. The expert selects the volume himself, as well as how many positions will be closed.          input start_enum      inp_start= 2 ; //S
Commercial version of open code . A forex trader can create a simple trading strategy to take advantage trading opportunities using MA Histogram or associated indicators. MA Histogram are used primarily as trend indicators and also identify support and resistance levels. Improved version 1.30 XXX Added:  Take Profit  Stop Loss  Automatic optimization  Result  R/R  Consecutive losses
Virtual Bot MT5
Szymon Palczynski
5 (1)
A real girder with "blood and bones". Virtual Bot  will open virtual trades, using them to monitor the market to determine the entry point(according to the inputs parameters), at which point Virtual Bot  will start opening real trades.    It is recommended to test this Expert on demo account or cent account.  Input Parameters input group           "..........Choice..........." ;         input start_enum      start= 2 ; //Start input uchar            starting_real_orders= 4 ; //Start opening rea
I personally love trading robots, but there are many situations where semi-auto trading is superior to automation. The system is very simple and effective.  Trend lines are typically used with price charts, however they can also be used with a range of technical analysis charts such as CCI and RSI.  What is the trend line?  Trend line is a bounding line for the price movement. It is formed when a diagonal line can be drawn between a minimum of three or more price pivot points. A line can be
Smart Grid Executor is an Expert Advisor built for MetaTrader 4 platform only. Smart Grid Executor will work on all account types and sizes on MetaTrader 4 brokers (outside of NFA regulations). Recommended leverage >= 1:500. Features Multicurrency EA Interval - H1 recommended Working with 4 and 5-digit brokers Working with Martingale Automatic multiplier Working with ECN Input Parameters Name - Smart Grid Executor v 4.00 Start - Short & Long, Only Long, Only Short. Time Frame [Recommended H1]-
V Max NX
Szymon Palczynski
Hundreds of possible combinations and only two strategies. By using automated software like an EA, you can benefit from the following advantages: it can trade while you are sleeping, it is not susceptible to emotions and you can quickly run backtests. However, it is hard to ascertain whether an EA will help you to achieve consistent profits. Lots of EAs are profitable on a demo account, but for some unknown reason, when the trader tries to apply it on a live account with their own funds, suddenl
Currency Correlation Plus is an expensive version of the indicator. It is equipped with the signal and is more equipped than its cheaper brother. The indicator helps us understand and see a correlation. Second chart makes it easy to analyze and trade multiple currencies. On the chart, you can post multiple pairs. Type in the selected currency pair in the settings and add it to the chart. Inputs One indicator on chart=True / two or more=False Alert Signal buy and sell for first chart and second
AMD Trend Risk Reward is an indicator which belongs to the group of trend indicators. It provides the possibility to take the correct decisions about timely market entrances or exits. Trend horizontal can cause a lot of headaches to the traders and can be the reason of money loss. By automatic optimizing the settings of our AMD Trend Risk Reward indicator you can avoid most of them and save your money. How to choose the best chart? Press the button [O] on the chart. Indicator automatically optim
AMD Exclusive
Szymon Palczynski
5 (1)
AMD Exclusive characterized by high efficiency and can constitute a complete system. Indicator based on Price Action, Statistics and Overbalance. We encourage you to study indicator on its own until you know the tendencies of how it behaves relative to price movement. Indicator automatically optimizes time frame M15, M30, H1, H4, D1 and W1 (press the button [O] on the chart). Filter OVB (overbalance) has three modes: Manual [button F on chart]. Semi-automatic [button F on chart]. Automatic [butt
One of the biggest problems you will face as trader is finding the right system for myself. AMD Exclusive Two can constitute a complete system for you. Don’t follow the arrows, without thinking twice. Trading using a whole system.  What we have? Automatic optimization Overbalance (manual, semi-automatic and automatic) Main and additional signals Fibonacci Pivot Linear Regression Channel Mini Tester Early warning system (yellow cloud on the chart) 3D effect Button On Chart Button [Start] - Start
I am writing as is. Remember... "Another alarming fact can be a huge profit stated in the description of a trading robot. If the attached Strategy Tester reports show a sky-high balance, it most likely has to do with curve fitting. Often developers of such "money printing machines" do not even realize that their system is over-optimized and has too many external parameters. Let us support this assertion by another chart from the above-mentioned report   Optimization VS Reality: Evidence from ATC
Spider Bot Pro
Szymon Palczynski
3.67 (3)
No fabricated fake forward tests or meaningless optimized backtests. No artificial intelligence and similar things. In fact, there are frequently sharp differences between backtest results and actual results. One of the limitations of backtest is that they are generally prepared with the benefit of hindsight. Spider Bot Pro uses a developed innovative technology involving virtual grid. Simply put, Spider will build virtual grid in the background, using them to constantly monitor the market to he
Please Note:  The new version 3.10 default settings have been changed. If the default settings seem to bad for you this feel free to run a variation of your own settings. Remember to check the new EA for required margin and balance for your settings. Version 3.10 added the ability for greater profitability and slightly safer exits with 5 new parameters: - Multiplier - Next Multiplier - Take Profit (Chart) - Next Take Profit (Chart) - Repeated  The strategy is based on Bollinger Bands. It ass
Multi-currency expert. Mission Impossible is a fully automated trading system on all major currency pairs. Very focused on small gains with minimizing the risk of loss (see  Entering/ Ellipse/Ellipse Size).  Advantage thanks to technique.  Not for complete amateurs taking too much risk !!! Forex is a risky business on itself - remember. Systems - Partial closing. - Run. - Open bar/ Every Tick.  Recommended: - VPS or Remote Desktop (e.g Chrome  Remote Desktop) Input Parameters Start Deposit - 
Virtual Bot Pro will open virtual trades, using them to monitor the market to determine the entry point(according to the inputs parameters), at which point Virtual Bot Pro will start opening real trades.  It is recommended to test this Expert on demo account or cent account.  Input Parameters TF - the choice of time frame Start - choose whether you want to trade long or short positions only or both. Trend  Disabled  Enabled TF Trend - the choice of Time Frame for trend.   Spread - for 5 digit
My new system... This is not a regular channel. Who is it for: - For people who want to understand the market. Tested and used in the real market (I use and not just encodes) Important !!! The system requires thinking. Only for real traders. If you are looking for a holy grail - please don't bother me. Is it possible? Trading has never been so easy. A combination of fibonacci and an intelligent channel plus levels of support and resistance. Setting out a channel is now very easy. Chan
Veil
Szymon Palczynski
Dualistic indicator with multi-functional panel. Using trading indicators is part of any technical trader’s strategy. Paired with the right tools, it could help you gain more insight into price trends. The Veil indicator combines price points of a financial instrument over a specified time frame and makes summary calculations. In a nutshell, it identifies market trends, showing current support and resistance levels, and also forecasting future levels. Is the system important?  "The AMOUNT of mo
V Max
Szymon Palczynski
One of the most common Bollinger Band strategies is using them to gauge if a market is overbought or oversold.A lot of traders will use these bands and look for price to revert back the middle band or to the mean.When using a mean reversion strategy we are assuming that if price deviates or moves too far away from the mean it will eventually have to come back.This is often looked at as price moving back from an overbought or oversold market into more true value. Bollinger Bands react to price a
MA Histogram Pro is an expensive version of the indicator. It is equipped with the second Take Profit (TP) and is more equipped ( has a positive optimization method) than its cheaper brother.  Simple and effective system with automatic optimization. See my forecasts . MA Histogram are used primarily as trend indicators and also identify support and resistance levels. Equipment:  Take Profit 1    Take Profit 2   Stop Loss  Automatic optimization  Result  R/R  Consecutive losses
Envelopes System
Szymon Palczynski
5 (1)
The Simple Envelopes forex trading strategy combines the popular envelopes indicator and two others(ATR, Trend indicator) to look for trade entry  in the direction of the major trend. What are Moving Average Envelopes? A moving average envelope consists of a   moving average and two other lines . One line is above the moving average and the other line is below the moving average. Together, these two lines form an upper and lower envelope. Entry example:  Upper Envelope: 14-day SMA + (14-day SM
Professional strategy This EA clearly controls the market and and performs a statistical price analysis.  The best technologies for professional trading: universal strategy that always works! All this is available in this versatile robot! What should be remembered. Some advice: Don't buy at the top and sell at the bottom.  Play with the main trend. Calculate your entry risk. If possible, it is better to choose the market, which is the most suitable for this trading strategy. If you do not have
Price reach indicator. It also serves as the perfect term for supports and resistance. I use it in two experts. The basic tool for professional trading. The indicator analyzes the last 500 bar and uses this to determine the levels ( but it doesn't predict the future ) . Personally, I use it on TF H1.  It is very simple. Four lines on chart and that's all. Only two input parameters.  Thousands of indicators. Why this? Is good ? No! Is very good. Please test the indicator prior to purchasing.
Rediscover trading. The future of Forex is intuitive hybrids. Hello, my name is Szymon, I am a professional algorithm developer for trading on financial markets forex. Working experience in finance and programming for more than 10 years. I specialize in grid systems and martingale. Black Horse EA is an automated forex robot (this is not your usual grid or martingale). This EA trades based on the breakout of price levels (according to the mathematical algorithm, it determines the area of ​​a ran
This EA clearly controls the market and performs a statistical price analysis.  The best technologies for professional trading: a universal strategy that always works! All this is available in this versatile robot! What should be remembered? Some advice: Don't buy at the top and sell at the bottom.  Play with the main trend. Calculate your entry risk. If possible, it is better to choose the market, which is the most suitable for this trading strategy. If you do not have a proven expert, you ca
Dual Space Time
Szymon Palczynski
5 (1)
Important !!! Only for real traders. If you are looking for a holy grail - please don't bother me. Multi-currency expert.          At the beginning, I suggest: EURUSD and GBPUSD               Tested in three steps ( Tester/Demo/Real  ) TF - H1  recommended Personally i use M1 for EURUSD only The most important thing is to get out of position                     "Stable version. Tester/Demo/Real ";                      "  Applied systems:";            "- Positioning system";           "- Pa
The Forex grid trading strategy is a technique that seeks to make a profit on the natural movement of the market. The robot is designed to trade on GBPUSD, but can also trade on other pairs. EA has the advantage of simplicity and a unique position enhancer. What is important. Positions are opened at the close of the candle.  Input parameters: Start   Trend in pips. Comment; Max Spread (Digits 5) Slippage Magic Number  Stop Loss Take Profit (first position)  Average Take Profit  PipsStep for gri
Nimitz-type expert. Simply atomic. I am an automated trading geek but I think the future for me is hybrid trading. I think hybrid commerce has a huge future. While many grid traders finish up with huge drawdowns, I don't believe it is inevitable. Of course, risks are and always will be. Many of my testing and investigation suggests that grid (position averaging) trading is possible with consistently very modest drawdown. If achieved, this then makes grid trading a very attractive proposition. Ma
Katana FX Infinity uses a newly developed innovative technology involving a "smart multiplier". Simply put, Katana intelligently selects the size of the positions It works best on EURUSD, GBPUSD, EURCHF, USDCAD, AUDCAD but can be traded on virtually any chart. Katana FX Infinity is a middle-term trend advisor working best on TF H1 with the usage of the price channel. Like all my EA, it undergoes rigorous testing. He works on a real account and is constantly being improved. I have been creating
フィルタ:
レビューなし
レビューに返信
バージョン 1.20 2025.01.15
Added Font Size in input parameters. Minor fixes.
バージョン 1.10 2022.02.05
Increased maximum N_bars to 1200 ( 1000 default).
Index calculation has been improved.
Added ability to quickly view 28 currency pairs. Press the [Tab] key.
Added feature to quickly display the index for the current chart. Press [Q] and move the mouse cursor to the left side of the chart.