
Ticks MACD
- インディケータ
- Andrej Nikitin
- バージョン: 1.12
- アップデート済み: 18 11月 2021
- アクティベーション: 5
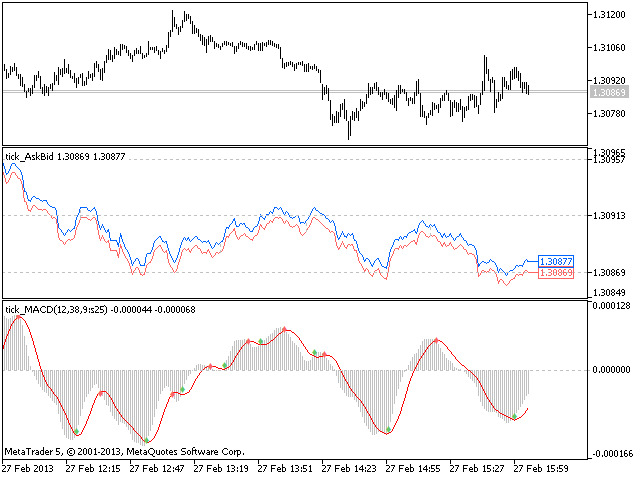
The Moving Average Convergence/Divergence(MACD) indicator drawn using a tick chart.
After launching it, wait for enough ticks to come.
Parameters:
- Fast EMA period - indicator drawn using a tick chart.
- Slow EMA period - slow period of averaging.
- Signal SMA period - period of averaging of the signal line.
- calculated bar - number of bars on the chart for the indicator calculation.
The following parameters are intended for adjusting the weight of MACD signals (from 0 to 100). You can find their description in the Signals of the MACD oscillator section of MQL5 Reference.
- The oscillator has required direction.
- Reverse of the oscillator to required direction.
- Crossing of the main and signal line.
- Crossing of the main line and the zero level.
- Divergence of the oscillator and price.
- Double divergence of the oscillator and price.
Buffer indexes: 0 - MACD_LINE, 1 - SIGNALLINE, 4- SIGNAL_UP, 5- SIGNAL_DOWN.


Sorry I see one has to open market window inside terminal and install from there. Works fine then