Engulf with Bollinger Bands and MA Scanner
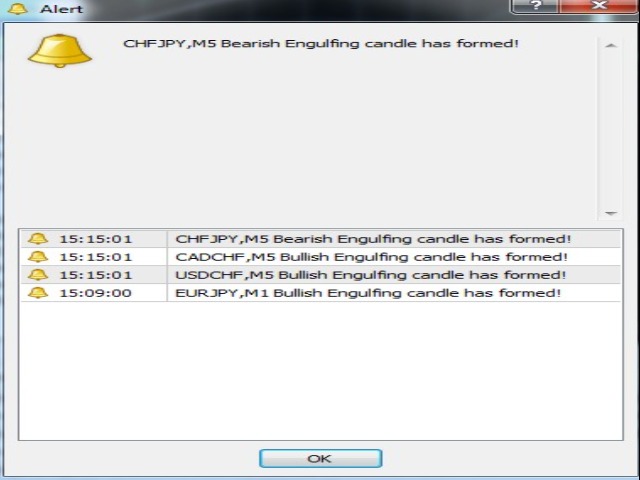
WIth this multi time frame and pair Scanner, you can find Engulfing pattern that touch bollinger bands + optional moving average rule.
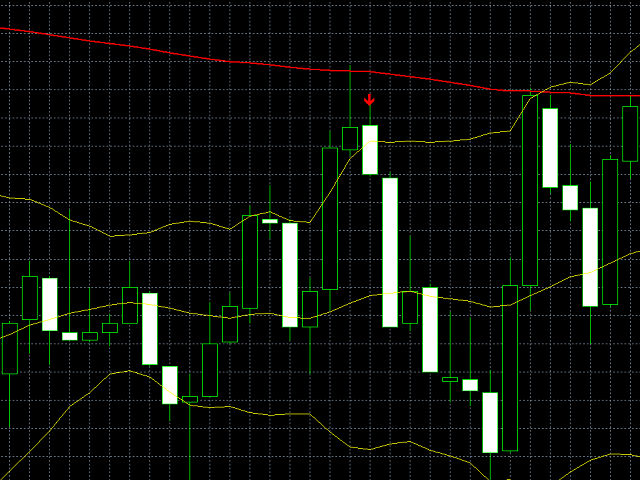
For bearish engulf to form, second body (bearish) must be bigger than first (bullish) and one of them must be touching upper bollinger band with closed price.
For bullish engulf to form, second body (bullish) must be bigger than first (bearish) and one of them must be touching lower bollinger band with closed price.
You can also use moving average rule, so bearish engulf must be below MA, and bullish engulf above MA with closed price body.
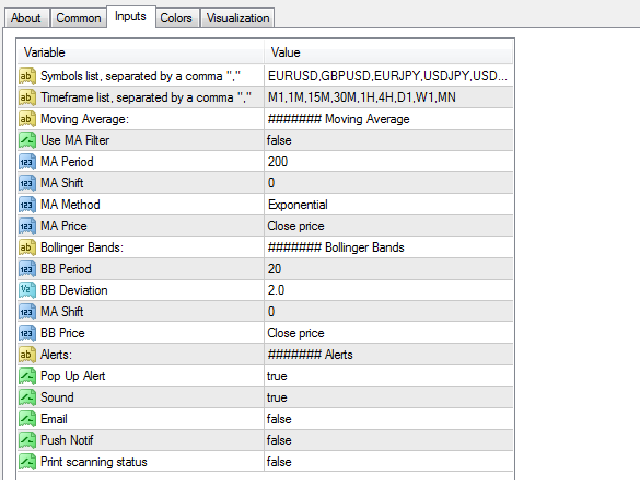
Settings are simple standard settings for moving average and bollinger bands.
As for scanning, there is simply inputting:
- pairs with comma (for example: EURUSD,GBPUSD,USDCAD,etc.)
- time frames with comma (for example: M1,M5,M15,M30,H1,H4,D1,W1,MN1)