Super Signals Channel Indicator
- インディケータ
- Tshivhidzo Moss Mbedzi
- バージョン: 1.0
- アクティベーション: 10
Super Signals Channel Indicator
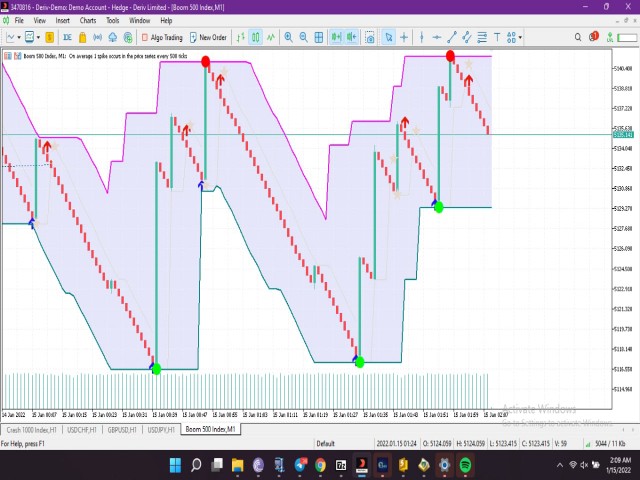
Its channel is a non-repaint indicator that reacts more with recent price movements. For this reason, the Super Signals Channel Indicator is a better match for short-term or day trading strategy.
The Super Signals Channel only plots swing trading opportunities. So most of its trade signals appear during consolidation or sidelined periods of the market. Super Signals Channel Indicator for MT5 ExplanationThe green band below the price shows the dynamic support level. This indicator on
For instance, a bullish pin bar with a long tail and rejecting the green line. The green uppish arrow below the dynamic support indicates a buy signal.
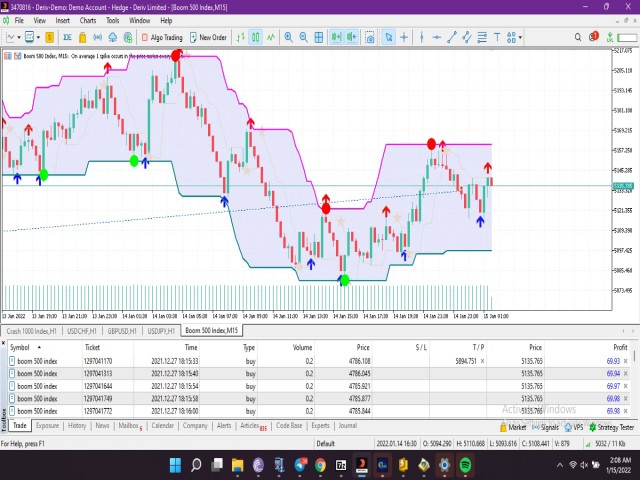
We’ll look for a sell setup when the price gets closer to the higher super-channel. In that case, the price needs to plot at least one bearish candlestick pattern before confirming a sell order.
Thankfully, you don’t need to spot the candlestick patterns by yourself.
Super Signals: Buy Conditions- The price hits the lower Super Signal Channel band and refuses to break below the support
- A bullish candle appears rejecting the channel support
- The indicator plots a green arrow to signal a buy order
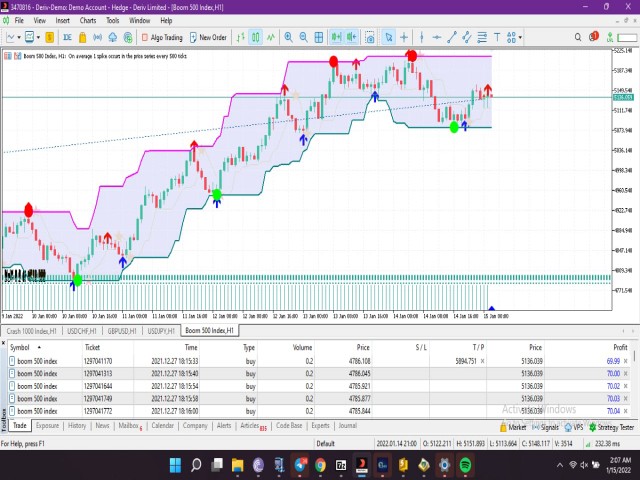
- Exit the buy order after you find a red arrow near the higher band
- The price rejects the higher band and refuses to move above the resistance zone
- The price plots a bearish candlestick pattern near the dynamic resistance
- Open sell order after the indicator displays a red arrow
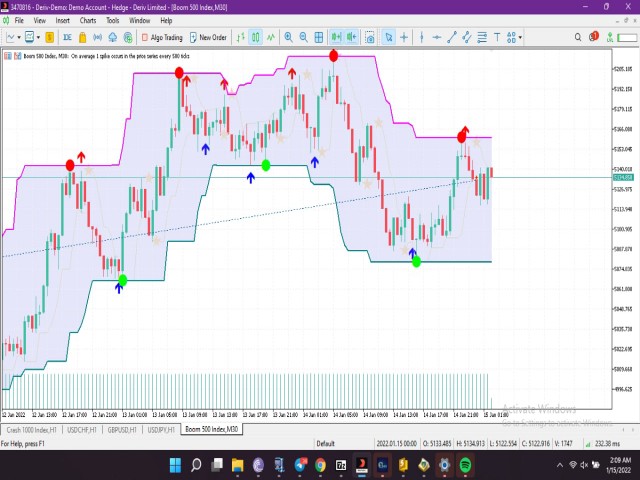
- Exit short when the Super Signal Channel plots a green arrow


ユーザーは評価に対して何もコメントを残しませんでした