• 概要
  • レビュー
  • コメント (1)
  • 最新情報

Coral Trade Planner

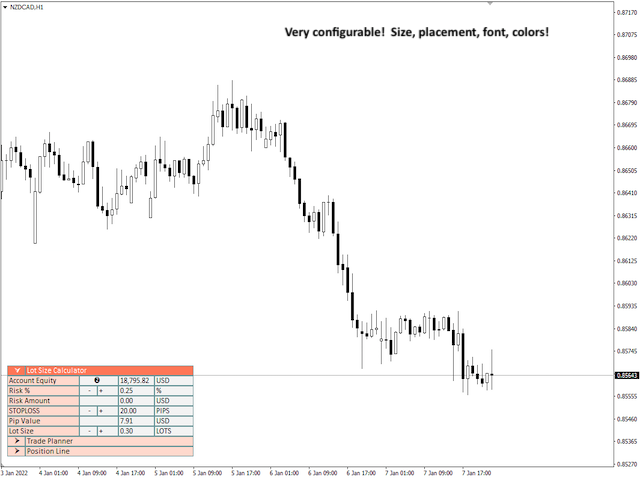
Coral Trade Planner is a 3-in-1 tool for making smart trades.  

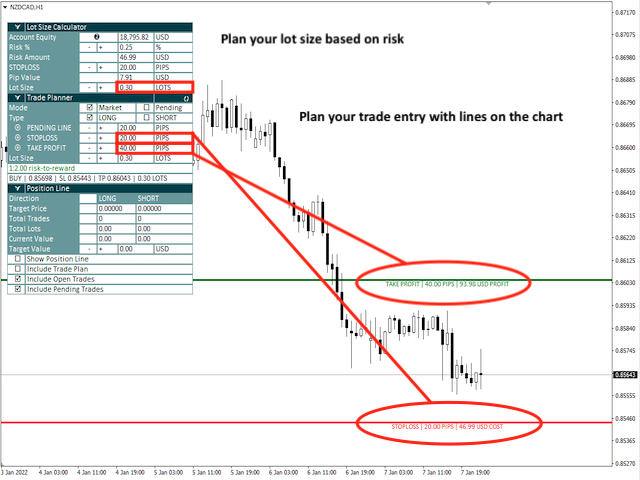
  • The Lot Size Calculator lets you determine the appropriate lot size based on risk, and see the impact on your risk as you change the stop loss distance and/or lot size.  
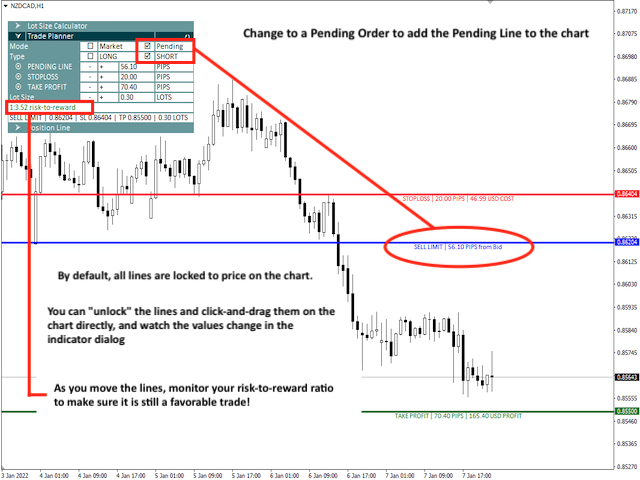
  • The Trade Planner is an innovative tool for visualizing your planned trades on the chart, and gives you immediate feedback on the value of the trade (both the risk of hitting your stop loss and the reward of hitting your take profit).  Both Market and Pending orders are supported, and all order types.  
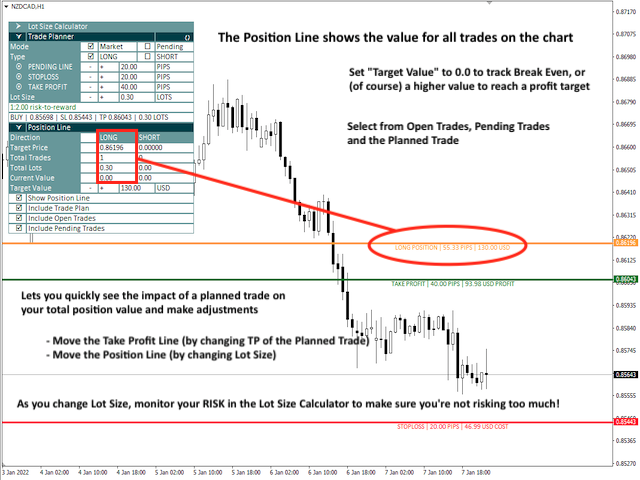
  • The Position Line shows the target price for all open positions on the chart (both long and short), and lets you see the impact of your planned trade on the overall position.  More than just a "break even" line, you can set the target value for the position (who ever wants to close their trades at break even?), and compare the planned trade's take profit price to the position's target price.  From here you can easily tweak things like your take profit and/or lot size while watching the impact on your overall risk, to make the most well-informed trades of your trading career!

While planning your trade you can either use the step buttons in the Planner window to modify your price lines, or you can "unlock" the lines to drag the lines on the chart to place them more precisely by hand.  While the lines are "locked" they will follow price as it moves on the chart.

When you have completed your planning and are ready to enter a trade, there are 3 companion scripts that are provided to help you.  The "TEST" script will prepare the trade and print a test message to the console to tell you what it would have done, but without actually submitting an order.  The "NOW" script will immediately execute the trade plan by sending the order, and clear the planned trade from the chart.  And the "INPUTS" script will give you the opportunity to set an order message and magic number before sending the order.  

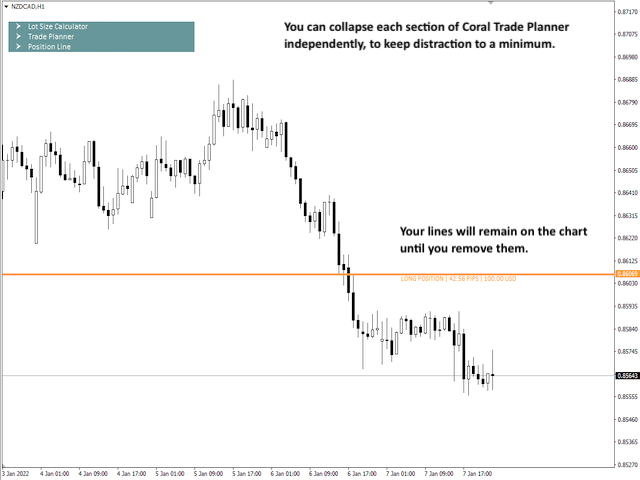
Coral Trade Planner has many configuration options, from window placement, colors, default parameters for the tools and many others.  There are lots of shortcuts built-in as well, such as automatically setting TP and SL lines at a 1:2 RR ratio based off the Lot Size Calculator's SL setting; automatically setting the planned trade's lot size to match the full position size; resetting risk% to the default; and so on.

NOTE on Product Demo:

Because Coral Trade Planner works on open orders (both planning orders and visualizing existing orders on the chart), there are some limitations in the Strategy Tester.  Most notably, the Position Line will not display information on simulated orders placed in the Strategy Tester.  As a result, you will only be able to see the Position Line reflect the current Planned Trade, not any open or pending orders. 

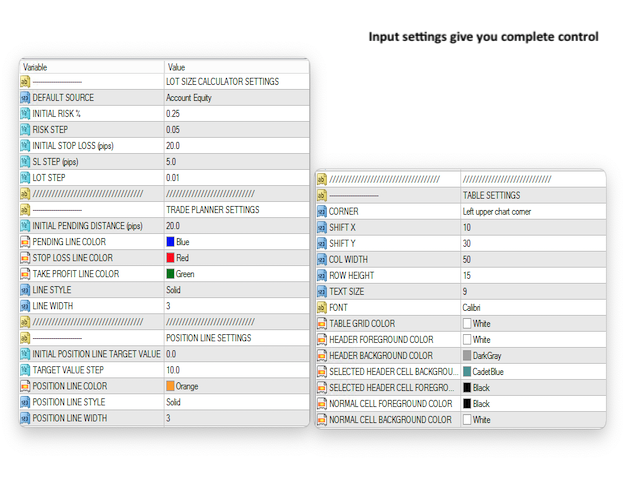
Coral Trade Planner Inputs

LOT SIZE CALCULATOR SETTINGS

  • DEFAULT SOURCE - The initial selection of Account Balance, Account Equity and Account Free Margin.  
  • INITIAL RISK % - The initial value for risk %.  
  • RISK STEP - How much the risk% goes up or down when clicking the "+" and "-" buttons
  • INITIAL STOPLOSS (pips) - A default stop loss size for the Lot Size Calculator.  
  • SL STEP (pips) - How much the Stop Loss goes up or down when clicking the "+" and "-" buttons
  • LOT STEP - How much the Lot Size goes up or down when clicking the "+" and "-" buttons

TRADE PLANNER SETTINGS

  • INITIAL PENDING DISTANCE (pips) - When creating a Pending order, how far to initially place the entry line from Bid/Ask.
  • TRADE LINE / STOP LOSS / TAKE PROFIT LINE COLOR / STYLE / WIDTH - Visually control how your lines look (note that only solid lines support a width > 1)

POSITION LINE SETTINGS

  • INITIAL POSITION LINE TARGET VALUE - The initial target value for position lines, default value is 0.0 (break even). 
  • POSITION LINE COLOR / STYLE / WIDTH - Visually control how your position lines look (note that only solid lines support a width > 1)

TABLE SETTINGS

  • CORNER - Standard MQL4 window placement: left upper, right upper, left lower, right lower.
  • SHIFT X, SHIFT Y - Offsets for window placement
  • COL WIDTH, ROW HEIGHT - If you adjust the font or font size, you may need to adjust the cell height/width. The cell width only applies to some of the columns where values are displayed, however.
  • TEXT SIZE, FONT - Pick something you like.  :)
  • TABLE COLORS - A variety of color options for how your table looks on the chart.  


おすすめのプロダクト
This indicator compares the pips of the current day with the average of pips made in the previous three days. The "Percentage today range" is red if today's figure is less than the range of the previous three days, but turns green when the percentage exceeds 100%. When the range exceeds 100% there are good trading opportunities because we are in the presence of increased volatility of the past three days. Best use with Banks Day Levels indicator. Parameters settings corner (indicator display p
This panel is designed for quick visual search for the price action patterns on several instruments simultaneously. It is possible to add and remove instruments. Clicking the signal button allows you to quickly move to the chart with the identified pattern and timeframe. The panel searches for 8 candlestick patterns: PIN-BAR, EXTERNAL BAR, INSIDE BAR, DOJI, LEVEL, HIGH/LOW OF N BAR, FAKEY, ONE-WAY N BAR. Any of the patterns or the periods can be disabled by clicking its title. It can also search
PnL Calendar MT4
Keni Chetankumar Gajanan -
Monitoring your trades over time helps you build up your account balance and shows when you miss your goals. Viewing the closed trades of a symbol on the chart can help you adjust your strategy for better results. Maintaining a trade book allows you to record the applied strategy and note the reason for taking each trade. It helps you to evaluate and refine strategies based on its profitability. A possibility to download the Account history as a text file with delimited fields, allows upload to
Trend reversal indicator, no repainting. Clean and light rendering There is no alternative buy-sell signal without taking into account the trend. Noise filtering capability. Works with all pairs. Ideal for beginners and experienced traders It is best used on timeframes above the M30, from the beginning of the London session to America. It should be remembered that there are no indicators that are not wrong. Any strategy requires confirmation of its signals. When building your own system, it
Hello This EA for send any indicator Signals (buffer) to your channel in Telegram with photo for chart also you can share your signals with your clients in your telegram please watch the photos you must have Telegram channel then make bot and give it Permission and get token (watch this video to know how do it) https://www.youtube.com/watch?v=x1bKWFOjSBE and you must download this files https://drive.google.com/file/d/1pYpnWUr4Kb4aIwdoGVD_9zSH1HWX-tt3/view?usp=sharing then unzip files the
Spread Pulse   インジケーターは、トレーダーにチャート上の現在のスプレッドに関する情報を提供する効果的なツールです。 スプレッドとは、商品の購入価格と販売価格の差です。 インジケーターは、チャート上に表示されるテキストの形式で表示されます。 これにより、トレーダーは現在のスプレッドを簡単に追跡できます。 Spread Pulse インジケーターの主な利点の 1 つは、その色の視覚化です。 見開きサイズに応じて文字色が変わります。 デフォルトでは、スプレッドが小さい場合、テキストは緑色になります。これは、スプレッドが低く、取引がより収益性が高い可能性があることを意味します。 ただし、スプレッドが高くなると、インジケーターのテキストが自動的に赤に変わります。 さらに、ユーザーは高スプレッドと低スプレッドに関連する色をカスタマイズできます。 情報を読みやすくするためにフォント サイズを変更することもできます。 Spread Pulse インジケーターは、経験レベルや取引戦略に関係なく、あらゆるトレーダーにとって理想的です。 現在のスプレッドに関する情報に素早く
The EasyTrend is a seemingly simple but quite powerful trend indicator. Everyone has probably come across indicators or Expert Advisors that contain numerous input parameters that are difficult to understand. Here you will not see dozens of input parameters, the purpose of which is only clear to the developer. Instead, an artificial neural network handles the configuration of the parameters. Input Parameters The indicator is as simple as possible, so there are only 2 input parameters: Alert -
A Utility used for accounts with multiple open positions with Magic numbers added via Expert Advisors or manually. The Utility closes specific Magic number open positions when a certain profit in currency $ has been reached. The Utility also closes specific Magic numbers open positions with a break-even feature when the Expert Advisors or manually a certain amount of open positions has been placed. The Utility also closes all buy stops and sell stops when the "Take profit sum $" has been reache
This panel is designed for quick visual search for the price action patterns on several instruments simultaneously. It is possible to add and remove instruments. Clicking the signal button allows you to quickly move to the chart with the identified pattern and timeframe. The panel searches for 8 candlestick patterns: PIN-BAR, EXTERNAL BAR, INSIDE BAR, DOJI, LEVEL, HIGH/LOW OF N BAR, FAKEY, ONE-WAY N BAR. Any of the patterns can be disabled by clicking its title. It can also search in history (by
Indicator is able to alert by pop and acoustic alarm the achievement of the average price range of the last periods so as to be able to set our operation. It allows different percentage variables reached and periods of variation according to the parameters entered. Apply your reverse strategies to achieving that threshold so you get higher success rates. Indispensabile per le strategie reverse intraday.
Introducing the OrderManager: A Revolutionary Utility for MT4 Manage your trades like a pro with the all-new Order Manager utility for MetaTrader 4. Designed with simplicity and ease-of-use in mind, the Order Manager allows you to effortlessly define and visualize the risk associated with each trade, enabling you to make informed decisions and optimize your trading strategy.  Key Features: Risk Management: Define the risk of your trades quickly and easily, allowing you to make better deci
MT4 Telegram Management (from now simply “EA”) will be attached on specific MT4 chart user want to manage from remote. Note to developer: if possible, EA will be able to read info from command from user to select automatically the correct pair to work on, even if EA is attached only on one pair. EA should open/close position or manage opened or pending position. The MT4 Telegram Management l (form now simply “panel”) will be a simple Telegram group setted from user. By panel, user should be able
This is a multi-timeframe candle patterns indicator. It scans the chart for Hammer , Engulfing candle , Doji candle and Three white soldiers / black crows setups. FEATURES: Main panel showing timeframe s from M5 - W1, last signal and last signal time of the selected candle pattern. You can switch between the timeframes by clicking on them. A panel with buttons to switch from one candle pattern to another on the main panel. Arrows to help you locate the candle pattern. A scale showing you what c
Hello This EA (expert advisor) will open orders from Telegram "Auto Open orders from Telegram" (Telegram to MT4). Please watch our video for more details: https://www.youtube.com/watch?v=p06o1xgsD5c download instructions from here https://drive.google.com/file/d/1rwZnvgaWoi3gSkEwsi7s5jeatjJLGTWc/view?usp=sharing Good luck -------------------------------------------------------------- السلام عليكم هذا الاكسبيرت سيفتح صفقات آلية وفورية من تليجرام (Telegram إلى MT4) يرجى مشاهدة الفيديو لمزيد من
Manage your deals
Fawwaz Abdulmantaser Salim Albaker
Hi Dear Friends ,   As i told you ,,, today i produce the management EA to managing your trades and with closing instruments used to closing tow kind of trades.. the profitable trades and losable trades .. u can try it for free for 2 days ,, it is worth every cent ..  now .. you do not need to keep tracing your deals.... let the EA do it for you automatically...  for any inquires contact me directly in my contacts shown on my profile after adding me .. best regards  Fawaz A. Al-baker 
This is the linear regression indicator for basic indicators included in the standard package of the MetaTrader 4 terminal. It is used for the analysis of price movements and market mood. The market mood is judged by the slope of the linear regression and price being below or above this line. Regression line breakthrough by the indicator line may serve as a market entry signal. There is possibility of setting the color for bullish and bearish sentiments of the basic indicators as well as plottin
Gann Box MT4
Frederic Jacques Collomb
Gann Box インジケーターは、トレーダーが市場の重要なレベルを特定し、活用するのを支援するために設計された強力で多機能なツールです。このインジケーターを使用すると、チャート上に長方形を描くことができ、それが自動的に 0, 0.25, 0.50, 0.75, 1 の戦略的レベルを持つ複数のゾーンに分割されます。価格がこれらのレベルのいずれかに達すると、アラートがトリガーされ、トレーディングの意思決定に貴重な支援を提供します。描いたゾーンに対する市場の動きを即座に把握できます。ゾーンをトレースするには、単純な長方形を描いて名前を GannBox に変更するだけです。 このインジケーターは、 サポートとレジスタンス の概念を使用するトレーダー、 サプライとデマンド 、 ICTテクニック 、または**公正価値ギャップ(FVG)**の専門家など、すべてのタイプのトレーダー向けに設計されています。 デイトレーダー、スイングトレーダー、またはポジショントレーダーであろうと、 Gann Box は市場の動きをより良く理解し予測する手助けをし、反応性とパフォーマンスを向上させます。 MT5バージョ
Modify SELL orders v1.0    Managing Orders   During trading, you may need to modify   orders, i.e.   to change stop levels or  take profit. This can be done with one click with  the script Modify SELL orders v1.0 The script modifies all orders (market )  with specified Take Profit and Stop Loss.(pip or price) If the take profit or(and) stop loss is incorrect, then the value is not changed. Parameters script : Take Profit (PIP) Stop Loss (PIP) Take Profit (price) Stop Loss (price)
Send periodic (Health Check) notification from your MT4 terminal to your mobile phone to be sure that your MT4 terminal is still running. When you did not receive the notification, it means that your terminal is unavailable. Optional information like Account Equity and Trading Pairs are also available. Notification Period - 1 Hour, 2 Hours, 4 Hours, 8 Hours, 12 Hours, 24 Hours Attach EA to any H1 chart
Trade History Exporter automatically exports trade history to a CSV (comma separated values) file. Trade History Exporter: - automatically exports trade history every time a trade is closed - allows you to manually force an export by using the "W" key on your keyboard - can use Order Comments as Magic Numbers - useful for instance when using a Trade Copier - calculates the Net Profit per trade
APP System Signalsは、金融市場で活動するトレーダー向けに設計された洗練された指標です。この指標は、高度なテクニカル分析に基づいて正確な売買シグナルを提供し、トレーダーが賢明な取引を行うのを可能にします。指標は指数移動平均線(EMA)、単純移動平均線(SMA)、基本的なトレンドの組み合わせを使用して信頼性の高いシグナルを生成します。パラメータは完全にカスタマイズ可能であり、トレーダーは自分の取引戦略に指標を適合させることができます。さらに、この指標は使いやすく、すべての経験レベルのトレーダーにとって不可欠なツールです。初心者であっても経験豊富なトレーダーであっても、APP System Signalsは取引のパフォーマンスを向上させ、市場でより賢明な決定をするのに役立ちます。
MTSBSPanel is a multifunctional trading panel with an integrated risk manager. Main features of the trading panel Placement of pending orders directly from the chart with the ability to divide a position into multiple orders Opening by market in one click with the ability to divide a position into multiple orders Risk management: risk per trade and per day Dynamically calculated lot depending on the specified risk per trade Brief information on the account, result of trades for the day, week,
ブレイクアウト最適化EAとは? 正直に言って、MQL5の多くの製品は、驚くべき利益を約束し、これまでで見た中で最も素晴らしいバックテストを共有しています。しかし、彼らは通常、実際にどのように機能するかを複雑にしすぎたり、単純に説明で嘘をついたりします。 このbotはブレイクアウトEAです。選択した時間範囲で範囲が破られたときに買いまたは売りを行うためです。奇跡のbotではありませんが、常識を働かせれば利益を上げることができ、単独で完全なポートフォリオを管理できます。 2つのライブシグナルのうち、このbotは90%の取引を占めています。SigmasetとSigmaset2です。また、1つのバージョンのこのbotのみを備えたデモアカウントもあります。したがって、BSはありません。実際の生きたチェック可能な結果があります。 ただ、あなたは金持ちになり、ほとんど負けない取引を約束するbotが欲しいだけなら、これは買わないでください。しかし、欺瞞のない、実際の価格変動に基づいて実際に長期的に機能するbotを探しているなら、私たちはビジネスに参入するかもしれません。 このbotはどのような戦略を
Channel indicator based on the principles of mathematical statistics. It uses neural networks to simplify a lot of complex calculations, which makes the indicator fast, even for weak computers. How it works The indicator is based on the moving average, the period of which you can set. The indicator analyzes price deviations from the moving average line for the last 1440 or 2880 bars, and each line indicates a certain probability of a price reverse depending on the selected settings: Standard,
Telegram ChartSnap is an utility tool to bridge your MetaTrader 4 activities to your Telegram chat/group/channel. It will screen shot your MetaTrader 4 chart and send it to your dedicated Telegram chat/group/channel through a Telegram bot. The whole process will keep repeating based on a time cycle that predetermined by the user. It is a convenient tool for those who like to get access to their favorite system/dashboard that only available at MetaTrader Desktop. Beside that, trader can easily
Modify BUY orders_v1.0 Managing Orders   During trading, you may need to modify   orders, i.e.   to change stop levels or  take profit. This can be done with one click with  THE SCRIPT Modify BUY orders v1.0 The script modifies all orders (market )  with specified Take Profit and Stop Loss.(pip or price) If the take profit or(and) stop loss is incorrect, then the value is not changed. Parameters SCRIPT; Take Profit (PIP) Stop Loss (PIP) Take Profit (price) Stop Loss (price)
The Expert Advisor builds a grid of orders, defining inputs by built-in setups. After accumulating the profit specified in the settings, it closes the remaining orders to breakeven. Open “breakout” orders create a grid according to the trend, and each separately “trailing” order allows you to maximize profit from the market. Please see all my products:  https://www.mql5.com/en/users/en_coding/seller Benefits: a unique algorithm for constructing a grid of orders, eliminating the minimum delta b
FREE
EA can help you control your MT4 easilly  First you must create a bot on Telegram and get its TOKEN  link guide :  https://sendpulse.com/knowledge-base/chatbot/create-telegram-chatbot Copy folder Telegram into Data MT4 program (MQL4\Include), link download ( delete space ) :  https: //drive.google.com/file/d/1mCUaTzwvvUkF3JUcLRXnAW1Ls1Mu6xqk/view?usp=sharing You must add the URL “ https://api.telegram.org ” to Tools > Options > Expert Advisors > Allow Web Request for listed URL in order to load
MagicExcel will allow you to extrapolate, from your trades, reports split down by Expert Advisor. The generated reports allow you to quickly compare statistics of trades data from different Expert Advisors, different symbols and also the behavior of an Expert Advisor against different symbols. Additionally, if selected, a report will be created that shows the behavior of the Expert Advisor over time. This is a very useful tool for a trader who works with many Expert Advisors at the same time. R
Risk Controller Expert Advisorは、アカウントのトレーディングアドバイザーの総リスクを管理できるようにするプログラムです。 このプログラムを使用すると、すべてのアドバイザーのアカウントで許可される最大のリスクを制御できます。 たとえば、最大ドローダウンの30%のリスクを設定します。つまり、株式取引ロボットが30%のリスクを超えると、リスクコントローラーはアドバイザーのすべてのポジションを閉じ、開いているすべてのチャートを閉じることもできます。顧問はさらに働くことから。 平均化ロボットをマーチンゲールと交換し、不可抗力やその他の予期しない状況が発生した場合にロボットからの最大損失を制限したい場合は、「安らかな睡眠」のためにエキスパートアドバイザーが必要になります。市場の逆転。 Советник Risk Controller, очень важная и по моему мнению необходимая программа для каждого трейдера который торгует роботами. 制御は、アカウントの最大損失に相当す
このプロダクトを購入した人は以下も購入しています
Gann Made Easy は、ミスター・ギャンの理論を使用した取引の最良の原則に基づいた、プロフェッショナルで使いやすい外国為替取引システムです。 W・D・ガン。このインジケーターは、ストップロスとテイクプロフィットレベルを含む正確な買いと売りのシグナルを提供します。 PUSH通知を利用して外出先でも取引可能です。 購入後はご連絡ください!私の取引のヒントと素晴らしいボーナスインジケーターを無料で共有します! おそらく、ギャンの取引手法についてはすでに何度も聞いたことがあるでしょう。通常、ギャンの理論は初心者のトレーダーだけでなく、すでにある程度の取引経験がある人にとっても非常に複雑なものです。なぜなら、ギャンの取引手法は理論的にはそれほど簡単に適用できるものではないからです。私はその知識を磨き、最良の原則を私の外国為替インジケーターに組み込むために数年を費やしました。 このインジケーターは非常に簡単に適用できます。必要なのは、それをチャートに添付し、簡単な取引推奨事項に従うだけです。このインジケーターは常に市場分析の仕事を行い、取引の機会を探します。適切なエントリーポイントを検出
まず第一に、この取引インジケーターは再描画されず、再描画されず、遅延しないことを強調する価値があります。これにより、手動取引とロボット取引の両方に理想的なものになります。 ユーザーマニュアル:設定、入力、戦略。 アトミックアナリストは、価格の強さとモメンタムを利用して市場でより良いエッジを見つけるためのPA価格アクションインジケーターです。ノイズや誤ったシグナルを除去し、取引ポテンシャルを高めるための高度なフィルターを備えています。複雑なインジケーターの複数のレイヤーを使用して、アトミックアナリストはチャートをスキャンし、複雑な数学的計算をシンプルなシグナルと色に変換します。これにより、どのような初心者トレーダーでも理解して使用し、一貫した取引の決定を行うことができます。 「アトミックアナリスト」は、新規および経験豊富なトレーダー向けにカスタマイズされた包括的な取引ソリューションです。プレミアムインジケーターとトップノッチの機能を1つの取引戦略に組み合わせ、すべてのタイプのトレーダーにとって汎用性のある選択肢にします。 デイリートレーディングとスキャルピング戦略:高
An exclusive indicator that utilizes an innovative algorithm to swiftly and accurately determine the market trend. The indicator automatically calculates opening, closing, and profit levels, providing detailed trading statistics. With these features, you can choose the most appropriate trading instrument for the current market conditions. Additionally, you can easily integrate your own arrow indicators into Scalper Inside Pro to quickly evaluate their statistics and profitability. Scalper Inside
現在20%OFF! 初心者やエキスパートトレーダーのためのベストソリューション! このダッシュボードソフトウェアは、28の通貨ペアで動作しています。それは私達の主要な指標(高度な通貨の強さ28と高度な通貨インパルス)の2に基づいています。それは全体の外国為替市場の大きい概観を与えます。それは、すべての(9)時間枠で28の外国為替ペアのための高度な通貨の強さの値、通貨の動きの速度と信号を示しています。チャート上で1つのインディケータを使用して市場全体を観察し、トレンドやスキャルピングの機会をピンポイントで見つけることができたら、あなたのトレードがどのように改善されるか想像してみてください。 このインディケータには、強い通貨と弱い通貨の識別、潜在的な取引の識別と確認がより簡単になるような機能が搭載されています。このインディケータは、通貨の強さや弱さが増加しているか減少しているか、また、すべての時間枠でどのように機能しているかをグラフィカルに表示します。 新機能として、現在の市場環境の変化に適応するダイナミックなマーケットフィボナッチレベルが追加され、すでに当社のAdvan
Enigmera
Ivan Stefanov
5 (3)
エニグメラ:市場の中核 https://www.enigmera.com はじめに このインディケータと取引システムは、金融市場に対する驚くべきアプローチです。ENIGMERAは、フラクタルサイクルを使用して、サポートとレジスタンスレベルを正確に計算します。本格的な蓄積局面を示し、方向性と目標を示します。 トレンド中でも調整中でも機能するシステムです。 どのように作動するのか? ENIGMERAは、支持線・抵抗線、目標線、乖離線の3つのラインで構成されています。このシステムは、過去のデータを現在と未来に外挿する典型的な市場指標とは異なり、現在の完全な画像を提供します。支持線上にある場合、それは本当の支持を意味し、抵抗線上にある場合、それは本当の抵抗を意味する。ある水準が破られた場合、それはトレンドの変化を意味する。再描画はしない。 市場は常に進化しているため、ENIGMERAはその評価ツールを適応させ、定期的に戦略を修正しています。  これにより、すべてのシナリオが徹底的に評価されることが保証されます。この市場指標の独自性は、その能力を見れば明らかです。  ENIGM
TPSpro TREND PRO は 、市場を自動的に分析し、トレンドとその各変化に関する情報を提供し、再描画せずに取引に参加するためのシグナルを提供するトレンド指標です。 インディケータは各ローソク足を使用し、個別に分析します。さまざまなインパルス(アップまたはダウンインパルス)を指します。通貨、仮想通貨、金属、株、指数の取引への正確なエントリーポイント! バージョンMT5                   インジケーターの完全な説明   インジケーター -   RFI LEVELS と併用することをお勧めします。 主な機能: レンダリングなしで正確な入力信号! シグナルが表示された場合、それは関連性を維持します。これは、シグナルを提供してからそれを変更する可能性があり、入金時の資金の損失につながる可能性があるリドローインジケーターとの重要な違いです。より高い確率と精度で市場に参入できるようになりました。矢印が表示された後、ターゲットに達する (利益確定) か反転シグナルが表示されるまで、ローソク足を色付けする機能もあります。 STOP LOSS / TAKE PROFIT
Dynamic Forex28 Navigator - 次世代の Forex 取引ツール。 現在 49% オフ。 Dynamic Forex28 Navigator は、長年人気のインジケーターを進化させたもので、3 つの機能を 1 つにまとめています。 Advanced Currency Strength28 インジケーター (レビュー 695 件)  + Advanced Currency IMPULSE with ALERT (レビュー 520 件) + CS28 コンボ シグナル (ボーナス)。 インジケーターの詳細 https://www.mql5.com/en/blogs/post/758844 次世代の Strength インジケーターが提供するもの  オリジナルで気に入っていたすべての機能が、新機能と精度の向上によって強化されました。 主な機能: 独自の通貨強度計算式。 すべての時間枠でスムーズかつ正確な強度ライン。 トレンドの特定と正確なエントリーに最適です。 ダイナミックマーケットフィボナッチレベル (マーケットフィボナッチ)。 このインジケー
Trend Punch
Mohamed Hassan
4.95 (19)
This indicator is unstoppable when combined with our other indicator called  Support & Resistance . After purchase, send us a message and you will get it   for  FREE as a BONUS! Introducing Trend Punch , the revolutionary forex trend indicator that will transform the way you trade! Trend Punch is uniquely designed to provide precise buy and sell arrows during strong market trends, making your trading decisions clearer and more confident. Whether you're trading major currency pairs or exotic sym
FX Volume
Daniel Stein
4.58 (33)
mql5と Telegramの モーニング・ブリーフィングで、詳細とスクリーンショットを含む毎日のマーケット・アップデートをご覧 ください! FX Volumeは、ブローカーの視点から市場のセンチメントをリアルに洞察する、最初で唯一の出来高インジケーターです。 ブローカーのような機関投資家が外国為替市場でどのようなポジションをとっているか、COTレポートよりもはるかに速く、素晴らしい洞察を提供します。 この情報をチャート上で直接見ることは、あなたの取引にとって真のゲームチェンジャーであり、画期的なソリューションです。 以下のようなユニークなマーケットデータ洞察から利益を得てください。 比率は 、通貨のロングポジションとショートポジションの比率をパーセントで表示します。 比率の変化は 、選択した期間内のロング比率とその変化率を表示します。 Volumes Totalは 、通貨の取引量(ロングとショート)の合計をロット単位で表示します。 Volumes Long :全通貨のロングポジションの取引量を表示します。 Volumes(ショート )は、全通貨のショートポジションの取引量を表示
指示する     ロシア     -        utilizar con   el indicador の ESP 推奨事項 -   TPSpro トレンド プロフェッショナル版 -   MT5のバージョン 最も重要なことは、将来においても最も重要なことです。 機能のプリンシパル: ゾーンのほとんどは、ベンダーとコンプラドールによってアクティブ化されます。 状況を直感的に把握できるよう、初期の衝動を修正します。 LOGIC AI: MUESTRA zonas (círculos) parabuscar puntos de entrada cuando se activa una plantilla 視覚的に優れた視覚効果があり、最も重要な機能がすべて揃っていることに注意してください。 優れたニベレス/ゾーンの視覚化 (modo MTF) 世界で最も人気のある場所/ゾーンです。これを使用するのに最適な方法です (   TPSproTREND PRO   )。 アルゴリズム プロフェッショナル セパラド パソ ア パソ パラ オペラ それは、オペラハウスやコントラ・デ・エラの指導におい
mql5と Telegramの モーニング・ブリーフィングで、詳細とスクリーンショットを含む毎日のマーケット・アップデートをご覧 ください! FX Power MT4 NGは 、長年の人気を誇る通貨強度計FX Powerの次世代モデルです。 この次世代ストレングスメーターは何を提供するのでしょうか?初代FXパワーの魅力すべて プラス GOLD/XAUの強さ分析 より正確な計算結果 個別に設定可能な分析期間 カスタマイズ可能な計算上限値により、さらに優れたパフォーマンスを実現 もっと見たい人のための特別なマルチインスタンス設定 すべてのチャートでお好みの色を無限に設定可能 数え切れないほどの通知オプションにより、重要なことを見逃すことはありません。 Windows 11とmacOSのスタイルで角を丸くした新しいデザイン 魔法のように動くインジケーターパネル FXパワーの主な機能 すべての主要通貨の強さの完全な履歴 すべての時間枠における通貨の強さの履歴 すべてのブローカーとチャートで同一の計算結果 100%信頼できるリアルタイム計算 -> リペイントなし ドロップダウン・リストから
まず第一に、この取引ツールはノンリペイント、ノンリドロー、ノンラグの指標であり、プロの取引に理想的ですことを強調する価値があります。 オンラインコース、ユーザーマニュアル、デモ。 スマートプライスアクションコンセプトインジケーターは、新米から経験豊富なトレーダーまで、非常 に強力なツールです。Inner Circle Trader AnalysisやSmart Money Concepts Trading Strategiesなど、20以上の有用な指標を1つに組み合わせています。このインジケーターはスマートマネーコンセプトに焦点を当て、大手機関の取引方法を提供し、彼らの動きを予測するのに役立ちます。 特に、流動性分析に優れており、機関がどのように取引しているかを理解しやすくしています。市場のトレンドを予測し、価格の動きを慎重に分析するのに優れています。機関の戦略とトレードを合わせることで、市場の動向についてより正確な予測ができます。このインジケーターは多目的であり、市場構造を分析し、重要な注文ブロックを特定し、さまざまなパターンを認識するのに優れています。 このインジケー
MetaTrader 4用Ultimate Gold Advisor Ultimate Gold Advisorは、MetaTrader 4での取引体験を最適化するために設計された高度な技術ツールです。経験豊富なトレーダーのニーズに応えるために設計されており、このインジケーターは、精度、高度な分析、および多様な機能を組み合わせ、情報に基づいた取引決定をサポートします。金取引に最適ですが、さまざまな資産にも適用可能であり、Ultimate Gold Advisorは市場戦略の改善に役立ちます。 Ultimate Gold Advisorがトレーダーにとって優れたツールである理由は? 高度なパフォーマンス: 各取引の結果をグラフ上で明確に表示する複数のインジケーターを組み合わせることで、あなたの戦略のパフォーマンスを透明に把握できます。これにより、アプローチを改善し、より情報に基づいた意思決定が可能になります。 即時で視覚的な取引シグナル: グラフ上の赤と青の矢印が、買いと売りの可能性を示します。これらの視覚的なシグナルは理解しやすく、行動すべき重要な瞬間をすばやく特定するのに役立ちます
Legacy of Gann
Pavel Zamoshnikov
4.83 (12)
The indicator very accurately determines the levels of the possible end of the trend and profit fixing. The method of determining levels is based on the ideas of W.D.Gann, using an algorithm developed by his follower Kirill Borovsky. Extremely high reliability of reaching levels (according to K. Borovsky  - 80-90%) Indispensable for any trading strategy – every trader needs to determine the exit point from the market! Precisely determines targets on any timeframes and any instruments (forex, met
Gold Channel is a volatility-based indicator, developed with a specific timing algorithm for the XAUUSD pair, which consists of finding possible corrections in the market. This indicator shows two outer lines, an inner line (retracement line) and an arrow sign, where the theory of the channel is to help identify overbought and oversold conditions in the market. The market price will generally fall between the boundaries of the channel. If prices touch or move outside the channel it is a tra
通貨強さウィザードは、取引を成功させるためのオールインワン ソリューションを提供する非常に強力な指標です。このインジケーターは、複数の時間枠のすべての通貨のデータを使用して、このまたはその外国為替ペアのパワーを計算します。このデータは、使いやすい通貨インデックスと通貨パワーラインの形式で表され、特定の通貨のパワーを確認するために使用できます。 必要なのは、取引したいチャートにインジケーターを接続することだけです。インジケーターは、取引する通貨の実際の強さを示します。このインジケーターは、トレンドに合わせて取引するときに有利に利用できる売買高の圧力の極値も示します。このインジケーターには、フィボナッチに基づく可能なターゲットも表示されます。 このインジケーターは、PUSH 通知を含むあらゆるタイプのアラートを提供します。 購入後ご連絡下さい。私の取引のヒントをあなたと共有し、素晴らしいボーナスインジケーターを無料で提供します! 幸せで有益な取引をお祈りします。
このインディケータは、当社の2つの製品 Advanced Currency IMPULSE with ALERT  +   Currency Strength Exotics . のスーパーコンビネーションです。 このインジケーターは全ての時間枠で作動し、8つの主要通貨と1つのシンボルの強弱のインパルスをグラフで表示します。 このインジケータは、金、エキゾチックペア、商品、インデックス、先物など、あらゆるシンボルの通貨強度の加速度を表示することに特化されています。金、銀、原油、DAX、US30、MXN、TRY、CNHなどの通貨強度の加速度(インパルスまたは速度)を表示するために、任意のシンボルを9行目に追加できる、この種の最初のものです。 新しいアルゴリズムに基づいて構築され、潜在的な取引の特定と確認がさらに容易になりました。これは、通貨の強さや弱さが加速しているかどうかをグラフィカルに表示し、その加速の速度を測定するためです。加速すると物事は明らかに速く進みますが、これはFX市場でも同じです。つまり、反対方向に加速している通貨をペアリングすれば、潜在的に利益を生む取
Scalper Vault は、スキャルピングを成功させるために必要なすべてを提供するプロフェッショナルなスキャルピング システムです。このインジケーターは、外国為替およびバイナリー オプションのトレーダーが使用できる完全な取引システムです。推奨される時間枠は M5 です。 システムは、トレンドの方向に正確な矢印シグナルを提供します。また、トップとボトムのシグナルとギャン マーケット レベルも提供します。 インジケーターは、プッシュ通知を含むすべてのタイプのアラートを提供します。 インジケータの購入後にご連絡ください。私の個人的な取引の推奨事項と素晴らしいボーナス指標を無料で共有します! 幸せで有益な取引をお祈りします!
Matrix Arrow Indicator MT4
Juvenille Emperor Limited
5 (3)
マトリックスアローインジケーターMT4は、すべてのシンボル/商品(外国為替、商品、暗号通貨、インデックス、株式)で使用できる100%再描画されていないマルチタイムフレームインジケーターに続くユニークな10in1トレンドです。マトリックスアローインジケーターMT4は、初期段階で現在のトレンドを判断し、最大10の標準インジケーターから情報とデータを収集します。 平均方向移動指数(ADX) 商品チャネルインデックス(CCI) クラシック平研アシキャンドル 移動平均 移動平均収束発散(MACD) 相対活力指数(RVI) 相対力指数(RSI) 放物線SAR ストキャスティクス ウィリアムズのパーセント範囲 すべてのインジケーターが有効な買いまたは売りシグナルを与えると、対応する矢印がチャートに印刷され、次のろうそく/バーの開始時に強い上昇トレンド/下降トレンドを示します。ユーザーは、使用するインジケーターを選択し、各インジケーターのパラメーターを個別に調整できます。マトリックスアローインジケーターMT4は選択されたインディケーターからのみ情報を収集し、それらのデータのみに基づいてアローを印
現在31%オフ! 初心者やエキスパートトレーダーに最適なソリューション! このインジケータは、独自の機能と秘密の数式を組み込んだ、ユニークで高品質かつ手頃な価格のトレーディングツールです。たった1枚のチャートで28の通貨ペアのアラートを表示します。新しいトレンドやスキャルピングチャンスの引き金となるポイントを正確に把握することができるので、あなたのトレードがどのように改善されるか想像してみてください! 新しい基本的なアルゴリズムに基づいて構築されているため、潜在的な取引の特定と確認がより簡単になります。これは、通貨の強さや弱さが加速しているかどうかをグラフィカルに表示し、その加速のスピードを測定するためです。加速すると物事は明らかに速く進みますが、これはFX市場でも同じです。つまり、反対方向に加速している通貨をペアにすれば、利益を生む可能性のある取引を特定することができるのです。 通貨の勢いを示す縦の線と矢印は、あなたの取引の指針となるでしょう。 ダイナミックマーケットフィボナッチ23レベルはアラートトリガーとして使用され、市場の動きに適応します。もしインパルスが黄色
購入後にコメントを残すと、高品質なインジケーター4つをボーナスとして受け取れます。 Chart Patterns All-in-One インジケーターは、トレーダーがテクニカル分析で一般的に使用されるさまざまなチャートパターンを視覚化するのに役立ちます。このインジケーターは市場の潜在的な動きを特定するのに役立ちますが、収益性を保証するものではありません。購入前にデモモードでテストすることをお勧めします。 現在のオファー : 「Chart Patterns All in One」インジケーターが50%割引。 含まれるパターン : 1-2-3 パターン : 3つの主要なポイント(高値または安値)を使用して市場の反転を検出します。 買い : 2つの連続する安値の後に、前の高値よりも低い高値が出現。 売り : 2つの連続する高値の後に、前の安値よりも高い安値が出現。 可視化 : 特定されたポイントを線と矢印で接続。 ダブルトップとダブルボトム : 価格がほぼ同じ2つの連続した高値(ダブルトップ)または安値(ダブルボトム)を形成したときに、反転の可能性を示します。 ダブルトップ : ベアリッシュ
Was: $299  Now: $99   Supply Demand uses previous price action to identify potential imbalances between buyers and sellers. The key is to identify the better odds zones, not just the untouched ones. Blahtech Supply Demand indicator delivers functionality previously unavailable on any trading platform. This 4-in-1 indicator not only highlights the higher probability zones using a multi-criteria strength engine, but also combines it with multi-timeframe trend analysis, previously confirmed swings
AW Prime Oscillator
AW Trading Software Limited
5 (1)
2つのオシレーターを組み合わせたもの。 1 つ目はエントリーポイントを表示し、2 つ目は現在のトレンドを表示します。このインジケーターは、すべての高速オシレーター信号または現在のトレンドの方向のみの信号の 2 つのモードで、オシレーター信号を矢印で表示できます。マルチタイムフレームパネルと 3 種類のシグナル通知があります。 利点: デイトレードやスキャルピング取引に適しています トレンドフィルタリング シンプルかつ高感度なセットアップ マルチタイムフレームパネル アドバイザーへの統合に適しています。 あらゆるシンボルとあらゆるタイムフレームに対応 3種類の通知 MT5 version ->  HERE  / Problem solving ->  HERE 指標戦略 このインジケーターは 2 つの異なるオシレーターで構成されます。 遅いトレンド ライン (太い) - インジケーターの高レベルが上から下に交差する場合、それは下降トレンドのインジケーターであり、下側の水平レベル (インジケーターの低レベル) が下から上に交差する場合、それは下降トレンドのインジケーターです。上昇傾向。さ
カスタムMT4インジケーターで外国為替取引を成功させるための秘密を発見してください! 外国為替市場で成功を達成し、リスクを最小限に抑えながら一貫して利益を得る方法を疑問に思ったことはありますか? これがあなたが探している答えです! 取引へのアプローチに革命をもたらす独自のMT4インジケーターを導入できるようにします。 ユニークな汎用性 私たちのインジケータは、RenkoとRangeBarのろうそくのフォーメーションを好むユーザー向けに特別に設計されています。 これらのチャートタイプは多くの経験豊富なトレーダーに好まれていることを理解しています。そのため、私たちのインジケーターはそれらとシームレスに統合され、比類のない市場分析を提供します。 クリアトレンドシグナル 複雑な分析を忘れてください! 私たちのインジケーターは、鮮やかな色と明確なドット構造を利用して、市場の動向を明確に示しています。 赤と青の点は、価格の動きの方向性について疑いの余地がなく、取引の迅速な意思決定を可能にします。 HH/HL HL/LL戦略とのアライメント HH/HLおよびHL/LL構
現在26%オフ 初心者やエキスパートトレーダーに最適なソリューション! このインジケーターは、独自の機能と新しい計算式を取り入れた、ユニークで高品質、かつ手頃な価格のトレーディングツールです。たった1枚のチャートで28の為替ペアの通貨強度を読み取ることができます。新しいトレンドやスキャルピングチャンスの引き金となるポイントを正確に特定することができるので、あなたのトレードがどのように改善されるか想像してみてください。 ユーザーマニュアルはこちら  https://www.mql5.com/en/blogs/post/697384 これが最初の1本、オリジナルだ! 価値のないクローンを買わないでください。 特別な サブウィンドウの矢印で強い通貨の勢いを表示 GAPがあなたのトレードを導く! 基準通貨や気配値が売られすぎ・買われすぎのゾーン(外相フィボナッチレベル)にあるとき、個別チャートのメインウィンドウに警告表示。 通貨がレンジの外側から反落した場合、プルバック/リバーサルのアラート。 クロスパターンの特別なアラート 複数の時間枠を選択可能で、トレンドを素早く
Black dragon indicator
Ramil Minniakhmetov
4.85 (110)
トレンド検出インジケーターはあらゆる戦略を補完し、独立したツールとしても使用できます。 インジケーターの操作に関する推奨事項、コメント #8 でダウンロードできます 利点 使いやすく、不要な情報でチャートを過負荷にしません。 あらゆる戦略のフィルターとして使用できます。 利益を得るのとストップロスを設定するの両方に使用できる動的なサポートとレジスタンスのレベルが組み込まれています。 ローソク足が閉じた後、インジケーターの色は変わりません。  株式市場、指数、石油、金、およびすべての時間枠で機能します。 トースト通知、電子メール通知、プッシュ通知、サウンドアラートの機能があります。 私の他の開発はここで見つけることができます: https://www.mql5.com/ja/users/mechanic/seller 入力パラメータ Alert-オン/オフ。アラート; Push Notification-オン/オフ。プッシュ通知; Mail-オン/オフ電子メール通知; Fibo 1,2,3,4,5,6,7,11,21,31,41,51,61,71-動的サポートと抵抗レベルの
Automated Trendlines
Georgios Kalomoiropoulos
5 (16)
トレンドラインは、外国為替取引におけるテクニカル分析の最も重要なツールです。残念ながら、ほとんどのトレーダーはそれらを正しく描画していません。自動トレンドラインインジケーターは、市場のトレンドの動きを視覚化するのに役立つ本格的なトレーダー向けのプロフェッショナルツールです。 トレンドラインには、強気トレンドラインと弱気トレンドラインの2種類があります。 上昇トレンドでは、外国為替トレンドラインは価格変動の最低スイングポイントを介して描画されます。 少なくとも2つの「最低安値」を接続すると、トレンドラインが作成されます。 下降トレンドでは、トレンドラインは価格変動の最も高いスイングポイントを介して描画されます。 少なくとも2つの「最高値」を接続すると、トレンドラインが作成されます。 トレンドラインが壊れたとき? 弱気のろうそくが強気のトレンドラインの下で閉じ、ろうそくの高さがトレンドラインの上にあるとき、強気のトレンドラインは壊れます。 強気のろうそくが弱気のトレンドラインの上で閉じ、ろうそくの安値がトレンドラインの下にあるとき、弱気のトレ
Best Currency Strength Indicator
Tumelo Patrick Rakotsoane
4.59 (46)
Advanced Currency Strength Indicator The Advanced Divergence Currency Strength Indicator. Not only it breaks down all 28 forex currency pairs and calculates the strength of individual currencies across all timeframes , but, You'll be analyzing the WHOLE forex market in 1 window (In just 1 minute) . This indicator is very powerful because it reveals the true movements of the market.  It is highly recommended to  analyze charts knowing the performance of individual currencies or the countries ec
Allows multiple indicators to be combined into a single indicator, both visually and in terms of an alert. Indicators can include standard indicators, e.g. RSI, CCI, etc., and also Custom Indicators, even those purchased through Market, or where just have the ex4 file. An early alert is provided, say when 4 out 5 indicators have lined up, and a confirmed alert when all are in agreement. A‌lso features a statistics panel reporting the success of the combined indicator by examining the current cha
作者のその他のプロダクト
CoralDash is a simple symbol shortcut dashboard.   The Symbol List has many presets to choose from:  Market Watch Open Orders Current Chart Majors A custom list Clicking the symbol has two available actions Set the current chart symbol Filter the list of symbols shown in the dashboard based on one currency (e.g., see all EUR pairs) Click the "PAIR" cell in the header to toggle between the two available actions Click the symbol cell to apply the action For the filter, click the left side to selec
FREE
CoralPage is a simple little utility to add navigation controls to your chart.  You can now easily step through the symbols in the Market Watch without having to click-and-drag a symbol from the Market Watch onto your chart.  It's a simple but indispensable time-saver! Click move to the first, previous, next or last symbol in the Market Watch.  Shift-click to go the the previous or next symbol that has an open order. CoralPage is completely free.  If you like this, please check out my other prod
FREE
Coral Multi TF Meter allows you to quickly see how price is moving on a single currency pair across multiple timeframes at once.  You can select which timeframes to display; the size, position, colors of cells; whether to display values or not; and how often the meter is updated. The calculation is based on ATR distance for each displayed timeframe.  Hover over the header cell for the row (with the currency name in it) to see the current ATR value (in pips) for that period.  When "Display Values
Coral Heatmap is a currency strength meter based on the ATR values for the selected timeframe.  There are two main view modes: All Currencies (default) - see the ranked strength of all currencies in a single view Selected Currency - see the relative strength of all other currencies compared to a selected currency You can optionally display the timeframe selection toolbar; timeframe is always synchronized to the current chart timeframe.  Use keyboard shortcuts to quickly navigate currencies (up/d
Coral Rate of Change Dashboard  displays "rate of change" calculations across multiple symbols and timeframes simultaneously.  See at a glance which pairs are moving, and how quickly.  Receive alerts when any symbol + timeframe is experiencing very strong movement.  You can display data for currency pairs, or for individual currencies (takes the average for each currency across all available pairs). See the CoralDash product description for the core functionality of the dashboard (symbol exposu
Coral Notify Dash allows you to manage all of your chart price-based notifications from a single consolidated dashboard.  It fills a gap left by MT4, which does not support popup alerts.  If you're like me and you often don't hear the alert sound for the built-in alerts, this is an indispensable tool. I use Coral Notify Dash as part of my daily chart analysis workflow.  I use a tool like Coral Dash (available for free,  here ) or one of the other dashboards to set my trading bias.  As I review t
Coral History displays information about your trading account and a summary of your history for the day, week, month and all time in a convenient, lightweight window. NEW : You can now set daily / weekly / monthly goals.   Coral History can notify you when reaching a goal.  If set the goal will be displayed in the History section row header; and if you've reached the goal the row will be highlighted in green. Account Information Balance Equity Free Margin (amount, percent or drawdown) Marin Leve
Coral Rescue will help save an account with trades in drawdown.  Do you have losing trades that are just too large to deal with?  They reduce your available margin and can be accumulating swap costs, but the loss would be too great to just accept closing the trades.  Just hoping that price will eventually come back is not an effective strategy, you need a disciplined, consistent and preferably automatic way to dig yourself out of the hole. Coral Rescue is not an EA that places trades on its own.
Chart Logic is here!  Chart automation for MT4: put your Ideas into Actions! Chart Logic is an EA for MT4 that lets you automate actions on your charts.  You define "conditions" and 'actions"; when all the conditions are true, then all the actions are triggered.  Conditions can refer to a wide range of observations, about account information, candle data, technical indicators, key levels, price, time, market data, trades and so on.  And actions can send alerts/notifications, open/close/modify t
フィルタ:
レビューなし
レビューに返信
バージョン 1.4 2022.01.21
1.4 Jan 21, 2022

- BUG: pending line not unlocked on chart refresh / restoreState
- BUG: lines were not locked by default; this changed with the save/restore state logic
- BUG: When SL line is unlocked and dragged, LSC STOPLOSS/risk is not updated
- IMPROVEMENT: The "reset" button in the Trade Planner no longer toggles on/off, it always sets to 0.0
- IMPROVEMENT: In the Position Line window show current value as bull/bear color when != 0.0
- IMPROVEMENT: TP/SL lines continue to follow price (when locked) even if the Trade Planner window is collapsed
- IMPROVEMENT: In the Position Line window you can now toggle between Position Price and Position Pips
- IMPROVEMENT: The Pending trade line is now unlocked by default
- IMPROVEMENT: Reset Trade Plan now turns off "Include Trade Plan" in the Position Line view
- IMPROVEMENT: Lot size should respect MIN LOT and MAX LOT
- IMPROVEMENT: Removed the Lot Step parameter, now using the Market's LOT STEP
- IMPROVEMENT: The position line can now be unlocked and moved manually, updating the displayed data
- IMPROVEMENT: Set Pending line 1xADR from last entry (in ADR display mode, Pending trade mode.)
- FEATURE: New option to have Lot Size Calculator's SL set to a multiple of ADR and PipStep to ADR/10 (helpful for instruments with crazy ADR sizes like indices)
- FEATURE: Alternate display of distances in PIPS, PRICE and x ADR; click the target label (PRICE, PIPS or ADR) to toggle
- FEATURE: Show value either as currency value or % of account; click the "Target Value" label in the Position line window to toggle
バージョン 1.3 2022.01.11
New features:
- Save & restore state on a chart update
- Add option to have Position line turned on by default
- Set shortcuts reminders into tooltips

A couple of minor bug fixes.
バージョン 1.2 2022.01.10
- Fixed a bug in the short position line price (was above instead of below price)
- Set the lines to the background
- Unset "Include Trade Plan" on receiving a trade from EnterTradePlan
バージョン 1.1 2022.01.09
Version 1.01 - Fixed a bug with Include Pending Orders in the Position Line tool.