• 概要
  • レビュー
  • コメント

Marcon s Deviation

DESVIO DE MARCON (Desvio Dinâmico de VWAP)

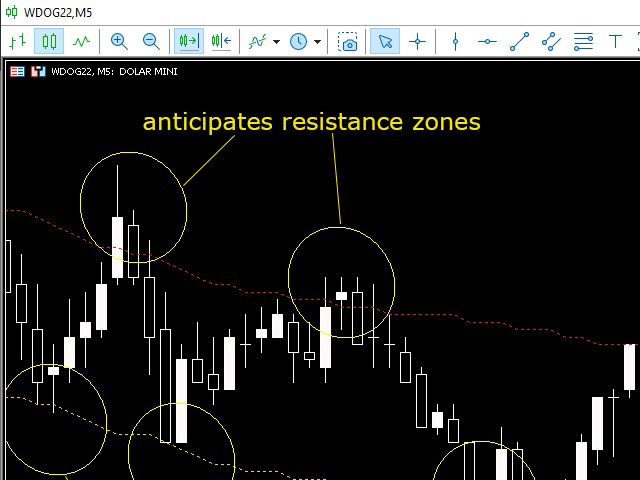
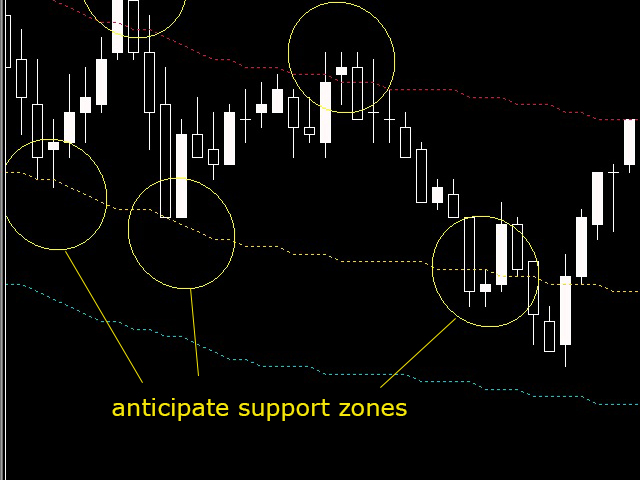
O Desvio de Marcon é um indicador desenvolvido com o intuito de fornecer ao TRADER uma ferramenta capaz de antecipar pontos relevantes de suporte e resistência através de canais de desvios de VWAP traçados no gráfico. 

Mas qual a diferença entre o Desvio de Marcon e os canais de desvio padrão da VWAP já existentes?

O Desvio de Marcon utiliza um algoritmo estatístico desenvolvido por Luiz Antonio de Sousa Marcon, que lhe dá a capacidade de se auto calibrar de acordo com a análise de dados histórico do instrumento selecionado. Logo, o TRADER não precisa se preocupar em frequentemente calibrar e atualizar os desvios do indicador, tudo é feito automaticamente pelo indicador. Tal capacidade permite maior aderência e eficácia do indicador na detecção de pontos importantes dos instrumentos. 

Qual a vantagem em utilizar o Desvio de Marcon?

Alta precisão na detecção dos pontos de suporte e resistência, que possibilita ao TRADER desenvolver estratégias de compra e venda com definição de pontos de stop e gain mais ajustados ás características do ativo. 

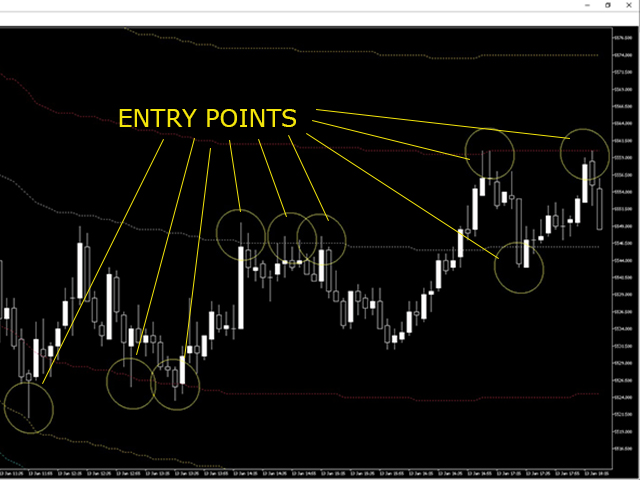
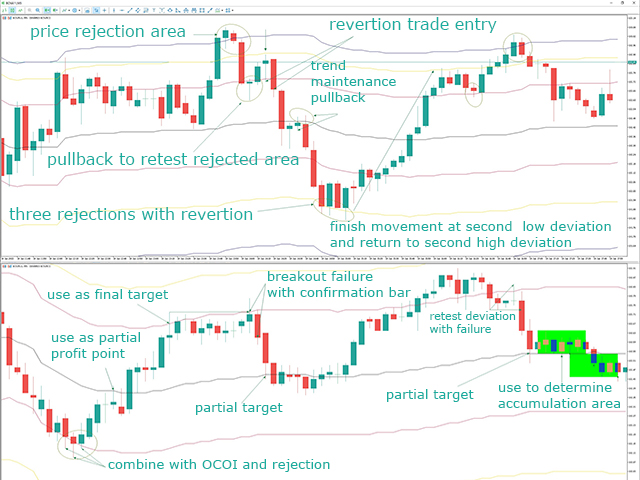
Que resultados o Desvio de Marcon pode fornecer?

Muitos Setups podem ser desenvolvidos utilizando o Desvio de Marcon, mas para que o TRADER possa ter uma base para iniciar seu trabalho com este indicador, vamos disponibilizar alguns SINAIS de negociação para que o TRADER possa ter uma ideia dos resultados que podemos obter com este indicador.

1) Operando Mini Índice IBOVESPA e Mini Dólar/BRL com operações de hedge nos dois ativos utilizando o indicador Desvio de Marcon.


おすすめのプロダクト
Orion Vwap Bands
Joao Paulo Botelho Silva
Fundamentação teórica   A VWAP é uma média móvel ajustada pelo volume, ou seja, o peso de cada preço corresponde ao volume de ações negociadas no período, dando mais importância ao período em que se tenha mais negociações. A Orion Vwap Bands permite que o usuário use plote 8 bandas que podem ser utilizadas como suportes e resistências para o preço. Cada banda é calculada a partir da Vwap Tradicional: Ex.: Se escolhermos o valor 0.25 para a plotagem da Banda 1, pega-se o preço da Vwap e acrescen
BeST_RevEngEMARSI Strategy is an MT5 Indicator that is based on the indicator RevEngEMARSI by Giorgos Siligardos that was presented in his article " Reverse Engineering RSI (II) " ( TASC_Aug 2003 ) as a new variation of his inverse-RSI indicator and which transforms the Exponential moving average of RSI into a curve in the price graph, simplifying the price projection method and improving its visual representation. BeST_RevEngEMARSI Strategy while implementing the crossings with its Moving Aver
WAPV Weis Wave Chart MT5
Eduardo Da Costa Custodio Santos
The Weis Wave Chart for MT5 is a Price and Volume indicator. The Price and Volume reading was widely disseminated through Richard Demille Wyckoff based on the three laws created by him: Supply and Demand, Cause and Effect and Effort vs. Result. In 1900 R.Wyckoff already used the wave chart in his analyses. Many years later, around 1990, David Weis Automated R. Wyckoff's wave chart and today we bring you the evolution of David Weis' wave chart. It shows the amount of Volume and the amount of pips
Gm Vwap Point
Antonio Augusto Barreto De Melo
VWAPは、主にアルゴリズムと機関投資家が、その日の加重平均量に関連して株式が取引されている場所を評価するために使用する日中の計算です。 デイトレーダーは、VWAPを使用して市場の方向性を評価し、取引シグナルを除外します。 この指標は、グラフ上の特定のポイントからVwapを分析および計算するために使用されます。これは、ボリュームとの価格関係の動きの始まりを分析するために広く使用されています。 -同じチャート上の複数のVwaps、自動的に配置されます。 -ティックボリュームとリアルボリュームのサポート。 -Forexで使用できます。 -vwapsを更新する時間。 -選択可能な色; 私が利用できる疑いはありません。
Supply and Demand Monster
Tsog Erdene Borjigon Enkhkhudulmur
Supply and demand zones are at the heart of   supply and demand trading . These zones are areas that show  liquidity at a specific price.  The supply zone is also called the distribution zone, while the demand zone is called the accumulation zone.   Our indicator automatically draw supply and demand zones in Metatrader 5. It give opportunity to understand trading zone and avoiding risk.
A Média Móvel é um indicador que faz parte da Análise Técnica. Com ela, é possível identificar o equilíbrio dos preços no mercado, observando tendências de alta, neutra ou baixa. Este indicador customizado traz opções extras pera definir o método de cálculo podendo-se esclolher entre SMA,EMA,SSMA,LWMA,JJMA,JurX,ParMA,T3,Vidya,AMA,HULL MA. Também conta com varias opções para escolher o método de cálculo para o preço base a ser usado no cáculo da média.
Bolinger Professional Bands, Last indicator of the Safari Pack. in this last indicator we find a unique programming of bolinger bands where you can better catch the rebounds on the bands above and below, works for forex currency markets! synthetic index markets and also crypto! It works in all temporalities and all pairs! Good profit! World Inversor!!!!!
Apenas Abre posições em lado inverso para cada posição aberta e fecha as posições antigas Exceução de Inversão de mão de modo rápido, funciona em Conta Hedge e Netting Para mais detalhes de configurações e input de variáveis entre em nossa comunidade no guilded ( https://www.guilded.gg/i/E9m8bYLE ) Inclui Rompimentos, Canais Estreitos, Canais Amplos e Lateralidades, ou seja para todos os ciclos
FREE
Introducing the PriceStream Channel - a classic channel indicator that allows traders to timely react to price movements beyond the established channel boundaries. This corridor is built based on the analysis of several candles, starting from the last one, which helps identify the extremes of the studied period. These extremes then create the channel lines. Trading within a channel is one of the most popular strategies in forex, and its simplicity makes it suitable even for beginners. The Pri
The SuperTrend MTF indicator is an excellent trend tracking indicator . It can not only display SuperTrend trends within the timeframe of the chart, but also set up to display SuperTrend trends for larger time frames simultaneously . This will be beneficial for grasping trends at a larger time scale and predicting future trends . At the same time, the price of the trend line can also be displayed at a glance, making it easy to observe. Input parameters :  ATR period used at chart timeframe 
The Tik Tok indicator was created on the basis of the original extreme search indicators, the indicator is well suited for determining a reversal or a big sharp jerk in one direction, thanks to it you will know when this happens it will notify you when a blue dot for buying red for sale appears. It basically uses the process of detecting the rate of change in price growth and allows you to find entry and exit points from the market. fundamental technical indicator that allows you to assess th
Unlike any indicator you’ve seen, Trend Volley is an advanced purpose-built trend trading charting system that has been successfully used in nearly every tradable market. It is unique in many ways. Trend Volley’s internal trend detector algorithm studies the market and dynamically chooses the right values for the internal parameters, to adapt to the price and to decrease consecutive trend failures. It can be applied to any financial assets:  forex, cryptocurrencies, metals, stocks, indices.  ITS
Provide ideas for trend trading. Automatic calculation and generation of trend channels. The channel line, also known as the pipeline line, is to draw a straight line parallel to the trend line in the opposite direction of the trend line, and the straight line crosses the highest or lowest price of the recent period. These two lines run the price in the middle and have obvious pipe or channel shapes. Necessary for traders: tools and indicators Waves automatically calculate indicators, chann
True Weis Wave
Atila Goncalves Firmino
A version based on David Waves' description in his book 'Trade About to Happen' of his adaptation of the Wyckoff wave chart. The indicator directionally accumulates volume, adding to each brick or candle close, with color indication for up and down. it can be used it with tick or real volume, it also changes color when the accumulated value of the previous wave is exceeded, being the trade signal. Yellow color is used for doji candlestick, it will continue with accumulation without zero the sum
E2C Lines
Eduardo Cristian De Carvalho
Descubra o poder do nosso indicador de alta precisão, projetado para identificar as regiões de alvo e exaustão de qualquer ativo. Testado e validado por mais de 3 anos nos mercados de mini dólar e mini índice, ele oferece confiabilidade e eficácia incomparáveis. Transforme sua estratégia de trading e alcance novos patamares de sucesso com nossa ferramenta inovadora.
Unlock the power of Fibonacci with our advanced indicator! This tool precisely plots Fibonacci levels based on the previous day's high and low, identifying the next day's key support and resistance levels. Perfect for day trading and swing trading, it has consistently generated weekly profits for me. Elevate your trading strategy and seize profitable opportunities with ease. NOTE: In the Input section make sure the draw labels are set to "True" so you can see each levels.
ZigZag Esmeralda
Ignacio Agustin Mene Franco
ZigZag Emerald The Zig Zag Emerald indicator is based on 4-point patterns The uptrend monotonicity condition begins with appearance of bullish patterns for highs and lows Similar logic applies for the downtrend It is programmed for synthetic indices and forex! It is used in synthetics in volatile pairs and jumps. suitable for all timeframes, both for scalping and intraday.
Highly configurable MFI indicator. Features: Highly customizable alert functions (at levels, crosses, direction changes via email, push, sound, popup) Multi timeframe ability Color customization (at levels, crosses, direction changes) Linear interpolation and histogram mode options Works on strategy tester in multi timeframe mode (at weekend without ticks also) Adjustable Levels Parameters: MFI Timeframe:  You can set the current or a higher timeframes for MFI. MFI Bar Shift:   you can set th
FREE
Fibo + Elliott + CME The Expert Adviso r is designed as an assistant for manual trading. Ready-made trading system based on  Elliott waves   and Fibonacci retracement levels . It is simple and affordable. Display of the marking of Elliott waves (main or alternative option) on the chart. Construction of horizontal levels, support and resistance lines, a channel. Superposition of Fibonacci levels on waves 1, 3, 5, A Display data from CME (CME - Chicago Mercantile Exchange Chicago Mercantile Exch
Magnified Price   Experience trading like never before with our Magnified Price indicator by BokaroTraderFx, designed exclusively for MetaTrader 5. This revolutionary tool provides traders with instant insights into price movements, offering a clear advantage in today's fast-paced markets. Key Features: 1. Real-time Precision: Instantly magnify price action to uncover hidden trends and patterns.  2. Enhanced Visibility: Clear visualization of price movements with adjustable zoom levels. 3. Us
Magnetic levels for MT5 is a great addition to your trading strategy if you use support and resistance levels, supply and demand zones. The price very often gives good entry points to the position exactly at the round levels and near them. The indicator is fully customizable and easy to use: -Choose the number of levels to be displayed -Choose the distance Between The levels -Choose the color of the levels. Can be added to your trading system for more confluence. Works very well when combin
Introducing the "Bull vs Bear Price Strength Oscillator" Indicator: Your Key to Smart Trading Decisions! Are you looking for a trading tool that can provide you with a clear and visual representation of price trend strength? Look no further! The Price Strength Indicator is here to transform the way you analyze the markets and make trading decisions. Uncover Hidden Market Strength: The Price Strength Indicator is designed to help you assess the market's momentum with ease. It does this by evaluat
SMC Unmitigated Finding is a indicator for find unmitigated supply and demand in previous legs of price Settings Zigzag Settings ZZDepth - by Default is 12. ZZDeviation - by Default is 5. ZZBackStep - by Default is 3. Horizontal Line Settings SupportColor-  color for Support line.  ResistanceColor  -  color for Resistance line. Settings Num of Show -  Number of Support & Resistance Show.
The words powerful, unique and game changing are ones that are often over used when applied to trading indicators, but for the MT5 Quantum Camarilla levels indicator, they truly describe this new and exciting indicator completely. Why? Because the indicator has something to offer every trader, from the systematic to the discretionary and from swing trading to breakout trading. And it’s not an indicator which is simply used for entries. The Camarilla indicator delivers in all areas, from gettin
Limitless MT5 is a universal indicator suitable for every beginner and experienced trader. works on all currency pairs, cryptocurrencies, raw stocks Limitless MT5 - already configured and does not require additional configuration And now the main thing Why Limitless MT5? 1 complete lack of redrawing 2 two years of testing by the best specialists in trading 3 the accuracy of correct signals exceeds 80% 4 performed well in trading during news releases Trading rules 1 buy signa
The VIX Fix is a volatility indicator developed by renowned trader Larry Williams. It's designed to measure volatility in assets that don't have options or futures, such as individual stocks and forex markets. Essentially, it acts as a synthetic VIX (Volatility Index) for any asset , providing a gauge of market uncertainty. This modified version of William's indicator helps you to find market bottoms and market tops. It comes with 2 styles: Stochastic and histogram style. Please see screenshots
RAD CRITICAL LEVES RAD indicator tracks “Relevant Volume” in real time, identifying accumulation and distribution processes, projecting them in the chart as SUPPORT or RESISTANCE zones. Natural   support   and resistance levels are generated by Volume Accumulation and Distribution processes. As these processes evolve, levels at which the relevant volume in the market place is positioned, become difficult areas to cross upwards or downwards. By using this information, traders can identify very s
トレンドラインは、外国為替取引におけるテクニカル分析の最も重要なツールです。残念ながら、ほとんどのトレーダーはそれらを正しく描画していません。自動トレンドラインインジケーターは、市場のトレンドの動きを視覚化するのに役立つ本格的なトレーダー向けのプロフェッショナルツールです。 トレンドラインには、強気トレンドラインと弱気トレンドラインの2種類があります。 上昇トレンドでは、外国為替トレンドラインは価格変動の最低スイングポイントを介して描画されます。 少なくとも2つの「最低安値」を接続すると、トレンドラインが作成されます。 下降トレンドでは、トレンドラインは価格変動の最も高いスイングポイントを介して描画されます。 少なくとも2つの「最高値」を接続すると、トレンドラインが作成されます。 トレンドラインが壊れたとき? 弱気のろうそくが強気のトレンドラインの下で閉じ、ろうそくの高さがトレンドラインの上にあるとき、強気のトレンドラインは壊れます。 強気のろうそくが弱気のトレンドラインの上で閉じ、ろうそくの安値がトレンドラインの下にあるとき、弱気のトレ
"The Squeeze indicator attempts to identify periods of consolidation in a market. In general the market is either in a period of quiet consolidation or vertical price discovery. By identifying these calm periods, we have a better opportunity of getting into trades with the potential for larger moves. Once a market enters into a "squeeze," we watch the overall market momentum to help forecast the market direction and await a release of market energy." The Modified TTM Squeeze Indicator is a modi
Trend Scanner is a trend indicator that helps to determine the current and forecast market direction using an advanced algorithm. Thanks to flexible alert settings, the indicator will promptly warn you about a trend reversal. The indicator is intuitive and easy to use, and will be an excellent filter in your trending trading strategies. The lines of this indicator are also an excellent dynamic level for stop loss, and is used as one of the types of trailing stop in Trading Panel . To fine-tune t
このプロダクトを購入した人は以下も購入しています
まず第一に、この取引インジケーターは再描画されず、再描画されず、遅延しないことを強調する価値があります。これにより、手動取引とロボット取引の両方に理想的なものになります。 ユーザーマニュアル:設定、入力、戦略。 アトミックアナリストは、価格の強さとモメンタムを利用して市場でより良いエッジを見つけるためのPA価格アクションインジケーターです。ノイズや誤ったシグナルを除去し、取引ポテンシャルを高めるための高度なフィルターを備えています。複雑なインジケーターの複数のレイヤーを使用して、アトミックアナリストはチャートをスキャンし、複雑な数学的計算をシンプルなシグナルと色に変換します。これにより、どのような初心者トレーダーでも理解して使用し、一貫した取引の決定を行うことができます。 「アトミックアナリスト」は、新規および経験豊富なトレーダー向けにカスタマイズされた包括的な取引ソリューションです。プレミアムインジケーターとトップノッチの機能を1つの取引戦略に組み合わせ、すべてのタイプのトレーダーにとって汎用性のある選択肢にします。 デイリートレーディングとスキャルピング戦略:高速で正確な
まず第一に、このトレーディングシステムがノンリペイント、ノンリドロー、ノンラグのインジケーターであることを強調する価値がある。これにより、手動取引とロボット取引の両方に理想的なものになっています。 オンラインコース、マニュアル、プリセットのダウンロード。 「スマートトレンドトレーディングシステム MT5」は、新規および経験豊富なトレーダー向けにカスタマイズされた包括的なトレーディングソリューションです。10以上のプレミアムインジケーターを組み合わせ、7つ以上の堅実なトレーディング戦略を備えており、多様な市場状況に対応する多目的な選択肢となっています。 トレンドフォロー戦略:トレンドを効果的に乗り越えるための正確なエントリーとストップロス管理を提供します。 リバーサル戦略:潜在的なトレンドの反転を特定し、トレーダーがレンジ相場を活用できるようにします。 スキャルピング戦略:高速で正確なデイトレードおよび短期取引のために設計されています。 安定性:すべてのインジケーターはノンリペイント、ノンリドロー、ノンラグであり、信頼性の高いシグナルを保証します。 カスタマイズ:個々の取引の嗜好に合わせ
ご紹介   クォンタム トレンド スナイパー インジケーターは 、トレンド反転を特定して取引する方法を変革する画期的な MQL5 インジケーターです。 13年以上の取引経験を持つ経験豊富なトレーダーのチームによって開発されました。     クォンタムトレンドスナイパーインジケーター   は、非常に高い精度でトレンドの反転を識別する革新的な方法で、あなたのトレーディングの旅を新たな高みに押し上げるように設計されています。 ***Quantum Trend Sniper Indicatorを購入すると、Quantum Breakout Indicatorを無料で入手できます!*** クォンタム ブレイクアウト インジケーターは、トレンドの反転を特定するとアラートを発し、矢印を示し、3 つのテイクプロフィットレベルを提案します。 初心者トレーダーにもプロのトレーダーにも適しています。 量子EAチャネル:       ここをクリック MT4のバージョン:       ここをクリック 推奨事項: 期間:すべての時間枠。最良の結果を得るには、M
The AT Forex Indicator MT5 is a sophisticated trading tool designed to provide traders with a comprehensive analysis of multiple currency pairs. This powerful indicator simplifies the complex nature of the forex market, making it accessible for both novice and experienced traders. AT Forex Indicator uses advanced algorithms to detect trends, patterns and is an essential tool for traders aiming to enhance their forex trading performance. With its robust features, ease of use, and reliable signal
これはMT5のインジケーターで、再描画なしで取引に参入するための正確なシグナルを提供します。 外国為替、暗号通貨、金属、株式、インデックスなど、あらゆる金融資産に適用できます。かなり正確な見積もりを提供し、取引を開始して終了するのに最適な時期を教えてくれます。1つのシグナルを処理しただけでインジケーターの元が取れた例の 動画 (6:22)をご覧ください。Entry PointsPro インジケーターの助けを借りたほとんどのトレーダーの最初の1週間の結果が改善しています。 Telegramグループ に登録してください。Entry Points Proインジケーターのメリットは次の通りです。 再描画のないエントリーシグナル 再描画されるインジケーターでは一度表示されたシグナルが削除されて大きな金銭的損失につながることがありますが、これと異なり、表示されて確認されたシグナルは消えることがありません。 エラーなしの取引開始 インジケーターアルゴリズムによって取引を開始する(資産を売買する)理想的な瞬間を見つけることができます。それを使用するすべてのトレーダーの成功率が向上します。
Reversal First Impulse levels (RFI)      INSTRUCTIONS        RUS       -       ENG              R ecommended to use with an indicator   -   TPSpro  TREND PRO -  Version MT4                 A key element in trading is zones or levels from which decisions to buy or sell a trading instrument are made. Despite attempts by major players to conceal their presence in the market, they inevitably leave traces. Our task was to learn how to identify these traces and interpret them correctly. Main functi
TPA True Price Action indicator reveals the true price action of the market makers through 100% non-repainting signals strictly at the close of a candle! TPA shows entries and re-entries, every time the bulls are definitely stronger than the bears and vice versa. Not to confuse with red/green candles. The shift of power gets confirmed at the earliest stage and is ONE exit strategy of several. There are available now two free parts of the TPA User Guide for our customers. The first "The Basics"
mql5と Telegramの モーニング・ブリーフィングで、詳細とスクリーンショットを含む毎日のマーケット・アップデートをご覧 ください! FX Power MT5 NGは 、長年の人気を誇る通貨強度計FX Powerの次世代モデルです。 この次世代ストレングスメーターは何を提供するのでしょうか?初代FXパワーの魅力すべて プラス GOLD/XAUの強さ分析 より正確な計算結果 個別に設定可能な分析期間 カスタマイズ可能な計算上限値により、さらに優れたパフォーマンスを実現 もっと見たい人のための特別なマルチインスタンス設定 すべてのチャートでお好みの色を無限に設定可能 数え切れないほどの通知オプションにより、重要なことを見逃すことはありません。 Windows 11とmacOSのスタイルで角を丸くした新しいデザイン 魔法のように動くインジケーターパネル FXパワーの主な機能 すべての主要通貨の強さの完全な履歴 すべての時間枠における通貨の強さの履歴 すべてのブローカーとチャートで同一の計算結果 100%信頼できるリアルタイム計算 -> リペイントなし ドロップダウン・リストから
TPSpro TRENDPRO  - is a trend indicator that automatically analyzes the market and provides information about the trend and each of its changes, as well as giving signals for entering trades without redrawing! The indicator uses each candle, analyzing them separately. referring to different impulses - up or down impulse. Exact entry points into transactions for currencies, crypto, metals, stocks, indices!  -  Version MT4               DETAILED DESCRIPTION               R ecommended to use with
ICT, SMC, SMART MONEY CONCEPTS, SMART MONEY, Smart Money Concept, Support and Resistance, Trend Analysis, Price Action, Market Structure, Order Blocks, BOS/CHoCH,   Breaker Blocks ,  Momentum Shift,   Supply&Demand Zone/Order Blocks , Strong Imbalance,   HH/LL/HL/LH,    Fair Value Gap, FVG,  Premium  &   Discount   Zones, Fibonacci Retracement, OTE, Buy Side Liquidity, Sell Side Liquidity, BSL/SSL Taken, Equal Highs & Lows, MTF Dashboard, Multiple Time Frame, BigBar, HTF OB, HTF Market Structure
FX Volume MT5
Daniel Stein
4.94 (17)
mql5と Telegramの モーニング・ブリーフィングで、詳細とスクリーンショットを含む毎日のマーケット・アップデートをご覧 ください! FX Volumeは、ブローカーの視点から市場のセンチメントをリアルに洞察する、最初で唯一の出来高インジケーターです。 ブローカーのような機関投資家が外国為替市場でどのようなポジションをとっているか、COTレポートよりもはるかに速く、素晴らしい洞察を提供します。 この情報をチャート上で直接見ることは、あなたの取引にとって真のゲームチェンジャーであり、画期的なソリューションです。 以下のようなユニークなマーケットデータ洞察から利益を得てください。 比率は 、通貨のロングポジションとショートポジションの比率をパーセントで表示します。 比率の変化は 、選択した期間内のロング比率とその変化率を表示します。 Volumes Totalは 、通貨の取引量(ロングとショート)の合計をロット単位で表示します。 Volumes Long :全通貨のロングポジションの取引量を表示します。 Volumes(ショート )は、全通貨のショートポジションの取引量を表示
Matrix Arrow Indicator MT5
Juvenille Emperor Limited
5 (14)
マトリックスアローインジケーターMT5は、すべてのシンボル/商品(外国為替、商品、暗号通貨、インデックス、株式)で使用できる100%再描画されていないマルチタイムフレームインジケーターに続くユニークな10in1トレンドです。マトリックスアローインジケーターMT5は、初期段階で現在のトレンドを判断し、最大10の標準インジケーターから情報とデータを収集します。 平均方向移動指数(ADX) 商品チャネルインデックス(CCI) クラシック平研アシキャンドル 移動平均 移動平均収束発散(MACD) 相対活力指数(RVI) 相対力指数(RSI) 放物線SAR ストキャスティクス ウィリアムズのパーセント範囲 すべてのインジケーターが有効な買いまたは売りシグナルを与えると、対応する矢印がチャートに印刷され、次のろうそく/バーの開始時に強い上昇トレンド/下降トレンドを示します。ユーザーは、使用するインジケーターを選択し、各インジケーターのパラメーターを個別に調整できます。マトリックスアローインジケーターMT5は選択されたインディケーターからのみ情報を収集し、それらのデータのみに基づいてアローを印
Step into the realm of Forex trading with confidence and precision using XQ, a cutting-edge Forex indicator designed to elevate your trading game to unprecedented heights. Whether you're a seasoned trader or just stepping into the world of currency exchange, XQ Forex Indicator empowers you with the insights and signals needed to make informed trading decisions. The signal conditions are a combination of three indicators, and XQ Forex Indicator only display  medium and long-term trends . The ind
Was: $249  Now: $99   Market Profile defines a number of day types that can help the trader to determine market behaviour. A key feature is the Value Area, representing the range of price action where 70% of trading took place. Understanding the Value Area can give traders valuable insight into market direction and establish the higher odds trade. It is an excellent addition to any system you may be using. Inspired by Jim Dalton’s book “Mind Over Markets”, this indicator is designed to suit the
今、147ドル(いくつかの更新後に499ドルに増加します) - 無制限のアカウント(PCSまたはMac) RelicusRoad ユーザー マニュアル + トレーニング ビデオ + プライベート Discord グループへのアクセス + VIP ステータス 市場の新しい見方 RelicusRoad は、外国為替、先物、暗号通貨、株式、および指数の世界で最も強力な取引インジケーターであり、トレーダーに収益を維持するために必要なすべての情報とツールを提供します。初心者から上級者まで、すべてのトレーダーが成功するためのテクニカル分析と取引計画を提供します。これは、将来の市場を予測するのに十分な情報を提供する重要な取引指標です。意味をなさないチャート上のいくつかの異なる指標ではなく、完全な解決策を信じています.これは、信号、矢印 + 価格アクション情報を表示するオールインワンのインジケーターで、他に類を見ない非常に正確です。 強力な AI に基づいて、RelicusRoad は不足している情報とツールを提供して、あなたを教育し、トレーディングのプロ、成功したトレーダーにします。
現在33%オフ 初心者にもエキスパートトレーダーにも最適なソリューション このインジケーターは独自の機能と新しい公式を多数内蔵しており、ユニークで高品質かつ手頃な取引ツールです。このアップデートでは、2つの時間枠ゾーンを表示できるようになります。より長いTFだけでなく、チャートTFとより長いTF(ネストゾーンを表示)の両方を表示できます。すべてのSupply Demandトレーダーの皆さんのお気に召すはずです。:) 重要情報の公開 Advanced Supply Demandの可能性を最大化するには、 https://www.mql5.com/ja/blogs/post/720245 にアクセスしてください。   エントリーまたはターゲットの正確なトリガーポイントを正確に特定できれば取引がどのように改善されるか想像してみてください。新しい基盤となるアルゴリズムに基づいて構築されているため、買い手と売り手の間の潜在的な不均衡をさらに簡単に特定できます。これは、最も強い需要と供給のゾーンと、過去のパフォーマンス(古いゾーンを表示)がグラフィカルに表現されるためです。これらの機能は、最適
Was: $299  Now: $99   Supply Demand uses previous price action to identify potential imbalances between buyers and sellers. The key is to identify the better odds zones, not just the untouched ones. Blahtech Supply Demand indicator delivers functionality previously unavailable on any trading platform. This 4-in-1 indicator not only highlights the higher probability zones using a multi-criteria strength engine, but also combines it with multi-timeframe trend analysis, previously confirmed swings
Bill Williams Advanced is designed for automatic chart analysis using Bill Williams' "Profitunity" system. The indicator analyzes four timeframes at once. Manual (Be sure to read before purchasing) Advantages 1. Automatically analyzes the chart using the "Profitunity" system of Bill Williams. The found signals are placed in a table in the corner of the screen. 2. Equipped with a trend filter based on the Alligator indicator. Most of the system signals are recommended to be used only accordi
このダッシュボードは、選択されたシンボルの最新の利用可能なハーモニックパターンを表示するので、時間を節約し、より効率的に /   MT4バージョン 。 無料インジケーター:   Basic Harmonic Pattern インジケーター列 Symbol : 選択したシンボルが表示されます。 Trend :   強気または弱気 Pattern : パターンの種類(ガートレー、バタフライ、バット、カニ、サメ、サイファー、ABCD) Entry : エントリー価格 SL: ストップロス価格 TP1: 1回目の利食い価格 TP2: 2回目の利食い価格 TP3:   3回目の利食い価格 Current price :   現在値 Age (in bars):    最後に描画されたパターンの年齢 主な入力項目 Symbols:   "28 Major Currency Pairs "または "Selected Symbols "から選択。 Selected Symbols:   カンマで区切られた監視したいシンボル("EURUSD,GBPUSD,XAUUSD")。ブローカーが
ご紹介     Quantum Breakout PRO は 、ブレイクアウト ゾーンの取引方法を変革する画期的な MQL5 インジケーターです。 13年以上の取引経験を持つ経験豊富なトレーダーのチームによって開発されました。     クォンタム ブレイクアウト プロ   は、革新的でダイナミックなブレイクアウト ゾーン戦略により、あなたのトレーディングの旅を新たな高みに押し上げるように設計されています。 クォンタム ブレイクアウト インジケーターは、5 つの利益ターゲット ゾーンを備えたブレイクアウト ゾーン上のシグナル矢印と、ブレイクアウト ボックスに基づいたストップロスの提案を提供します。 初心者トレーダーにもプロのトレーダーにも適しています。 量子EAチャネル:       ここをクリック 重要!購入後、インストールマニュアルを受け取るためにプライベートメッセージを送ってください。 推奨事項: 時間枠: M15 通貨ペア: GBPJPY、EURJPY、USDJPY、NZDUSD、XAUUSD アカウントの種類: ECN、Raw、またはス
The Volumebyprice.com technical indicator for MetaTrader 5 features Volume Profile and Market Profile TPO (Time Price Opportunity). Volume and TPO histogram bar and line charts. Volume Footprint charts. TPO letter and block marker collapsed and split structure charts. Session filtering and grouping. Static, dynamic and flexible range segmentation and compositing methods with relative and absolute visualizations. Graphical layering, positioning and styling options to suit the user's analytic and
Gartley Hunter Multi - An indicator for searching for harmonic patterns simultaneously on dozens of trading instruments and on all possible timeframes. Manual (Be sure to read before purchasing) | Version for MT4 Advantages 1. Patterns: Gartley, Butterfly, Shark, Crab. Bat, Alternate Bat, Deep Crab, Cypher 2. Simultaneous search for patterns on dozens of trading instruments and on all possible timeframes 3. Search for patterns of all possible sizes. From the smallest to the largest 4. A
The indicator very accurately determines the levels of the possible end of the trend and profit fixing. The method of determining levels is based on the ideas of W.D.Gann, using an algorithm developed by his follower Kirill Borovsky. Extremely high reliability of reaching levels (according to K. Borovsky  - 80-90%) Indispensable for any trading strategy – every trader needs to determine the exit point from the market! Precisely determines targets on any timeframes and any instruments (forex, met
MT4版  |  FAQ Owl Smart Levels Indicator は、 Bill Williams の高度なフラクタル、市場の正しい波構造を構築する Valable ZigZag、エントリの正確なレベルをマークする Fibonacci レベルなどの一般的な市場分析ツールを含む 1 つのインジケーター内の完全な取引システムです。 利益を得るために市場と場所に。 戦略の詳細な説明 インジケータを操作するための指示 顧問-取引助手 プライベートユーザーチャット ->購入後に私に書いて、私はプライベートチャットにあなたを追加し、あなたはそこにすべてのボーナスをダウンロードすることができます 力はシンプルさにあります! Owl Smart Levels 取引システムは非常に使いやすいので、専門家にも、市場を勉強し始めて自分で取引戦略を選択し始めたばかりの人にも適しています。 戦略と指標に秘密の数式や計算方法が隠されているわけではなく、すべての戦略指標は公開されています。 Owl Smart Levels を使用すると、取引を開始するためのシグナルをすばやく確認し、注文を出すため
Currently Price  20% OFF  ( for unlimited use ) Indicator   USER MANUAL , trade setups, solving issues, etc :  Direct Download Here     (  for users only  ) Hello World! Introducing.. SMCpro tool and Indicator for  MetaTrader 5 , a cutting-edge feature designed to revolutionize your trading experience. With innovative ICT Smart Money Concept, you gain unparalleled insight into market dynamics, empowering you to make informed trading decisions like never before. SMC Indicator built on th
Insight Pro is a comprehensive tool for market analysis. It offers various features such as trend analysis, resistance and support levels, and distribution analysis, suitable for both novice and experienced traders. Features Trend Analysis Detects and visualizes market trends. Suggests potential entry and exit points based on trends. Customizable trend lines for clear market direction. Displays extreme levels based on standard deviation. Positive slope indicates buy orders; negative slope indic
The Price Action Finder Multi indicator is an indicator of entry points that searches for and displays Price Action system patterns on dozens of trading instruments and on all standard time frames: (m1, m5, m15, m30, H1, H4, D1, Wk, Mn). The indicator places the found patterns in a table at the bottom of the screen. By clicking on the pattern names in the table, you can move to the chart where this pattern is located. Manual (Be sure to read before purchasing) | Version for MT4 Advantages 1. Pa
このダッシュボードは、選択したシンボルの取引戦略に応じて、スキャルピングと長期モードの両方で、チャート上の需給ゾーンを発見し表示します。さらに、ダッシュボードのスキャナーモードは、一目ですべての希望のシンボルをチェックし、適切なポジションを見逃さないようにするのに役立ちます /  バージョンMT4 無料インディケータ:   Basic Supply Demand 特徴 複数の通貨ペアの取引機会を見ることができ、需給ゾーンの近さに応じてランク付けされた全ペアを明確かつ簡潔に表示します。 色から検出パラメータまで、特定のニーズに合わせてカスタマイズ可能な設定 主な入力 Indicator mode : 新機能を備えたインジケーター・モードまたはパネル・モードから選択。 Symbols :   "主要28通貨ペア "または "選択されたシンボル "から選択。 Selected Symbols :   カンマで区切られた監視したいシンボル (「EURUSD,GBPUSD,XAUUSD」)。お使いのブローカーがペアに接尾辞または接頭辞を付けている場合は、次の2つのパラメータ(ペア接頭
WAPV Full MT5
Eduardo Da Costa Custodio Santos
5 (1)
## WAPV Full を使用して専門的に操作し、追跡できるようにする ビッグプレーヤーのお金はどこにありますか 単独で読み取りを行うツールを手に持っていると想像してください 最高の取引地域を示す主要な市場プレーヤーの 価格と出来高の分析に基づいています。 WAPV Full は、R. Wyckoff の運用に 100% 焦点を合わせた完全なツールです。 トレーディング ウェーブにおける市場の動きをマッピングするだけでなく、マッピングも行います。 価格と出来高を読み取ることにより、市場。 プロフェッショナル マーケットは、R.ワイコフの 3 つの法則に基づいて運営されています。 # 原因と結果 # 需要と供給 # 努力×結果 これらはすべて WAPV Full で提供され、16 の基本的なツールが提供されます。 あなたが市場を専門的に分析し、その結果として あなたの結果を改善します。 画像とビデオを見て、私が話していることを理解してください。 ## WAPV furu o shiyō shite senmon-teki ni sōsa shi, tsuiseki dekiru yō
PipFinite Trend PRO MT5
Karlo Wilson Vendiola
4.87 (665)
Breakthrough Solution For Trend Trading And Filtering With All Important Features Built Inside One Tool! Trend PRO's smart algorithm detects the trend, filters out market noise and gives entry signals with exit levels. The new features with enhanced rules for statistical calculation improved the overall performance of this indicator. Important Information Revealed Maximize the potential of Trend Pro, please visit www.mql5.com/en/blogs/post/713938 The Powerful Expert Advisor Version Automa
フィルタ:
レビューなし
レビューに返信