• 概要
  • レビュー
  • コメント

Reincarnations

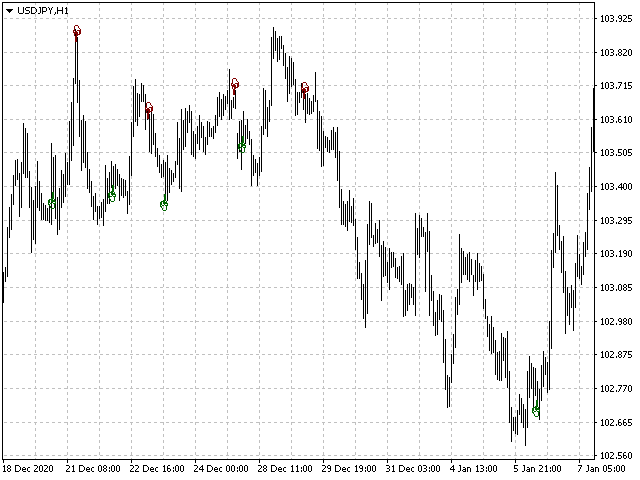
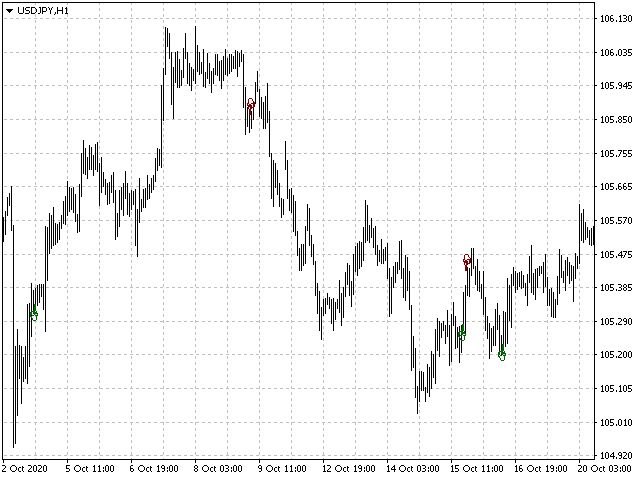
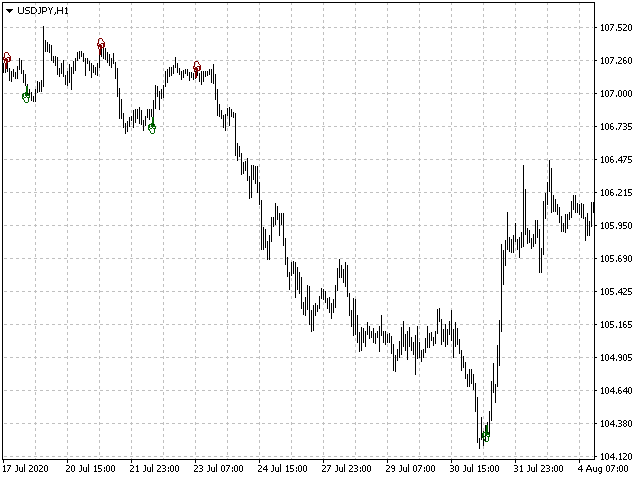
The Reincarnations trend indicator is used to determine the strength and direction of a trend and to find price reversal points. This tool scans the market looking for the correct entry. You can see and evaluate it yourself, perhaps it will suit you for a number of tasks related to forecasting price movements. It uses only price data and analytics to calculate entry points. Does not use auxiliary indicators. It has two parameters for customization.

Indicator setting.
  • Interval - price analysis interval.
  • Subterfuge - analysis correction interval.

The trend can be ascending (bullish trend) and decreasing (bearish trend). In most cases, the trend grows for a long time and falls sharply, but there are exceptions in everything. The price movement can be influenced by economic and political news. A trend is a stable direction of price movement. To find it, the indicator uses calculations designed to smooth out sharp fluctuations that do not affect the overall picture of price movement.

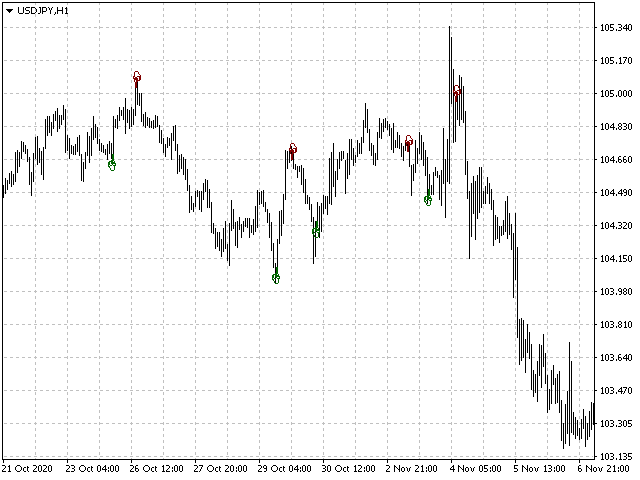
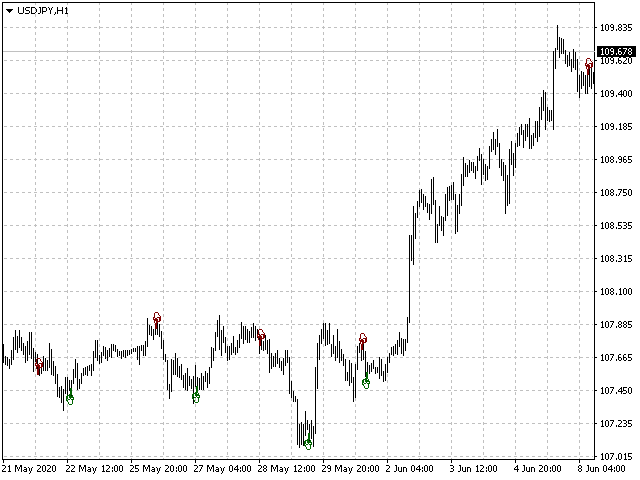
You should use the indicator as an additional one, that is, you need to use this indicator, for example, for the perfect display of price movements! The Reincarnations indicator is used in the forex markets. The indicator was created in order to display the trend in a visual form. One of the main definitions for monitoring the currency market is trend.
おすすめのプロダクト
About
Tatiana Savkevych
About - Forex indicator. This trend indicator is used to determine the current trend in price movement, making it clear in which direction it is better to open a position: buy or sell. The About trend indicator is displayed on the chart and moves in parallel with the price. The Forex About trend indicator allows you to determine in time a change in the direction of price movement, thereby minimizing the likelihood of capital loss. In trading practice, various combinations of About and other ind
The indicator monitors the Dinapoli MACD trend in multiple timeframes for the all markets filtered and shows the results on Dashboard. Key Features Indicator can be used for all markets Monitors every timeframe, from 1 Min to Monthly Parameters UseMarketWatch: Set true to copy all symbols available in market watch MarketWatchCount : Set the number of symbols that you want to copy from the market watch list. CustomSymbols: Enter the custom symbols that you want to be available in dashboard.
StellaX
Rodolfo Leonardo De Morais
This indicator allows to observe the larger time trends and the stochastic channel on the chart Indicator Parameters KPeriod - %K period. This is the number of time periods used in the stochastic calculation; DPeriod - %D calculation period Slowing - Slow K calculation period maPeriod - Averaging period maMethod - Averaging method maPrice -  Averaging Price LineoverBought2 - line over bought 2 LineoverBought1 -   line over bought 1 LineMidle - line midle LineOverSold1 - line over sold 1 LineOv
HeikenashiSmoothing
Rodolfo Leonardo De Morais
Heiken ashi Smoothing in separate window MTF The color of the Heiken-Ashi candles depend on their shadows. The advantage of the Heiken-Ashi chart is that the trend is determined very simply, the upward-facing sails are blue, and the downward-tendency sails are red. For profitable trading it is necessary to use it with the standard candles (make analyzes) and with the other indicators. Indicator Parameters TimeFrame - Graphic time being 0 = Current graph time, 1 = M1, 5 = M5, 15 = M15, 30 = M30
The  Market Sessions Indicator for MT5 helps you  predict market turnarounds  by detecting major supply and demand areas. These pivot points tend to occur after a new session has started and the previous one is still open. It is also used to gauge how many points or pips the market moves on average during a session. This helps us to place better our take profits and stop losses. The indicator works on all forex pairs, gold, silver, commodities, stocks, indices and any other instrument that your
This indicator is created by considering volume divergence with price that is outcome of Bollinger band and Envolpes indicators crossing. It won’t repaint.  It is providing 1 market and three pending orders.  If it is followed with patient, it is providing remarkable profit at the end.  This indicator will be on sale soon on expert advisor. Target is calculated for buy orders as follow 1. 50 pips standard 2. Top Bollinger band 3. Sell Signal Target is calculated for buy orders as follow 1. 50
Indicator for binary options arrow is easy to use and does not require configuration works on all currency pairs, cryptocurrencies buy signal blue up arrow sell signal red down arrow tips do not trade during news and 15-30 minutes before their release, as the market is too volatile and there is a lot of noise it is worth entering trades one or two candles from the current period (recommended for 1 candle) timeframe up to m 15 recommended money management fixed lot or fixed percentage of the depo
The intelligent algorithm of the Trend Detects indicator shows the points of potential market reversal. Strategy for trend trading, filtering market noise and all the necessary functions built into one tool! The system itself shows in the form of arrows when to buy and when to sell. Uses only one parameter for settings. Simple, visual and effective trend detection. Most often, a good trend is visible on the price chart visually. But an experienced trader must clearly understand the current ba
TrendWave Oscillator is an advanced MT4 oscillator that not only identifies the trend direction but also provides visual and audio alerts to enhance trading strategies. Key Features: - Color-coded trend indication:   - Blue : Indicates an uptrend, signaling potential price growth.   - Orange : Indicates a downtrend, suggesting possible price decline.   - Gray : Represents a flat market or lack of clear entry signals. - Graphical signals on the chart :   - Aqua : Highlights an uptrend, empha
This system never paints.   This system created by using Envolpes bands and reverse bar count.   This indicator is only working in M5 period.   This system is for long term and profitable.   Signals are shown as arrows. as an optional limit orders.   You can set a voice alarm or email notification.   You can fins our other products from link : https://www.mql5.com/en/users/drbastem/seller   Also, you can ask all your questins from email : haskayafx@gmail.com or mobile : +90 530 867 5076 or @Meh
This indicator is designed for trend trading and it helps in determining the best entry points. To identify the points, it is necessary to follow the signal line. Once the line crosses the zero level upwards - buy, and when it crosses downwards - sell. In addition to the signal line, the indicator also displays the so-called market "mood" in real time in the form of a histogram. The indicator works on all timeframes and with all instruments. The indicator operation required the Moving Average in
** All Symbols x All Timeframes scan just by pressing scanner button ** ***Contact me after purchase to send you instructions and add you in "RSI scanner group" for sharing or seeing experiences with other users. Introduction RSI divergence is a main technique used to determine trend reversing when it’s time to sell or buy because prices are likely to drop or pick in the charts. The RSI Divergence indicator can help you locate the top and bottom of the market. This indicator finds Regular div
ROC acceleration-deceleration is the manual system for medium-term scalping. Indicator based on custom ROC system which defines bullish/bearish market and especially  acceleration-deceleration of tendention in the market's main direction. Buy arrow is plotted during bearish market when current trend decelerates and sell  arrow is plotted during bullish market when current trend decelerates. Main Indicator's Features Signals are not repaint,non-late or disappear(exept cases when system recalculat
This is  a dashboard indicator that displays the Average Level of each selected currency pairs that filters and gives us a signal for overbought (>=90%) or if price at extreme peak above 90, and/or oversold (<=10%) or if price at extreme peak below 10. The calculation is using Relative Strength Index default periods (2 & 9) applied to three different higher time frames H4,D1,&W1. This won't change or altered even if you change symbol or switch to lower time frames or even in monthly and y
Pinpoint Pro Indicator is a multi-time frames indicator, which uses more than five built-in MT4&MT5 indicator to generate trading signals. This indicator can perform several functions, such as: Send signals notification to mobile phone Gives precise signal entry upon following signal checklist points Can be used in all market such as currency pairs, stock market, metals, commodity, synthetic pairs and cryptocurrency pairs  One built-in indicator can be used for signal verification before enterin
[75% OFF! - SALE ENDS SOON] -  RevCan Trend Entry Point is a trend based trade alert indicator for serious traders. It does all the price and chart analysis all by itself, and whenever it finds any potential high quality trading opportunity(Buy or Sell) using its revolutionized price prediction algorithms, it sends instant trade alert directly on the chart, MT4 terminal and on the mobile device.  The trade signals will be visible on the chart as Up and Down arrows, while the instant audible aler
SuperTrend Alerts adds alerts to the widely popular SuperTrend indicator. As the name suggests, SuperTrend is a trending indicator which works best in trendy (not choppy) markets. SuperTrend is extremely popular for intraday and daily trading, and can be used on any timeframe. Place a call when the price closes above the SuperTrend line, and place a put when the price closes below the SuperTrend line. These crossovers are highlighted by non-repainting up/down arrows. Alerts Email, message and
The indicator shows the potential trend direction by cyclical-wave dependence. Thus, all the rays of the intersection will be optimal rays, in the direction of which the price is expected to move, taking into account the indicator period. Rays can be used as a direction for potential market movement. But we must not forget that the approach must be comprehensive, the indicator signals require additional information to enter the market.
Boba Binary
Anthonius Soruh
5 (1)
Result look on  https://t.me/BonosuProBinary Pair : All Forex Pairs Time Frame : M1 Expaired : 1-2 Minutes Trade Time Once Time a Day Backtester, Alert Avaliable Average Signals Generate 5 - 20 Signals All Pair A Day Broker Time Zone GMT+3 Default Setting [Example Broker GMT+3 : Alpari, FBS, XM] Support Broker : Deriv, IQOption, Alpari, Binomo, Olymtrade, Qoutex, GCoption, etc Support Auto Trading : MT2 Trading, Binary Bot, Intrade Bot, Binomo Bot, Olymptrad Bot, MX2 trading, Price Pro, etc Ind
Cota Binary
Anthonius Soruh
5 (2)
Result look on  https://t.me/BonosuProBinary Pair : All Forex Pairs Time Frame : M1 Expaired : 1-2 Minutes Trade Time Once Time a Day Backtester, Alert Avaliable Average Signals Generate 5 - 20 Signals All Pair A Day Broker Time Zone GMT+3 Default Setting [Example Broker GMT+3 : Alpari, FBS, XM] Support Broker : Deriv, IQOption, Alpari, Binomo, Olymtrade, Qoutex, GCoption, etc Support Auto Trading : MT2 Trading, Binary Bot, Intrade Bot, Binomo Bot, Olymptrad Bot, MX2 trading, Price Pro, etc Ind
**Binary Smart Systemのご紹介:究極のトレードパートナー** Binary Smart Systemは単なるインジケーターではありません。様々な市場で的確なシグナルを提供し、洗練されたアルゴリズムと豊富なテクニカルインジケーターの集合をベースにした、トレーダーを的確さとタイムリーなシグナルで装備するための厳選されたトレードツールです。 **インジケーターコンポーネント:** 1. **移動平均パーセンテージ(MAP):** このコンポーネントは複数の移動平均の加重平均を計算し、トレンドの特定の強力な基盤を形成します。MAPは市場の状況に動的に適応し、現在のトレンド方向に対する洞察を提供します。 2. **商品チャネル指数(CCI):** 平均価格からの偏差を分析することで、CCIは買われすぎと売られすぎの状態を評価します。Binary Smart SystemのCCI統合は、ポテンシャルな反転ポイントを特定する包括的なアプローチを保証します。 3. **移動平均収束拡散法(MACD):** シンプルなクロスオーバーを超えるMACDコンポーネント
Lord Auto Fibonnaci is a free indicator for Meta Trader, in order to show the most famous chart in the financial market known as "Fibonnaci". As we can see in the images below, the fibonnaci table will automatically analyze the graph for you, with trend factors through percentage, almost infallible use, you can always work when the percentage is low or high, start shopping and sales on time, great for analyzing entries! In the images below we can see an example in gold in H4, where we are a
FREE
PLEASE NOTE:   You can  customize the settings of all 3 EMA as per your requirement. The accuracy will change as per your settings. 100% Non repaint Pre-alert (get ready) signals Non-delay indications 24/7 signals 100% No lag No recalculating Lifetime license This is a EMA crossover indicator and its 100% non repaint indicator. The EMA_1 and the EMA_2 is based on which signal is generated. EMA_3 is a Higher EMA value which will remain below or above the candle (market) to identify the trend. M
Alerts you on new trends, with ENTRY and EXIT points. INSTRUCTIONS  Select asset of choice, activate the indicator on the chart and just follow the signals from the arrows. ITS FREE, GIVE ME A GOOD RATING! Platform : Metatrader4 Asset : All Currencies, Gold, BTCUSD, NASDAQ PS : F or newbie and pro traders. Used by more 3,000 traders around the world. Send  a mail for further help and information...........
Supplement for Alpha Trend Spotter (ATS) Indicator: https://www.mql5.com/en/market/product/8590 This indicator acts by price action. Use it when ATS shows clear Bullish or Bearish Trend for finding the strongest trend each day. Suitable for timeframes M5, H1, H4 and D1. Suitable for Binary Option 5 minutes signal. How to Use: RED Arrow means Sell GREEN Arrow means Buy
WPR by Profile, or WPR for Professionals Geo_WprPro is one of the well-known currency profile indicators. It simultaneously displays two WPR indicators with different parameters in the matrix form on all timeframes of multiple currency pairs forming the currency profile . As follows from the description, " WPR is a leading indicator that often goes ahead of the price chart. The oscillator frequently reaches extreme values before the price reversal as if anticipating that event: it almost always
Simple indicator that supports decision makers. You will have the candles directions for different timeframes on your screen. That will allowed you to be one more scenario to analyze before you open your orders. In case you would like to have more details, just let me know.. so we can add it to the chart. Multicurrency that in inform you the directions for multi-timeframes!
Binary Options Support Resistance Indicator This indicator is designed for binary options trading and effectively shows retracements from support and resistance levels. Signals appear on the current candle. A red arrow pointing downwards indicates a potential selling opportunity, while a blue arrow pointing upwards suggests buying opportunities. All that needs adjustment is the color of the signal arrows. It is recommended to use it on the M1-M5 timeframes as signals are frequent on these timef
The 10PIPS Dynamite is a semi-automated  cutting-edge Forex indicator designed to    automatically revolutionize your trading skills from a being a losing trader to becoming a profitable trader simply by Scalping   10 pips per Trade setup generated by the software. 10PIPS Dynamite Indicator once attached on the main chart it starts an in-depth market analysis based on its unique in-built advanced algorithm which seamlessly combines powerful indicators, statistical analysis, and trend recognition
The indicator allows you to trade binary options. The recommended time frame is М1 and the expiration time is 1,2,3 minutes. The indicator suitable for auto and manual trading. A possible signal is specified as a arrows above/under a candle. You should wait until the candle closes! Arrows are not re-painted Trade sessions: TOKYO section (Half-end) Currency pairs: USD/JPY Working time frame: M1 Expiration time: 1,2,3 minutes. The indicator also shows good results when using the martingale strateg
FREE
このプロダクトを購入した人は以下も購入しています
まず第一に、この取引インジケーターは再描画されず、再描画されず、遅延しないことを強調する価値があります。これにより、手動取引とロボット取引の両方に理想的なものになります。 ユーザーマニュアル:設定、入力、戦略。 アトミックアナリストは、価格の強さとモメンタムを利用して市場でより良いエッジを見つけるためのPA価格アクションインジケーターです。ノイズや誤ったシグナルを除去し、取引ポテンシャルを高めるための高度なフィルターを備えています。複雑なインジケーターの複数のレイヤーを使用して、アトミックアナリストはチャートをスキャンし、複雑な数学的計算をシンプルなシグナルと色に変換します。これにより、どのような初心者トレーダーでも理解して使用し、一貫した取引の決定を行うことができます。 「アトミックアナリスト」は、新規および経験豊富なトレーダー向けにカスタマイズされた包括的な取引ソリューションです。プレミアムインジケーターとトップノッチの機能を1つの取引戦略に組み合わせ、すべてのタイプのトレーダーにとって汎用性のある選択肢にします。 デイリートレーディングとスキャルピング戦略:高
最初のパルスレベルを反転 (RFI)     指示する     ロシア     -        utilizar con   el indicador の ESP 推奨事項 -   TPSpro トレンド プロフェッショナル版 -   MT5のバージョン 最も重要なことは、将来においても最も重要なことです。 機能のプリンシパル: ゾーンのほとんどは、ベンダーとコンプラドールによってアクティブ化されます。 状況を直感的に把握できるよう、初期の衝動を修正します。 LOGIC AI: MUESTRA zonas (círculos) parabuscar puntos de entrada cuando se activa una plantilla 視覚的に優れた視覚効果があり、最も重要な機能がすべて揃っていることに注意してください。 優れたニベレス/ゾーンの視覚化 (modo MTF) 世界で最も人気のある場所/ゾーンです。これを使用するのに最適な方法です (   TPSproTREND PRO   )。 アルゴリズム プロフェッショナル セパラド パソ ア パソ パラ オペラ それは
TPSpro TREND PRO は 、市場を自動的に分析し、トレンドとその各変化に関する情報を提供し、再描画せずに取引に参加するためのシグナルを提供するトレンド指標です。 インディケータは各ローソク足を使用し、個別に分析します。さまざまなインパルス(アップまたはダウンインパルス)を指します。通貨、仮想通貨、金属、株、指数の取引への正確なエントリーポイント! バージョンMT5                   インジケーターの完全な説明   インジケーター -   RFI LEVELS と併用することをお勧めします。 主な機能: レンダリングなしで正確な入力信号! シグナルが表示された場合、それは関連性を維持します。これは、シグナルを提供してからそれを変更する可能性があり、入金時の資金の損失につながる可能性があるリドローインジケーターとの重要な違いです。より高い確率と精度で市場に参入できるようになりました。矢印が表示された後、ターゲットに達する (利益確定) か反転シグナルが表示されるまで、ローソク足を色付けする機能もあります。 STOP LOSS / TAKE PROFIT
現在20%OFF! 初心者やエキスパートトレーダーのためのベストソリューション! このダッシュボードソフトウェアは、28の通貨ペアで動作しています。それは私達の主要な指標(高度な通貨の強さ28と高度な通貨インパルス)の2に基づいています。それは全体の外国為替市場の大きい概観を与えます。それは、すべての(9)時間枠で28の外国為替ペアのための高度な通貨の強さの値、通貨の動きの速度と信号を示しています。チャート上で1つのインディケータを使用して市場全体を観察し、トレンドやスキャルピングの機会をピンポイントで見つけることができたら、あなたのトレードがどのように改善されるか想像してみてください。 このインディケータには、強い通貨と弱い通貨の識別、潜在的な取引の識別と確認がより簡単になるような機能が搭載されています。このインディケータは、通貨の強さや弱さが増加しているか減少しているか、また、すべての時間枠でどのように機能しているかをグラフィカルに表示します。 新機能として、現在の市場環境の変化に適応するダイナミックなマーケットフィボナッチレベルが追加され、すでに当社のAdvan
Bomb Bank シグナル: MetaTrader 4 の信頼度インジケーター Bomb Bank Signal は、金融市場で最も関連性の高いトレンドを特定するように設計された MetaTrader 4 の強力なインジケーターです。動きを正確に予測するツールをお探しなら、Bomb Bank が最適です。 仕組み: このインジケーターは、出来高分析、ローソク足終値、対称トレンドという 3 つの異なる方法を組み合わせて、売買の機会を検出してシグナルを送ります。 Bomb Bank は、買いの機会を特定するときは「爆弾」のようなものであり、売りシグナルを検出するときは「ドクロ」のようなものです。 ボムバンクはなぜ違うのですか? 完全な信頼性: Bomb Bank Signal は信号を削除しません。一度シグナルが発せられると、シグナルは残り続けるので、チャンスを逃すことはありません。 極めて高い精度: Bomb Bank は誤った信号を送信しません。リアルタイムで最新情報を更新し、市場の進化に合わせて調整しながら、以前のシグナルの透明性を維持します。 ライブアップデ
製品を購入する前に、以下の情報をお読みください。 Apollo Pips PLUS SP はユニークな製品です。これは、私の新しい「アポロ ピップス」インジケーターと、私のすべての取引インジケーターにアクセスできる「スーパー パック」ボーナスを手に入れたい人のためのものです。 Apollo Pips PLUS SP 製品を購入すると、実際には私の Apollo Pips インジケーターのまったく新しいバージョンを購入することになります。このバージョンのインジケーターには改良されたアルゴリズムと使いやすいパラメーターがあり、あらゆる市場およびあらゆる取引スタイルでインジケーターを使用する機会が得られます。 この製品の購入者は、私のスーパーボーナスとして、他のすべてのインジケーターにも無料でアクセスできます!私のすべての取引ツールにアクセスしたい場合は、この製品が最適です!:) しかし、これがすべてではありません!:) この製品のすべての購入者は、私の新しいインジケーターを無料で入手する資格もあります!:)新しい取引インジケーターを利用できるようになりました。私の特権のある「スーパー パッ
Enigmera
Ivan Stefanov
5 (2)
エニグメラ:市場の中核 https://www.enigmera.com はじめに このインディケータと取引システムは、金融市場に対する驚くべきアプローチです。ENIGMERAは、フラクタルサイクルを使用して、サポートとレジスタンスレベルを正確に計算します。本格的な蓄積局面を示し、方向性と目標を示します。 トレンド中でも調整中でも機能するシステムです。 どのように作動するのか? ENIGMERAは、支持線・抵抗線、目標線、乖離線の3つのラインで構成されています。このシステムは、過去のデータを現在と未来に外挿する典型的な市場指標とは異なり、現在の完全な画像を提供します。支持線上にある場合、それは本当の支持を意味し、抵抗線上にある場合、それは本当の抵抗を意味する。ある水準が破られた場合、それはトレンドの変化を意味する。再描画はしない。 市場は常に進化しているため、ENIGMERAはその評価ツールを適応させ、定期的に戦略を修正しています。  これにより、すべてのシナリオが徹底的に評価されることが保証されます。この市場指標の独自性は、その能力を見れば明らかです。  ENIGM
Cycle Sniper
Elmira Memish
4.38 (32)
NEW YEAR SALE PRICE FOR LIMITED TIME!!! Please contact us after your purchase and we will send you the complimentary indicators to complete the system Cycle Sniper is not a holy grail but when you use it in a system which is explained in the videos, you will feel the difference. If you are not willing to focus on the charts designed with Cycle Sniper and other free tools we provide, we recommend not buying this indicator. We recommend watching the videos about the indiactor and system before pu
Gold Channel is a volatility-based indicator, developed with a specific timing algorithm for the XAUUSD pair, which consists of finding possible corrections in the market. This indicator shows two outer lines, an inner line (retracement line) and an arrow sign, where the theory of the channel is to help identify overbought and oversold conditions in the market. The market price will generally fall between the boundaries of the channel. If prices touch or move outside the channel it is a tra
30% DISCOUNT ! DISCOUNT ! DISCOUNT ONLY FOR 5 USERS at125$ valid for 1 day only.Grab it The PERFECT TREND HIT creates   BUY and SELL  perfect trend   arrow signals based on ADX EMA AND RSI And all filters inbuilt with accurate trend entries. Furthermore, the indicator and template display the trend direction, strength, and trade recommendation for independent price charts. ROCK WITH THE TREND Moreover, it shows the final trade recommendation to BUY or SELL with all filters and displays that info
ECM Elite Channel is a volatility-based indicator, developed with a specific time algorithm, which consists of finding possible corrections in the market. This indicator shows two outer lines, an inner line (retracement line) and an arrow sign, where the channel theory is to help identify overbought and oversold conditions in the market. The market price will generally fall between the boundaries of the channel. If prices touch or move outside the channel, it's a trading opportunity. The
NAM Order Blocks
NAM TECH GROUP, CORP.
5 (1)
MT4マルチタイムフレームオーダーブロック検出インジケーター。 特徴 -チャートコントロールパネルで完全にカスタマイズ可能で、完全な相互作用を提供します。 -必要な場所でコントロールパネルを表示および非表示にします。 -複数の時間枠でOBを検出します。 -表示するOBの数量を選択します。 -さまざまなOBユーザーインターフェイス。 -OBのさまざまなフィルター。 -OB近接アラート。 -ADRの高線と低線。 -通知サービス(画面アラート|プッシュ通知)。 概要 注文ブロックは、金融機関や銀行からの注文収集を示す市場行動です。著名な金融機関と中央銀行が外国為替市場を牽引しています。したがって、トレーダーは市場で何をしているのかを知る必要があります。市場が注文ブロックを構築するとき、それは投資決定のほとんどが行われる範囲のように動きます。 注文の構築が完了すると、市場は上向きと下向きの両方に向かって急激に動きます。注文ブロック取引戦略の重要な用語は、機関投資家が行っていることを含むことです。それらは主要な価格ドライバーであるため、機関投
MT My Way
Issara Seeboonrueang
Best strategy,  Easy trade ,  Support of version update in the future MT My Way:  For new traders with no experience It is a very simple trade. Open the order when there is signal and close the order when there is exit or found the next opposite signal. You can set Stop Loss at the arrow and set the distance at Arrow Gap. For experienced traders, It will be very easy to trade. indicator for trade by yourself TRADE: Forex  TIME FRAME:  All Time Frame (Not M1) SYMBOL PAIR: All Sy
How to use Pair Trading Station Pair Trading Station is recommended for H1 time frame and you can use it for any currency pairs. To generate buy and sell signal, follow few steps below to apply Pair Trading Station to your MetaTrader terminal. When you load Pair Trading Station on your chart, Pair Trading station will assess available historical data in your MetaTrader platforms for each currency pair. On your chart, the amount of historical data available will be displayed for each currency pai
フルSTOインジケータ(3つのSTOインジケータのすべてのバージョンを含む:プレミアム、ゴールド、シルバー) - STABLE TRADE OPTIONは、自動バイナリーオプション取引のために設計されています。 注意深くお読みください! 重要 1つのターミナルで、異なる有効期限を持つ2つのテンプレートを作成します。18:01、18:02のテンプレートは有効期限が1~15分、22:00のテンプレートは有効期限が10~20分です。 勝率:過去5年間で71 資金管理: 預金から0.3 このバージョンのインジケータは、モスクワ時間18:01、18:02、22:00の取引にのみ設定され、有効期限は銀と金が1~15分、プレミアムバージョンは10~20分です。シグナルはローソク足の内側に表示され、すぐに取引を開始します。 インジケータは完全に設定されているので、自分で何かを変更する必要はありません。インストールして取引してください! 実際の口座でstoの全バージョンをチェックし、結果を確認するのに2年以上かかりました。長年のテストの結果、最適なパラメータが選択さ
The AT Forex Indicator MT4 is a sophisticated trading tool designed to provide traders with a comprehensive analysis of multiple currency pairs. This   powerful indicator   simplifies the complex nature of the forex market, making it accessible for both novice and experienced traders. AT Forex Indicator uses   advanced algorithms   to detect trends, patterns and is an essential tool for traders aiming to enhance their forex trading performance. With its robust features, ease of use, and reliabl
TPA True Price Action indicator reveals the true price action of the market makers through 100% non-repainting signals (except early signals mode) strictly at the close of a candle! TPA shows entries and re-entries, every time the bulls are definitely stronger than the bears and vice versa. Not to confuse with red/green candles. The shift of power gets confirmed at the earliest stage and is ONE exit strategy of several. There are available now two free parts of the TPA User Guide for our custo
Ultimate Sniper Dashboard
Hispraise Chinedum Abraham
4.76 (17)
299ドルで割引中! 今後値上げの可能性あり! 下の説明を読んでください! 究極のスナイパーダッシュボードのための最高のエントリーシステム。究極のダイナミックレベル。(私の製品をチェックしてください) 究極のスナイパーダッシュボードはMT4多通貨テスト制限のため、ライブマーケットでのみ作動します。 究極のスナイパーダッシュボードをご紹介します。HA-Sniper、MA-Sniper、その他多くの特別なモードが含まれる最高の製品です。究極のスナイパーダッシュボードは絶対的な獣です! 初心者やエキスパートトレーダーにとって最高のソリューションです。もう二度と動きを見逃さない! シンプルさとピップを愛するトレーダーのために、特別な製品をご用意しました。シンプルでありながら、ダッシュボードは複数のカスタムアルゴリズムに基づき28の通貨ペアを監視し、すべての作業を行います。たった一つのチャートで、プロのように市場を読み解くことができます。もし、為替ペアが動き出したときに、その方向性を正確に特定することができれば、あなたの取引はどれほど改善されることでしょう。   当社のシ
Introduction to X3 Chart Pattern Scanner X3 Cherart Pattern Scanner is the non-repainting and non-lagging indicator detecting X3 chart patterns including Harmonic pattern, Elliott Wave pattern, X3 patterns, and Japanese Candlestick patterns. Historical patterns match with signal patterns. Hence, you can readily develop the solid trading strategy in your chart. More importantly, this superb pattern scanner can detect the optimal pattern of its kind. In addition, you can switch on and off individu
Volatility Trend System - a trading system that gives signals for entries. The volatility system gives linear and point signals in the direction of the trend, as well as signals to exit it, without redrawing and delays. The trend indicator monitors the direction of the medium-term trend, shows the direction and its change. The signal indicator is based on changes in volatility and shows market entries. The indicator is equipped with several types of alerts. Can be applied to various trading
Connect Indicator is a tool used for connecting indicators between the MQL market and MT4. The connected indicators are made by our group and can be used for other applications, such as sending messages to the Line application or Telegram application. If you have any questions, please don't hesitate to ask us to receive support. Function and indicator buffer Buffer one is the high price of the previous candle. Buffer two is the high price of the previous candle. Usage To connect indicators to fu
TrendMaestro
Stefano Frisetti
5 (3)
note: this indicator is for METATRADER4, if you want the version for METATRADER5 this is the link:  https://www.mql5.com/it/market/product/108106 TRENDMAESTRO ver 2.4 TRENDMAESTRO recognizes a new TREND in the bud, he never makes mistakes. The certainty of identifying a new TREND is priceless. DESCRIPTION TRENDMAESTRO identifies a new TREND in the bud, this indicator examines the volatility, volumes and momentum to identify the moment in which there is an explosion of one or more of these data a
This product is based on the methodologies of Gann, his follower Don E. Hall. The Indicator builds a working view grid, which is used to analyze graphics. The Pyrapoint tool, developed by Don Hall, is a grid based on the Pythagorean cube. In his calculations he uses the Gann Square 9 methodology and the relationship between Price and Time. This tool is used to predict changes in trend and overall market actions. More information about the method   HERE
3 Indicators in 1 indicator Strategy based on price action Made specifically for the best forex currency pairs Can be used in the best time frame of the market at a very reasonable price This indicator is basically 3 different indicatos . But we have combined these 3 indicators in 1 indicator so that you can use 3 indicators at the lowest price. All three strategies are based on price action. But based on different trends. Long term, medium term and short term Attributes : No repaintin
Max Payneは、矢印の形でシグナルを与える反転/トレンドシグナルインジケーターです。このインジケーターは、同じバーの終値でシグナルを出します。このインジケーターは、異なる期間でチャート上に複数回ドロップして、シグナルの2倍/3倍の確認を取得できます。 このインジケーターは、あらゆる取引スタイルに合わせて高度に調整できますが、再描画やバックペイントは一切行われません。購入後には、使用したテンプレートとともにスクリーンショットに表示される完全なシステムが表示されます。 ----------------- 取引方法: トレンドフィルター(購入後に得られるペイントレンド)が方向に一致している間、同じバーでトリプル確認が得られるまで待ちます 取引を開始し、買い取引の場合は金色の矢印 (テンプレート) より下、売り取引の場合は金色の矢印 (テンプレート) より上にストップロスを設定します。終了シグナルは最初の反対側の白い点のシグナル (テンプレート) です。 ----------------- パラメーター : 信号周期:矢印周期 フィルター: 信号フィルター 距離 : ローソクからの矢印
JULY OFFER 80% OFF next price for unlimited version will be 17000$. This is the only time you can get this institutional and professional indicator at this price for unlimited version. Don't dare to miss this. The tool I am about to introduce to you you can't compare it with other tools due to its strategy and accuracy level in predicting the next price directional movement . This tool is designed for serious traders who have decided to make a difference through trading. Be the next person to wi
4.8(25件)  ゴゴジャングル での評価 【トレンドラインPro2】 MT4(MetaTrader4)ライントレード補助インジケーターです。 ダウ理論に忠実であることを前提とした、誰にでもお勧めできる、とてもベーシックな仕様です。 ダウ理論に基づくトレンドを認識し、さらにサポートライン・レジスタンスライン・トレンドラインをリアルタイム自動描画・自動削除します。 精度は非常に高いです。 【挙動確認】 Youtube では、毎週末に挙動確認用動画をアップしています。 【ZigZag】 チャート形状から作られる、ダウ理論に沿ったオリジナルのジグザグをベースとしています。 ジグザグから読み取れるトレンドは、ダウ理論に沿って8段階まで束ねられています。 【Sign】 ダウ理論に基づく8段階のジグザグに沿って、トレンド方向を表示します。 緑(アップトレンド) 赤(ダウントレンド) 白(トレンドレス) 黄(最小から5つ以上のトレンドが上を示している) 黄(最小から5つ以上のトレンドが下を示している) 【Lines】 ダウ理論に基づく8段階のジグザグに沿っ
This indicator has been developed to identify and display these trends quickly and easily, allowing you to see instantly, those currency pairs which are trending, and those which are not – and in all timeframes, with just one click. The 28 currency pairs are displayed as a fan as they sweep from strong to weak and back again, and this is why we call it the ‘currency array’. All 28 pairs are arrayed before you, giving an instant visual description of those pairs that are trending strongly, those
The indicator " ZigZag on Trend " is an assistant in determining the direction of price movement, as well as a calculator of bars and points. It consists of a trend indicator, which follows the price direction by the trend line presented in the form of a zigzag and a counter calculating the number of bars traversed in the direction of the trend and the number of points on the vertical scale. (calculations are carried out by the opening of the bar) The indicator does not redraw. For convenience,
Indicator : RealValueIndicator Description : RealValueIndicator is a powerful tool designed specifically for trading on the EURUSD pair. This indicator analyzes all EUR and USD pairs, calculates their real currency strength values, and displays them as a single realistic value to give you a head start on price. This indicator will tell you moves before they happen if you use it right. RealValueIndicator allows you to get a quick and accurate overview of the EURUSD currency pair tops and bottoms,
作者のその他のプロダクト
Forex Workstation   is a powerful and efficient Forex trading bot designed to use patterns, price hold levels, volatility analysis and market scaling. This bot offers unique capabilities for automated trading and optimization of strategies on various currency pairs. Let's look at the main functions and settings of Forex Workstation: Main functions: • Multicurrency: Forex Workstation supports a wide range of currency pairs, which allows you to diversify your portfolio and distribute risks. • Usin
Form Designer : Advanced Trading Bot for Forex and Cryptocurrency Markets Form Designer represents the latest advancement in automated trading technology designed to perform optimally in both the Forex and Cryptocurrency markets (with supported brokers). This highly effective tool has unique capabilities, making it an indispensable assistant for traders. Key features and benefits: Multi-currency: Form Designer supports a wide range of currency pairs, providing flexibility and versatility in
The original BoomTroom trend indicator. With this indicator, you do not need to sit near the computer and wait for the inflection point to appear day and night. How important it is to determine the trend in the stock market or the Forex market! Still not sure how to determine the inflection point of a trend? Are you still worried about how to draw short-term and long-term trend lines? Run this smart utility. You will see pivot points of varying strength, as well as long-term and short-term tr
The Forex market can go through many different price paths to reach a point in the future. The future is dynamic. Therefore, planning a trade with a possible future scenario is an essential step for your success. For these purposes, we present to your attention Trend Units. A unique author's strategy that simultaneously determines the strength of trends and points of entry into the market, visualizing it using arrows on the chart. The indicator is optimally adapted for trading on time periods
Trend Sys, an indicator designed to detect trends in price movement and allows you to quickly determine the direction of the trend. The best way to trade Trend Sys is to enter the market when Trend Sys peaks and goes the other way. This is a sign of a trend reversal. I hope you enjoy this indicator and leave your comments to make it even better. Good luck and happy trading.
Using the Trend Moment indicator, you can find not only overbought and oversold zones, but also be able to identify the strongest reversals of the current trend. This will take your trading to a whole new level. Forget about slipping in oscillators, be it Stochastic or RSI or any other oscillator. Trend Moment signals 100% do not redraw and do not require adjusting the parameters - the indicator will work equally well on any chart, even with default parameters.
Trend Sens is a universal indicator, the values of which are calculated based on different indicators. The iPump indicator is a versatile indicator that combines the advantages of three categories of indicators. You get 3 indicators in 1 product. Trend Sense itself appeared in the process of many years of work with financial assets. The indicator has become a consequence of those desires and requirements, for the analysis that I personally would like to use for trading.
With the development of information technologies and a large number of participants, financial markets are less and less amenable to analysis by outdated indicators. Conventional technical analysis tools, such as the Moving Average or Stochastic, in their pure form are not able to determine the direction of the trend or its reversal. Can one indicator indicate the correct direction of the future price, without changing its parameters, in the history of 14 years? At the same time, not to lose ad
The Trend Map indicator is designed to detect trends in price movement and allows you to quickly determine not only the direction of the trend, but also to understand the levels of interaction between buyers and sellers. It has no settings and therefore can be perceived as it signals. It contains only three lines, each of which is designed to unambiguously perceive the present moment. Line # 2 characterizes the global direction of the price movement. If we see that the other two lines are above
Trend LineA is a powerful trend indicator equipped with everything you need to trade and at the same time very easy to use. The indicator calculates the most probable zones of trend stop / reversal, zones of confident trend movements. The indicator works on all timeframes and currency pairs. The indicator gives quite accurate signals and it is customary to use it both in trend and flat markets. It is advisable to use the indicator in combination with other instruments for more reliable signals
Original Trrend Arrow trend indicator showing buy and sell areas. With this indicator, you do not need to sit near the computer and wait for the inflection point to appear day and night. The indicator is very easy to use. When an up arrow appears, open a buy deal. When a down arrow appears, open a sell trade. The indicator works on all timeframes and currency pairs. It is advisable to use the indicator in combination with other instruments for more reliable signals and making a more balance
One of the biggest challenges traders face is finding the trading system that's right for them. Trend Op indicator predicts the most likely short-term price movement based on complex mathematical calculations. This indicator is designed to detect trends in price movement and allows you to quickly determine not only the direction of the trend, but also to understand the levels of interaction between buyers and sellers. It has no settings and therefore can be perceived as it signals.
The Trend Hist indicator is designed to display on a chart and visually evaluate the trailing algorithm by inside bars. This indicator finds strong trend movements of a currency pair on a given number of bars, and also finds a correction to this trend. If the trend is strong enough, and the correction becomes equal to the one specified in the parameters, then the indicator signals this.
The Trend Slow indicator uses the author's algorithm for analyzing price behavior and displays the result of complex work in the form of lines. For simplicity, the algorithm automatically changes the line color according to its direction. The indicator has a parameter to enable alerts when the color changes, thus helping the trader to identify new market trends. This system will help you find high-probability trades in the direction of strong trends.
The Effect indicator shows the points of potential market reversal. Simple, visual and efficient trend detection. Ready-made trading system. The intelligent algorithm of the indicator determines the trend with good probability. Uses just one parameter for settings. The indicator does not redraw and does not lag. Works on all currency pairs and all timeframes. You should remember that using a combination of forecasting tools, it is advisable to choose 2-3 indicators for trading. Otherwise, the
American traders say: “Trend is your friend”, which means “Trend is your friend”. And indeed it is! By trading with the trend, you reduce your risks and gain an advantage, as you increase the mathematical expectation of completed trades and, therefore, earn more profit. Together with the Going straight indicator you will trade with the trend with ease! This is one of the most effective ways to deal with market trends. Trading strategies using the channel indicator belong to the classic method
Schrodinger Channel is a non-redrawing channel indicator based on moving averages, it takes into account not simple moving averages, but twice smoothed ones, which, on the one hand, makes it possible to more clearly determine the market movement, and on the other hand, makes the indicator less sensitive. Signals are not redrawn and can be used immediately after they appear. This means that there is no need to wait for a new confirming bar. The lower and upper bands are used as support / resista
The Direction Arrows indicator tracks the market trend while ignoring the sharp market fluctuations and noise around the average price. The indicator implements a kind of technical analysis based on the idea that the market is cyclical in nature. It catches the trend and shows favorable moments of entering the market with arrows. The indicator can be used both for pipsing on small periods and for long-term trading.
The Incognito RSI indicator is an advanced internal strength index. It transforms the signal so that the low-frequency components lag behind much more than the high-frequency components. In general, the data of the last bar has more weight than the previous data, like an exponential moving average. The indicator demonstrates not the relative strength of the compared trading instruments, but the internal strength of a single instrument, therefore it is the “Internal Strength Index”. This is an
The Oscillator Trend indicators are most useful in identifying trend decay. Nobody canceled the divergence. Correct use of this signal will give you a certain head start in the market. When working in flat. The principle of operation of the oscillator is based on the measurement of fluctuations. The indicator tries to determine the maximum or minimum of the next swing - an exit from the overbought and oversold zones. Do not forget that these signals are most interesting at the borders of the fl
Purpose Trend - analyzes the current trend gives an excellent understanding of which direction the market is aimed at, at what point it should be expected in the near future. Unfortunately, most of the popular indicators in practice give a huge number of false signals, since they all work without any consideration of global trends. That is why in today's conditions, when the market is far from stable price movement, it is almost impossible to build a strategy without using trend indicators. H
BitTerraCoin is a unique trading system! It goes through the entire history and all currency pairs with one single setting. Works using sharp tick movements. Recommendations for working with a scalpel: It is recommended to work on liquid Forex pairs with a low spread. The lower the commission and the spread, the greater the profit. You can start using it with $ 100 and 0.01 lot. You can work on any hourly period, on any currency pair and on the server of any broker. Details: The MaxSpread p
The Make Use trend indicator copes with the main task of trading: to find an entry point to the market at the moment of trend initiation and an exit point at the moment of its completion. A stable movement of quotations in a certain direction is called a trend in trading. In this case, the movement itself can be downward, upward or sideways, when the market movement does not have a pronounced direction. The Make Use trend indicator is important for identifying trends in financial markets. Howev
Trend Thyrogen is a trend trading strategy, filtering and all the necessary features built into one tool! Intelligent indicator algorithm with generates input signals and output levels. The principle of operation of the indicator is to automatically determine the current state of the market when placed on a chart, analyze historical data based on historical data and display instructions for further actions on the trader's screen. The system itself shows in the form of arrows when to buy and w
The Channel Token indicator automatically builds a trend movement tracking channel. The price is in its trend movement in a certain range, and not a chaotic spread of the price, it is not clear in which direction. And if the price deviates within a certain range, it means that the boundaries of these ranges are support and resistance lines and form the Channel Token channel. Channel Token - an indicator in which the indicator period is automatically calculated based on the number of bars of
The bot uses 4 MACD indicators and two MAs in its work, thus a zone is formed for trading on the breakdown of the Bands channel and, accordingly, with a minimum stop level and only one deal. The bot also takes into account parameters such as slippage, spread and volatility. Entry is made only when there is sufficient volatility. Thus, the bot works using sharp tick movements. It is recommended to work on liquid Forex pairs with a low spread. The lower the commission and the spread, the greater
The Trend Long indicator accompanies long trends. It can be used only to determine the global trend, but not as an entry point. Any reliable entry indicator can be used for the entry point. Or the standard RSI, based on overbought / oversold levels. The indicator can be used without restrictions on instruments or timeframes. Experiment with the parameters! The parameters are not linear! When you specify a period, you only specify a period to determine the price range for a certain interval. T
This is no ordinary channel. Everyone should analyze it and find a way to use it in their trading strategies. Like all channels, it has a middle line as well as a high and low line. This channel is worth watching for its unusual behavior. The use of the Channel Reliable indicator allows the trader to react in time to the price going beyond the boundaries of the channel set for it. This corridor is built on the basis of the analysis of several candles, and changes in the parameter of the number
The principle of operation of the Patern Trend indicator is to work on a channel breakout. The parameters and width of the channel are selected in such a way that the closing in the red is sufficiently balanced, which is shown on the chart by the inscriptions near the arrows. You can see that the arrow signal does not appear every time the channel is broken. Because the indicator has a volatility filter that has a big impact on the entry. In total on the chart (EURUSD / H1) you can see that t
Signal Switched is a channel indicator designed to work with support and resistance levels and help traders find opportunities to enter the market. It is also protected by arrows that help to enter the market correctly. Channel indicators are among the most popular technical analysis tools on Forex and Signal Switched is a promising market analysis tool. Signal Switched can be used as a base for building a strategy or as an addition to an existing one. Signal Switched is a limited range (co
フィルタ:
レビューなし
レビューに返信