• 概要
  • レビュー (8)
  • コメント
  • 最新情報

Lows And Highs

5

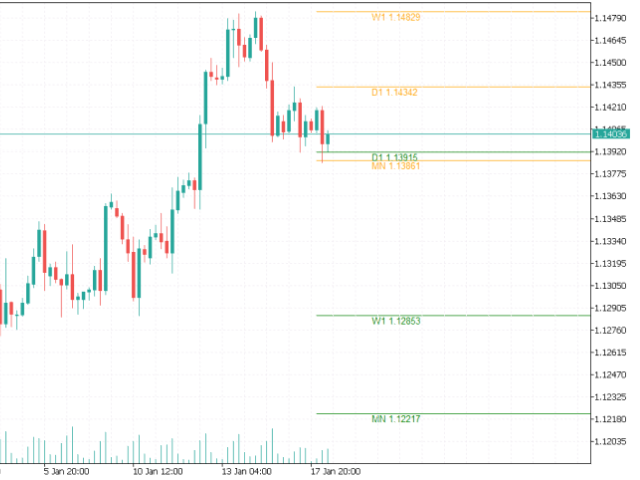
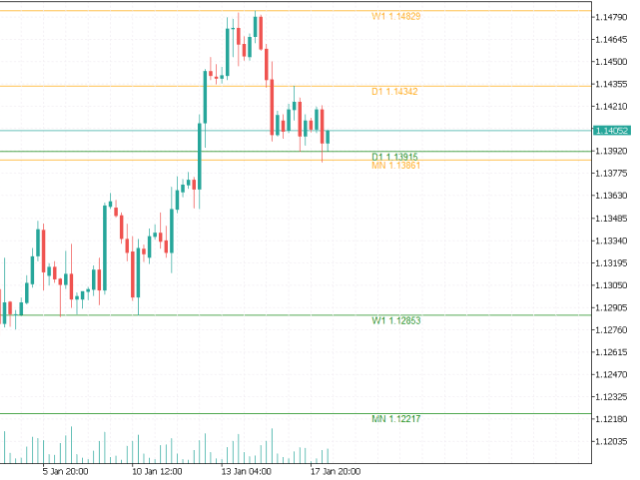
This indicator draws the highest and the lowest prices of the previous periods on the chart. And If you want, Indicator can alert you when the current price arrives these levels.

For example: If you are watching the H1 timeframe, Indicator shows you the  lowest and the highest prices of H4, D1, W1 and M1 periods. So you don't need to open the other periods of chart windows.

Alert Options: Send Mobil Message, Send E-mail, Show Message, Sound Alert

Time Periods: M1, M5, M15, M30, H1, H2, H3, H4, H6, H8, H12, D1, W1, MN
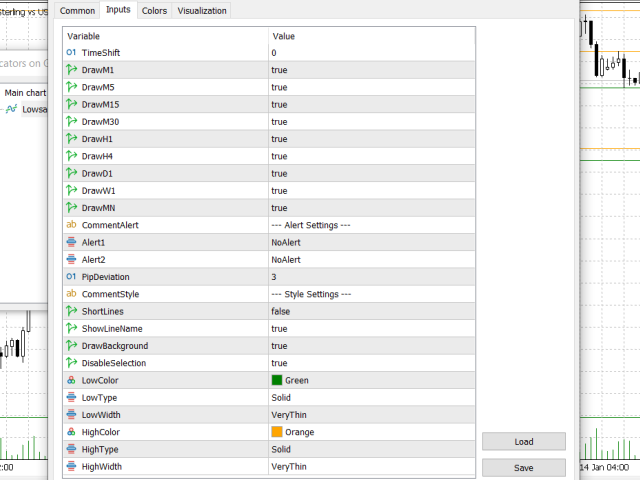
Inputs: 

  • TimeShift: You can set start hour for calculating. And that way you can see levels independently from broker server's time-zone.
  • PipDeviation: You can set price sensibility for alert (Default: 3)
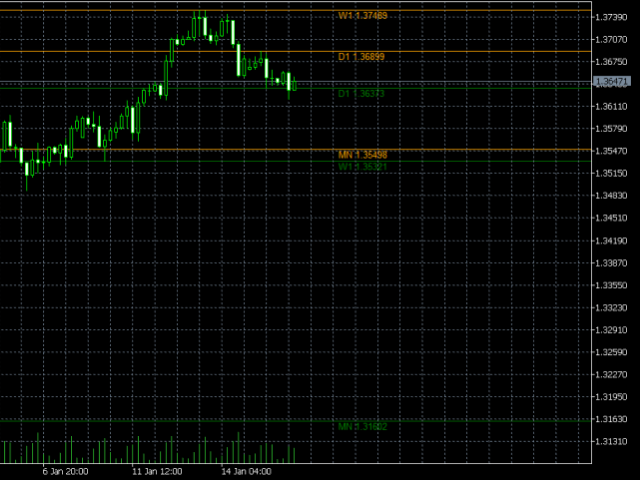
  • Lines: You can chose short line or horizontal line for showing prices
  • Style: You can change line's style (Color, Width, Type)


レビュー 8
simon.metivier
71
simon.metivier 2024.04.02 13:37 
 

Hello Ali, Thanks for the indicator, it works great. I only can't seem to use the time shift, I am trying to start my H4 candle at custom time, but it doesn't seem to work when adding input 1 to 12 for time shift in Hour. Am-I correct?

valdecism
128
valdecism 2022.12.06 21:13 
 

Amazing indicator! Could the line names be only M1, H1, D1 an so on? And could the line values be highlighted in the price area? In my screen when 2 TF'S have the same value, I can't read it. Thanks in advance. Regards!

Detleff Böhmer
2602
Detleff Böhmer 2022.03.11 16:36 
 

Der Indikator arbeitet sehr genau, gute Arbeit.

おすすめのプロダクト
SETTINGS Make sure to select Chart shift option in the chart.   (Right click in the chart ---> Properties (dialog box) ----> Select Chart Shift) Kindly rate and comment about the product for upgradation & Support When using candlestick timers, keep in mind that the timing of candlestick patterns can play a crucial role in your trading strategy. For instance, different timeframes (such as 1-minute, 5-minute, hourly, ) can provide varying insights into price movements and trends. Make sure t
FREE
La **Media Móvil de Tercera Generación (TGMMA)** es una versión avanzada del indicador estándar de **Media Móvil (MA)**. Fue descrita por primera vez por Manfred G. Dürschner en su artículo "Gleitende Durchschnitte 3.0" (en alemán). Aquí están las características clave de la TGMMA: 1. **Reducción del Retraso**:    - A diferencia de las MAs tradicionales, la TGMMA reduce significativamente el retraso. Se adapta más rápidamente a los cambios de precios, lo que la hace ideal para traders que bus
FREE
Hi there! Since I am starting commercial and non-commercial product publishing I would highly appreciate: If you like this product, please rate it. That will help to promote not only this product, but indirectly another ones. So, such promotion will help to make some money from commercial products. Thus, I will have opportunity to fund my another directions of trading researches like bot development using mql4 and mql5 programming languages as well as python written products like crypto bots. If
FREE
Equidistant bands indicator with calculated moving average, allows you to configure the band size and can be used freely as an entry / exit indicator. Buffer 0 = price, buffer 1 = upper band, buffer 2 = lower band. you can also configure the periods of moving averages used in the calculations and also the shift to previous bars in addition to the price that can CLOSE (default) or OPEN. Excellent for fast daily moving pairs and frequent returns.
FREE
No Wick On Close
Flavio Javier Jarabeck
5 (1)
We at Minions Labs love to study, challenge and discover new facts about Price Behavior in current markets. We would NOT call it Price Action because today this is a word totally overused and means, thanks to the False Prophets out there, absolutely NOTHING. The study hypothesis we propose is this: Some Assets, in certain Timeframes, present a behavior of Price continuity when the candlesticks close without a Wick on them... So the purpose of this indicator is to "color" those candlesticks wh
FREE
QuantumAlert Stoch Navigator is a free indicator available for MT4/MT5 platforms, its work is to provide "alerts" when the market is inside "overbought and oversold" regions in the form of "buy or sell" signals. This indicator comes with many customization options mentioned in the parameter section below, user can customise these parameters as needful. Join our   MQL5 group , where we share important news and updates. You are also welcome to join our private channel as well, contact me for the p
FREE
Looks for strong price movements and draws levels upon their completion. You determine the strength of the movement yourself by specifying in the settings the number of points and the number of candles of the same color in a row in one direction. There are 2 types of building in the settings: extrenum - high / low close - close price You can also adjust the number of displayed levels and the number of candles for calculations. By default, the settings indicate 5 levels for 360 candles.
FREE
SUPERTREND; It is a trend following indicator based on the SuperTrend ATR created by Olivier Seban. It can be used to detect changes in trend direction and locate stops. When the price falls below the indicator curve, it turns red and indicates a downtrend. Conversely, when the price moves above the curve, the indicator turns green, indicating an uptrend. Like other indicators, it works well on SuperTrend when used in conjunction with other indicators such as MACD, parabolik SAR, Bollinger Band
FREE
The idea of the system is to indentify the reversal patterns using the calculation of the composite candle. The reversal patterns is similar to the "Hammer" and "Hanging Man" patterns in Japanese candlestick analysis. But it uses the composite candle instead the single candle and doesn't need the small body of the composite candle to confirm the reversal. Input parameters: Range - maximal number of bars, used in the calculation of the composite candle. Minimum - minimal size of the composite can
FREE
Rejection Zones
Paulo Henrique Faquineli Garcia
Este poderoso indicador analisa o gráfico e mostra zonas de Rejeição de Preços! Isto é, locais onde o preço foi, mas não foi aceito pelo mercado! A visualização desta zona de Rejeição, facilita o entendimento do trader na tomada de decisões de onde operar e como operar! O indicador é composto por 4 linhas, sendo classificadas em 2 grupos: Linhas Vermelha e Amarela: Denotam os extremos onde o preço conseguiu chegar, mas não foi aceito! Linhas Laranja e Azul: A partir delas, denotam o Início da
FREE
This indicator automatically identifies demand and supply zones on a number of 1000 candles or more, and you can change that number of settings.  It also carries a high level of accuracy in describing the type of each zone, as it contains: Weak areas . Untested areas . Strong areas . Role-taking areas . Areas tested + number of times visited . Areas to which a return is expected, depending on the direction . The indicator contains alert zones. For signals and more free indicators, you ca
FREE
Stackable VWAP
Flavio Javier Jarabeck
3.33 (6)
Volume Weighted Average Price (VWAP) is a trading benchmark commonly used by Big Players that gives the average price a Symbol has traded throughout the day. It is based on both Volume and price. Additionally we put in this indicator the MVWAP (Moving Volume Weighted Average Price). For those who do not know the usage and the importance od this indicator I recommend a great article about this subject at Investopedia ( https://www.investopedia.com/articles/trading/11/trading-with-vwap-mvwap.asp
FREE
Live 100 k Prop Challenge! Cybele: The Less is More Do you ever think, if you really need to open many positions to make mo ney? Or have you ever thought that it could be better to open one position to make $80 instead of opening 80 positions to make $80.  Which is better for you?  In the first trading approach you take the risk only one time in a good quality trade setup. In the second approach, you take the risk 80 times in low quality trade setups. The most professional traders prefer the
FREE
To get access to MT4 version please click   here . This is the exact conversion from TradingView: "Hammer & ShootingStar Candle Detector" by "MoriFX". This is a light-load processing and non-repaint indicator. All input options are available.  Buffers are available for processing in EAs. You can message in private chat for further changes you need. Thanks.
FREE
MIDAS Super VWAP
Flavio Javier Jarabeck
4.29 (14)
Imagine VWAP, MVWAP and MIDAS in one place... Well, you found it! Now you can track the movement of Big Players in various ways, as they in general pursue the benchmarks related to this measuring, gauging if they had good execution or poor execution on their orders. Traders and analysts use the VWAP to eliminate the noise that occurs throughout the day, so they can measure what prices buyers and sellers are really trading. VWAP gives traders insight into how a stock trades for that day and deter
FREE
Max Hercules
Aaron Pattni
4.33 (6)
Get it FREE while you can! Will be increased to $100 very shortly after a few downloads!! Join my Discord and Telegram Channel - Max's Strategy For any assistance and help please send me a message here.    https://t.me/Maxs_Strategy https://discord.gg/yysxRUJT&nbsp ; The Max Hercules Strategy is a part of a cross asset market making strategy (Max Cronus) built by myself over years of analysis and strategy building. It takes multiple theories and calculations to trade the market in order to c
FREE
Max Poseidon
Aaron Pattni
3.75 (4)
Get it FREE while you can! Will be increased to $200 very shortly after a few downloads!! Join my Discord and Telegram Channel - Max's Strategy For any assistance and help please send me a message here.    https://t.me/Maxs_Strategy https://discord.gg/yysxRUJT&nbsp ; GBPUSD and EURUSD Set files can be found in the comments! (please message me if you need help with them) TimeFrames are harcoded, therefore any chart and time will work the same. The Max Poseidon Strategy is a part of a cross
FREE
Necessary for traders: tools and indicators Waves automatically calculate indicators, channel trend trading Perfect trend-wave automatic calculation channel calculation , MT4 Perfect trend-wave automatic calculation channel calculation , MT5 Local Trading copying Easy And Fast Copy , MT4 Easy And Fast Copy , MT5 Local Trading copying For DEMO Easy And Fast Copy , MT4 DEMO Easy And Fast Copy , MT5 DEMO The homeopathic indicator is also called the CCI indicator. The CCI indicator was propos
FREE
Supports And Resistances Lines
Francisco Gomes Da Silva
4.76 (41)
サポートゾーンとレジスタンスゾーンのインジケーターMT5 このインジケーターは、トップとボトムを自動的に識別する方法を知っています。 このサポートとレジスタンスインジケーターは、トップとボトムに基づいてサポートラインとレジスタンスラインを作成します。 サポートラインとレジスタンスラインの作り方。 これは、自動サポートラインとレジスタンスラインを作成するためのインジケーターです。 インジケーターを使用してサポートレベルを見つける方法。 このインジケーターはトップとボトムを自動的に検出します。 インジケーターは、「ZigZag」が自動的に底を作成するか、新しい底を前の底より低くするたびにサポートラインを自動的に作成するため、インジケーターは画面に自動サポートラインを自動的に描画します。 レジスタンスラインの作成方法。 インジケーターは、「ZigZag」が新しいトップまたは前のトップよりも高いトップを作成するたびに、サポートレベルを作成するのと同じ方法で抵抗線を自動的に作成します。したがって、インジケーターは新しい抵抗を自動的に作成します。トップレベルとボトムレベルがどこにあるかを心配する必
FREE
Candle Zones
Flavio Javier Jarabeck
5 (1)
You probably heard about Candlesticks behaviors, which in most of the times could denote and trace Volume behaviors even if you are not watching Volume itself... Well, this indicator will do this. Naked traders love to rely solely on candlesticks patterns and with Candle Zones you can trap special patterns and DRAW THEM on your chart. As simple as that. There are several filters you can tweak in order to achieve the analysis you want. Just give it a try. After several months of testing, we think
FREE
This indicator is very useful for day traders or short term traders. (MT5 version) No need to calculate the number of pips manually, just look at the chart and you will see the Virtual Take Profit / Virtual Stop Loss target line and evaluate whether the entry point is feasible to reach the intended target or not. Enter the intended   Take Profit / Stop Loss   pips for your trade. The indicator will display   Virtual Take Profit / Virtual Stop Loss   lines for you to easily see if the target i
FREE
The Advanced Pivot Point Indicator is a powerful tool designed to help traders identify key support and resistance levels in the market. This versatile indicator offers a customizable and user-friendly interface, allowing traders to select from five different pivot point calculation methods: Floor, Woodie, Camarilla, Tom DeMark, and Fibonacci. With its easy-to-read lines for pivot points (PP), support (S1, S2, S3, S4), and resistance (R1, R2, R3, R4) levels, the Advanced Pivot Point Indicator pr
FREE
Tillson's T3 moving average was introduced to the world of technical analysis in the article ''A Better Moving Average'', published in the American magazine Technical Analysis of Stock Commodities. Developed by Tim Tillson, analysts and traders of futures markets soon became fascinated with this technique that smoothes the price series while decreasing the lag (lag) typical of trend-following systems.
FREE
IMA Finder MT5
Mubashir Mohamed Quraish Albarakat
1 (1)
This indicator is designed based on the Moving Origin indicator When the moving origin indicator breaks the price, this indicator gives a signal It is useful for better viewing of signals and analysis on them Attributes: Can be used in all symbols Can be used in all time frames Too many signals Simple and quick settings Easy way to work Settings: period: like moving average settings alarmShow: If you want to receive an alert in Metatrader after receiving the signal, enable this setting a
FREE
FRB Aggression Balance - Indicator shows the Agression Balance of the TIMEFRAMES chosen by the user through a histogram in a new window. - This indicator can only be used if the broker provides data on Volumes. Forex market brokers do not report this data. - B3 (Bovespa - Brazil) informs the data and with that it is possible to use it in Brazilian brokerages. Settings Color - Define the color that will be shown in the histogram. Use Historical Data - Defines whether the indicator will calcu
FREE
ForExp1
Mikhail Sergeev
5 (1)
Удобный трендовый индикатор. Не меняет своих значений. Имеет огромные возможности для настройки. Не требователен к ресурсам компьютера. Создавался для работы в системе BearsHunter. Эксперт МТ5 с использованием данного индикатора: https://www.mql5.com/ru/market/product/30381 Эксперт МТ4 с использованием данного индикатора: https://www.mql5.com/ru/market/product/30383 Параметры: m1_MA_Mode_1 - метод усреднения(0-9). m1_MA_Mode_2 - метод усреднения(0-9). m1_MA_Mode_3 - метод усреднения(0-9). m1
FREE
Day Points Indicadtor that shows the points considered important for X days. (Open,Close, High, Low) Used a lot by those who do day trade. These points can be used for decision making by a trader. You will choose the amount of days ago for it to show. Settings High/Low/Close/Open Show - True/False. Days - Number of days that will show on the chart. Color - Line Color. Style - Line Style.
FREE
FT ADX Color Candles
FELIPE MISAEL MORAES KRUGER
4.86 (7)
Trading can be quite tiring when you need to look at several things at the same time. Format of candles, supports, resistances, schedules, news and indicators. This tool aims to facilitate the analysis of the ADX indicator. It colors the candles based on the levels of the indicator and the DI lines. The period, the limit of the indicator and the colors of the candles are customizable. You can also place a visual aid on the lower right side of the graph to view the values of ADX, DI + and
FREE
Funciona como bandas de bollinger normais. Criado por Joe Ross, é um setup de maior risco por ser contra-tendência. Pode ser usado para Day Trade, Swing Trade e Position. Para identificar, é necessário inserir no gráfico as Bandas de Bollinger, com uma Média Móvel Simples de 20 períodos e largura (desvio) 2. Verifica-se um fechamento de determinado candle abaixo da banda inferior de Bollinger. Se o próximo candle fechar dentro das Bandas, marca-se a máxima dele. O rompimento dessa máxima será o
FREE
O Touch VWAP é um indicador que permite calcular uma Média Ponderada por Volume (VWAP) apenas apertando a tecla 'w' no seu teclado e após clicando no candle do qual deseja realizar o calculo, clicando abaixo do candle é calculada a VWAP baseado na minima dos preços com o volume, clicando sobre o corpo do candle é calculado uma VWAP sobre o preço medio com o volume e clicando acima do candle é calculado uma VWAP baseado na máxima dos preços com o volume, voce tambem tem a opção de remover a VWA
FREE
このプロダクトを購入した人は以下も購入しています
まず第一に、この取引インジケーターは再描画されず、再描画されず、遅延しないことを強調する価値があります。これにより、手動取引とロボット取引の両方に理想的なものになります。 ユーザーマニュアル:設定、入力、戦略。 アトミックアナリストは、価格の強さとモメンタムを利用して市場でより良いエッジを見つけるためのPA価格アクションインジケーターです。ノイズや誤ったシグナルを除去し、取引ポテンシャルを高めるための高度なフィルターを備えています。複雑なインジケーターの複数のレイヤーを使用して、アトミックアナリストはチャートをスキャンし、複雑な数学的計算をシンプルなシグナルと色に変換します。これにより、どのような初心者トレーダーでも理解して使用し、一貫した取引の決定を行うことができます。 「アトミックアナリスト」は、新規および経験豊富なトレーダー向けにカスタマイズされた包括的な取引ソリューションです。プレミアムインジケーターとトップノッチの機能を1つの取引戦略に組み合わせ、すべてのタイプのトレーダーにとって汎用性のある選択肢にします。 デイリートレーディングとスキャルピング戦略:高速で正確な
まず第一に、このトレーディングシステムがノンリペイント、ノンリドロー、ノンラグのインジケーターであることを強調する価値がある。これにより、手動取引とロボット取引の両方に理想的なものになっています。 オンラインコース、マニュアル、プリセットのダウンロード。 「スマートトレンドトレーディングシステム MT5」は、新規および経験豊富なトレーダー向けにカスタマイズされた包括的なトレーディングソリューションです。10以上のプレミアムインジケーターを組み合わせ、7つ以上の堅実なトレーディング戦略を備えており、多様な市場状況に対応する多目的な選択肢となっています。 トレンドフォロー戦略:トレンドを効果的に乗り越えるための正確なエントリーとストップロス管理を提供します。 リバーサル戦略:潜在的なトレンドの反転を特定し、トレーダーがレンジ相場を活用できるようにします。 スキャルピング戦略:高速で正確なデイトレードおよび短期取引のために設計されています。 安定性:すべてのインジケーターはノンリペイント、ノンリドロー、ノンラグであり、信頼性の高いシグナルを保証します。 カスタマイズ:個々の取引の嗜好に合わせ
mql5と Telegramの モーニング・ブリーフィングで、詳細とスクリーンショットを含む毎日のマーケット・アップデートをご覧 ください! FX Power MT5 NGは 、長年の人気を誇る通貨強度計FX Powerの次世代モデルです。 この次世代ストレングスメーターは何を提供するのでしょうか?初代FXパワーの魅力すべて プラス GOLD/XAUの強さ分析 より正確な計算結果 個別に設定可能な分析期間 カスタマイズ可能な計算上限値により、さらに優れたパフォーマンスを実現 もっと見たい人のための特別なマルチインスタンス設定 すべてのチャートでお好みの色を無限に設定可能 数え切れないほどの通知オプションにより、重要なことを見逃すことはありません。 Windows 11とmacOSのスタイルで角を丸くした新しいデザイン 魔法のように動くインジケーターパネル FXパワーの主な機能 すべての主要通貨の強さの完全な履歴 すべての時間枠における通貨の強さの履歴 すべてのブローカーとチャートで同一の計算結果 100%信頼できるリアルタイム計算 -> リペイントなし ドロップダウン・リストから
Quantum Trend Sniper
Bogdan Ion Puscasu
4.91 (43)
ご紹介   クォンタム トレンド スナイパー インジケーターは 、トレンド反転を特定して取引する方法を変革する画期的な MQL5 インジケーターです。 13年以上の取引経験を持つ経験豊富なトレーダーのチームによって開発されました。     クォンタムトレンドスナイパーインジケーター   は、非常に高い精度でトレンドの反転を識別する革新的な方法で、あなたのトレーディングの旅を新たな高みに押し上げるように設計されています。 ***Quantum Trend Sniper Indicatorを購入すると、Quantum Breakout Indicatorを無料で入手できます!*** クォンタム ブレイクアウト インジケーターは、トレンドの反転を特定するとアラートを発し、矢印を示し、3 つのテイクプロフィットレベルを提案します。 初心者トレーダーにもプロのトレーダーにも適しています。 量子EAチャネル:       ここをクリック MT4のバージョン:       ここをクリック 推奨事項: 期間:すべての時間枠。最良の結果を得るには、M
Reversal First Impulse levels (RFI)      INSTRUCTIONS        RUS       -       ENG              R ecommended to use with an indicator   -   TREND PRO -  Version MT4                 A key element in trading is zones or levels from which decisions to buy or sell a trading instrument are made. Despite attempts by major players to conceal their presence in the market, they inevitably leave traces. Our task was to learn how to identify these traces and interpret them correctly. Main functions:: Di
トレンド スクリーナー インジケーターでトレンド取引の力を解き放ちます。ファジー ロジックと複数通貨システムを活用した究極のトレンド取引ソリューションです。 ファジー ロジックを活用した革新的なトレンド インジケーターである Trend Screener を使用して、トレンド取引を向上させます。 これは、13 を超えるプレミアム ツールと機能、および 3 つの取引戦略を組み合わせた強力なトレンド追跡インジケーターであり、Metatrader をトレンド アナライザーにする多用途の選択肢となります。 期間限定オファー : トレンド スクリーナー インジケーターは、わずか 50 ドルで生涯ご利用いただけます。 (元の価格 125$ ) (オファー延長) Trend Screener の 100% 非再描画精度の揺るぎない精度を体験して、取引の決定が過去の価格変動の影響を受けないようにしてください。 マルチタイムフレームおよびマルチ通貨機能の多用途性を解放し、比類のない自信を持って外国為替、商品、暗号通貨、インデックスの世界を取引できるようにします。 Trend Screener の包括的な
まず第一に、この取引ツールはノンリペイント、ノンリドロー、ノンラグの指標であり、プロの取引に理想的ですことを強調する価値があります。 オンラインコース、ユーザーマニュアル、デモ。 スマートプライスアクションコンセプトインジケーターは、新米から経験豊富なトレーダーまで、非常 に強力なツールです。Inner Circle Trader AnalysisやSmart Money Concepts Trading Strategiesなど、20以上の有用な指標を1つに組み合わせています。このインジケーターはスマートマネーコンセプトに焦点を当て、大手機関の取引方法を提供し、彼らの動きを予測するのに役立ちます。 特に、流動性分析に優れており、機関がどのように取引しているかを理解しやすくしています。市場のトレンドを予測し、価格の動きを慎重に分析するのに優れています。機関の戦略とトレードを合わせることで、市場の動向についてより正確な予測ができます。このインジケーターは多目的であり、市場構造を分析し、重要な注文ブロックを特定し、さまざまなパターンを認識するのに優れています。 このインジ
Gold Stuff mt5
Vasiliy Strukov
4.89 (178)
Gold Stuff mt5 は、金専用に設計されたトレンド指標であり、あらゆる金融商品にも使用できます。 インジケーターは再描画せず、遅れません。 推奨時間枠 H1. 設定と個人的なボーナスを得るために、購入後すぐに私に連絡してください!  トレンド スキャナーの強力なサポートを利用して、無料のインジケーターを入手し、プライバシーを守ります。あーみー!   設定 矢印を描く - オンオフ。 チャートに矢印を描く。 アラート - 可聴アラートのオンオフ。 メール通知 - オンオフ。 電子メール通知。 プチ通知 - オンオフ。 プッシュ通知。 次に、色域を調整します。 Gold Stuff mt5 は、金専用に設計されたトレンド指標であり、あらゆる金融商品にも使用できます。 インジケーターは再描画せず、遅れません。 推奨時間枠 H1. 設定と個人的なボーナスを得るために、購入後すぐに私に連絡してください!   設定 矢印を描く - オンオフ。 チャートに矢印を描く。 アラート - 可聴アラートのオンオフ。 メール通知 - オンオフ。 電子メール通知。 プチ通
FX Volume MT5
Daniel Stein
4.94 (17)
mql5と Telegramの モーニング・ブリーフィングで、詳細とスクリーンショットを含む毎日のマーケット・アップデートをご覧 ください! FX Volumeは、ブローカーの視点から市場のセンチメントをリアルに洞察する、最初で唯一の出来高インジケーターです。 ブローカーのような機関投資家が外国為替市場でどのようなポジションをとっているか、COTレポートよりもはるかに速く、素晴らしい洞察を提供します。 この情報をチャート上で直接見ることは、あなたの取引にとって真のゲームチェンジャーであり、画期的なソリューションです。 以下のようなユニークなマーケットデータ洞察から利益を得てください。 比率は 、通貨のロングポジションとショートポジションの比率をパーセントで表示します。 比率の変化は 、選択した期間内のロング比率とその変化率を表示します。 Volumes Totalは 、通貨の取引量(ロングとショート)の合計をロット単位で表示します。 Volumes Long :全通貨のロングポジションの取引量を表示します。 Volumes(ショート )は、全通貨のショートポジションの取引量を表示
TPSpro TRENDPRO  - is a trend indicator that automatically analyzes the market and provides information about the trend and each of its changes, as well as giving signals for entering trades without redrawing! The indicator uses each candle, analyzing them separately. referring to different impulses - up or down impulse. Exact entry points into transactions for currencies, crypto, metals, stocks, indices!  -  Version MT4               DETAILED DESCRIPTION               R ecommended to use with
WHY IS OUR FXACCCURATE LS MT5 THE PROFITABLE ? PROTECT YOUR CAPITAL WITH RISK MANAGEMENT Gives entry, stop and target levels from time to time. It finds Trading opportunities by analyzing what the price is doing during established trends. POWERFUL INDICATOR FOR A RELIABLE STRATEGIES We have made these indicators with a lot of years of hard work. It is made at a very advanced level. Established trends provide dozens of trading opportunities, but most trend indicators completely ignore them!
The Volume by Price Indicator for MetaTrader 5 features Volume Profile and Market Profile TPO (Time Price Opportunity). Volume and TPO histogram bar and line charts. Volume Footprint charts. TPO letter and block marker collapsed and split structure charts. Session filtering and grouping. Static, dynamic and flexible range segmentation and compositing methods with relative and absolute visualizations. Graphical layering, positioning and styling options to suit the user's analytic and aesthetic n
AW Trend Predictor MT5
AW Trading Software Limited
4.78 (58)
1 つのシステムでのトレンド レベルとブレイクダウン レベルの組み合わせ。高度なインジケーター アルゴリズムは、市場のノイズをフィルター処理し、トレンド、エントリー ポイント、および可能なエグジット レベルを決定します。インジケーターシグナルは統計モジュールに記録されるため、最適なツールを選択してシグナル履歴の有効性を示すことができます。この指標は、テイクプロフィットとストップロスのマークを計算します。 マニュアルと説明書 ->   ここ / MT4 バージョン ->   ここ インジケーターで取引する方法: Trend Predictor での取引は、たった 3 つの簡単なステップです。 ステップ 1 - ポジションを開く 70% 以上の成功率で買いシグナルが受信されました ステップ 2 - ストップロスの決定 逆信号でトランクを選択 ステップ 3 - テイクプロフィット戦略の定義 戦略 1: TP1 に到達したらポジション全体をクローズする 戦略 2: TP1 に達した時点でポジションの 50% をクローズし、TP2 に達した時点で残りの 50% をクローズします。 戦略 3:
ICT, SMC, SMART MONEY CONCEPTS, SMART MONEY, Smart Money Concept, Support and Resistance, Trend Analysis, Price Action, Market Structure, Order Blocks, BOS/CHoCH,   Breaker Blocks ,  Momentum Shift,   Supply&Demand Zone/Order Blocks , Strong Imbalance,   HH/LL/HL/LH,    Fair Value Gap, FVG,  Premium  &   Discount   Zones, Fibonacci Retracement, OTE, Buy Side Liquidity, Sell Side Liquidity, BSL/SSL Taken, Equal Highs & Lows, MTF Dashboard, Multiple Time Frame, BigBar, HTF OB, HTF Market Structure
Quantum平均足PRO のご紹介 市場のトレンドに対する明確な洞察を提供するように設計された平均足キャンドルは、ノイズを除去し、誤ったシグナルを排除する能力で知られています。混乱を招く価格変動に別れを告げ、よりスムーズで信頼性の高いチャート表現を導入しましょう。 Quantum Heiken Ashi PRO を真にユニークなものにしているのは、従来のローソク足データを読みやすい色のバーに変換する革新的なフォーミュラです。赤と緑のバーはそれぞれ弱気トレンドと強気トレンドをエレガントに強調し、潜在的なエントリーポイントとエグジットポイントを驚くほど正確に見つけることができます。 量子EAチャネル:       ここをクリック MT4のバージョン:       ここをクリック この注目すべき指標には、いくつかの重要な利点があります。 明確性の向上: 価格変動を平滑化することで、平均足バーは市場トレンドをより明確に表現し、有利な取引機会を特定しやすくします。 ノイズの削減: 誤ったシグナルを引き起こすことが多い不安定な価格変動に別れを告げます。 Quantum Heik
Easy By Sell is a market indicator for opening and closing positions. It becomes easy to track market entries with alerts. It indicates trend reversal points when a price reaches extreme values ​​and the most favorable time to enter the market. it is as effective as a Fibonacci to find a level but it uses different tools such as an algorithm based on ATR indicators and Stochastic Oscillator. You can modify these two parameters as you wish to adapt the settings to the desired period. My othe
The indicator very accurately determines the levels of the possible end of the trend and profit fixing. The method of determining levels is based on the ideas of W.D.Gann, using an algorithm developed by his follower Kirill Borovsky. Extremely high reliability of reaching levels (according to K. Borovsky  - 80-90%) Indispensable for any trading strategy – every trader needs to determine the exit point from the market! Precisely determines targets on any timeframes and any instruments (forex, met
"Piranha" - an autonomous trading system that determines overbought and oversold levels on the chart. Red and blue zones represent overbought and oversold levels respectively. Entry points are marked with arrows: a downward arrow in the red zone for "sell" and an upward arrow in the blue zone for "buy". The Take profit level is indicated by the green moving average. Key features: Adjusting the Take profit level as the green moving average changes position. Averaging ability when a new market e
ブレーカートレーダーになり、価格が反転すると市場構造からの利益が変化します。 注文ブロックブレーカーインジケーターは、トレンドまたは価格の動きが枯渇に近づいており、逆転の準備ができていることを識別します。通常、反転または大規模なプルバックが発生しようとしているときに発生する市場構造の変化について警告します。 この指標は、ブレイクアウトと価格の勢いを識別する独自の計算を使用します。使い果たされる可能性のあるポイントの近くで新しい高値が形成されるたびに、インディケーターはその高値の作成を担当する最後の注文ブロックを描きます。次に、移動する価格とともに注文ブロックを追跡します。その後、価格が反対方向にシフトし、その注文ブロックを突破すると、新しい市場構造を作成し、トレンドまたは大きな後退の可能性のある反転の開始を警告します。 注文ブロックは、高値/安値が作成される前の最後の反対色のろうそくであり、価格がこれらの重要な領域を下抜けすると、トレンドの短期的ま​​たは長期的な反転の兆候です。 特徴 重要な枯渇点での市場構造の変化を警告します 価格が使い果たされるレベルに近づくと、
これはMT5のインジケーターで、再描画なしで取引に参入するための正確なシグナルを提供します。 外国為替、暗号通貨、金属、株式、インデックスなど、あらゆる金融資産に適用できます。かなり正確な見積もりを提供し、取引を開始して終了するのに最適な時期を教えてくれます。1つのシグナルを処理しただけでインジケーターの元が取れた例の 動画 (6:22)をご覧ください。Entry PointsPro インジケーターの助けを借りたほとんどのトレーダーの最初の1週間の結果が改善しています。 Telegramグループ に登録してください。Entry Points Proインジケーターのメリットは次の通りです。 再描画のないエントリーシグナル 再描画されるインジケーターでは一度表示されたシグナルが削除されて大きな金銭的損失につながることがありますが、これと異なり、表示されて確認されたシグナルは消えることがありません。 エラーなしの取引開始 インジケーターアルゴリズムによって取引を開始する(資産を売買する)理想的な瞬間を見つけることができます。それを使用するすべてのトレーダーの成功率が向上します。
IX Powerは 、FX Powerの無敵の精度をついにFX以外のシンボルにも提供します。 お気に入りの指数、株式、コモディティ、ETF、さらには暗号通貨の短期、中期、長期のトレンドの強さを正確に判断します。 お使いの端末が提供する すべてを分析する ことができます。ぜひお試しいただき、取引 タイミングが大幅に改善 されることをご体験ください。 IXパワーの主な特徴 100%正確で再描画されない計算結果 - ターミナルで利用可能なすべての取引シンボルに対して 予め設定され、さらに個別に設定可能な強度分析期間のドロップダウン選択 Eメール、メッセージ、モバイル通知による無数の通知オプション EAリクエストのためのアクセス可能なバッファ カスタマイズ可能な計算制限により、さらに優れたパフォーマンスを実現 もっと見たい人のための特別なマルチインスタンス設定 すべてのチャートでお好みの色を無限に設定可能 Windows 11とmacOSのスタイルで角を丸くした新しいパネルデザイン サブ・ウィンドウとメイン・チャートの間をシームレスに移動する、魔法のように動くイン
Bill Williams Advanced is designed for automatic chart analysis using Bill Williams' "Profitunity" system. The indicator analyzes four timeframes at once. Manual (Be sure to read before purchasing) Advantages 1. Automatically analyzes the chart using the "Profitunity" system of Bill Williams. The found signals are placed in a table in the corner of the screen. 2. Equipped with a trend filter based on the Alligator indicator. Most of the system signals are recommended to be used only accordi
TPA True Price Action indicator reveals the true price action of the market makers through 100% non-repainting signals strictly at the close of a candle! TPA shows entries and re-entries, every time the bulls are definitely stronger than the bears and vice versa. Not to confuse with red/green candles. The shift of power gets confirmed at the earliest stage and is ONE exit strategy of several. There are available now two free parts of the TPA User Guide for our customers. The first "The Basics"
** All Symbols x All Timeframes scan just by pressing scanner button ** ***Contact me after purchase to send you instructions and add you in "123 scanner group" for sharing or seeing experiences with other users. After 17 years of experience in the markets and programming, Winner indicator is ready. I would like to share with you! Introduction The 123 Pattern Scanner indicator with a special enhanced algorithm is a very repetitive common pattern finder with a high success rate . Interestingly,
初心者やエキスパートトレーダーに最適なソリューション! このインジケーターは、独自の機能と新しい計算式を取り入れた、ユニークで高品質、かつ手頃な価格のトレーディングツールです。たった1枚のチャートで28の為替ペアの通貨強度を読み取ることができます。新しいトレンドやスキャルピングチャンスの引き金となるポイントを正確に特定することができるので、あなたのトレードがどのように改善されるか想像してみてください。 ユーザーマニュアルはこちら  https://www.mql5.com/en/blogs/post/697384 これが最初の1本、オリジナルだ! 価値のないクローンを買わないでください。 特別な サブウィンドウの矢印で強い通貨の勢いを表示 GAPがあなたのトレードを導く! 基準通貨や気配値が売られすぎ・買われすぎのゾーン(外相フィボナッチレベル)にあるとき、個別チャートのメインウィンドウに警告表示。 通貨がレンジの外側から反落した場合、プルバック/リバーサルのアラート。 クロスパターンの特別なアラート 複数の時間枠を選択可能で、トレンドを素早く確認できます。通貨強
このダッシュボードは、選択されたシンボルの最新の利用可能なハーモニックパターンを表示するので、時間を節約し、より効率的に /   MT4バージョン 。 無料インジケーター:   Basic Harmonic Pattern インジケーター列 Symbol : 選択したシンボルが表示されます。 Trend :   強気または弱気 Pattern : パターンの種類(ガートレー、バタフライ、バット、カニ、サメ、サイファー、ABCD) Entry : エントリー価格 SL: ストップロス価格 TP1: 1回目の利食い価格 TP2: 2回目の利食い価格 TP3:   3回目の利食い価格 Current price :   現在値 Age (in bars):    最後に描画されたパターンの年齢 主な入力項目 Symbols:   "28 Major Currency Pairs "または "Selected Symbols "から選択。 Selected Symbols:   カンマで区切られた監視したいシンボル("EURUSD,GBPUSD,XAUUSD")。ブローカーが
次世代の自動化された需要と供給のゾーン。どのチャートでも機能する新しい革新的なアルゴリズム。すべてのゾーンは、市場の価格行動に従って動的に作成されています。 2種類のアラート --> 1) 価格がゾーンに達したとき 2) 新しいゾーンが形成されたとき もう 1 つの役に立たない指標はありません。実績のある完全な取引戦略を手に入れることができます。     新機能:     価格が需給ゾーンに達したときにアラートを出す     新しい需給ゾーンが作成されたときにアラートを発します     プッシュ通知アラート     ピップ単位のゾーン幅ラベル     MTF のもう 1 つのタイムフレーム。したがって、現在より 2 時間足高いのではなく、現在より 3 時間足し上に見えるようになります。     アラート/ゾーン/MTF 機能を有効/無効にするボタン あなたが得る利点:     取引から感情を取り除きます。     取引エントリをオブジェクト化します。     確率の高いセットアップで利益
2つのオシレーターを組み合わせたもの。 1 つ目はエントリーポイントを表示し、2 つ目は現在のトレンドを表示します。このインジケーターは、すべての高速オシレーター信号または現在のトレンドの方向のみの信号の 2 つのモードで、オシレーター信号を矢印で表示できます。マルチタイムフレームパネルと 3 種類のシグナル通知があります。 利点: デイトレードやスキャルピング取引に適しています トレンドフィルタリング シンプルかつ高感度なセットアップ マルチタイムフレームパネル アドバイザーへの統合に適しています。 あらゆるシンボルとあらゆるタイムフレームに対応 3種類の通知 MT4版→   こちら / 問題解決→   こちら 指標戦略 このインジケーターは 2 つの異なるオシレーターで構成されます。 遅いトレンド ライン (太い) - インジケーターの高レベルが上から下に交差する場合、それは下降トレンドのインジケーターであり、下側の水平レベル (インジケーターの低レベル) が下から上に交差する場合、それは下降トレンドのインジケーターです。上昇傾向。さらに、下のゾーンで遅い線が見つかった場合は、現
MT4版  |  FAQ Owl Smart Levels Indicator は、 Bill Williams の高度なフラクタル、市場の正しい波構造を構築する Valable ZigZag、エントリの正確なレベルをマークする Fibonacci レベルなどの一般的な市場分析ツールを含む 1 つのインジケーター内の完全な取引システムです。 利益を得るために市場と場所に。 戦略の詳細な説明 インジケータを操作するための指示 顧問-取引助手 プライベートユーザーチャット ->購入後に私に書いて、私はプライベートチャットにあなたを追加し、あなたはそこにすべてのボーナスをダウンロードすることができます 力はシンプルさにあります! Owl Smart Levels 取引システムは非常に使いやすいので、専門家にも、市場を勉強し始めて自分で取引戦略を選択し始めたばかりの人にも適しています。 戦略と指標に秘密の数式や計算方法が隠されているわけではなく、すべての戦略指標は公開されています。 Owl Smart Levels を使用すると、取引を開始するためのシグナルをすばやく確認し、注文を出すため
ADR反転インジケーターは、通常の1日の平均レンジに関連して価格が現在取引されている場所を一目で示します。価格が選択した平均範囲とレベルを超えると、ポップアップ、電子メール、またはプッシュを介して即座にアラートを受け取るため、プルバックと逆転にすばやくジャンプできます。インディケータは、チャート上に1日の平均レンジの極値で水平線を描画し、それらを超える価格の数学的確率が付加されているレベルを超える延長も描画します。詳細については、以下をご覧ください... インジケーターとモニターを補完するADRアラートダッシュボードここでも利用可能なすべてのペア:https:// www.mql5.com/en/market/product/66316 MT4バージョンはこちらからも入手できます:https:// www.mql5.com/en/market/product/62757 通常の1日平均レンジ(ADR)内で価格が取引され、これらのレベルを上回っている時間の約60%は、通常、その後の引き戻し(利益確定)の動きを伴う急激な価格の動きの指標です。毎日の範囲の上部または下部からのプルバ
作者のその他のプロダクト
This indicator calculates gann support and resistance prices with use gann pyramid formulation and draw them on the chart. And If you want, Indicator can alert you when the current price arrive these pivot levels. Alert Options: Send Mobil Message, Send E-mail, Show Message and Sound Alert Levels: S1, S2, S3, S4, S5, R1, R2, R3, R4, R5 Inputs:  GannInputPrice: Input price for gann pyramid formulation. GannInputDigit: How many digit do you want to use for calculation formula. (The number and the
FREE
This indicator calculates fibonacci levels via moving averages trend and draw these lines. You can change fast and slow Moving Averages settings for customization. Inputs: Fast MA Time Period :  64 Fast MA Shift: 0 Fast MA Method: Smoothed Fast MA Apply To: Median Price Slow MA Time Period: 32 Slow MA Shift: 0 Slow MA Method: Smoothed Slow MA Apply To: Median Price ZigZag: False ZigZag Color: Red ZigZag Type: DashDot ZigZag Width: VeryThin Fibo Settings TrendFibonacci: True FiboTrendColor: Blac
FREE
MA ZigZag
Ali Gokay Duman
5 (1)
This indicator calculates trend via two different moving averages and draw zigzag trend lines. You can change fast and slow Moving Averages settings for customization. Inputs: Fast MA Time Period :  64 Fast MA Shift: 0 Fast MA Method: Smoothed Fast MA Apply To: Median Price Slow MA Time Period: 32 Slow MA Shift: 0 Slow MA Method: Smoothed Slow MA Apply To: Median Price ZigZag Color: Red ZigZag Type: DashDot ZigZag Width: VeryThin 
FREE
This indicator calculates gann support and resistance prices with use gann pyramid formulation and draw them on the chart. And If you want, Indicator can alert you when the current price arrive these pivot levels. Alert Options: Send Mobil Message, Send E-mail, Show Message and Sound Alert Levels: S1, S2, S3, S4, S5, R1, R2, R3, R4, R5 Inputs:  GannInputPrice: Input price for gann pyramid formulation. GannInputDigit: How many digit do you want to use for calculation formula. (The number and the
FREE
This indicator calculates support and resistance prices in multi-timeframe with different formulation and draw them on the chart that style do you choose. And If you want, Indicator can alert you when the current price arrive these pivot levels. Formulations: Classic, Camarilla, Woodie, Demark, Floor, Fibonacci Alert Options: Send Mobil Message, Send E-mail, Show Message, Sound Alert Levels: PP, S1, S2, S3, S4, S5, R1, R2, R3, R4, R5, TC, BC  and Middle Points Why do you need this indicator:
You can use this tool to create as many pending orders (limit order) as you want in one button press. All inputs must be in points. You can use this useful tool when such as FED speech times. User Inputs: MagicNumber = Magic number DeviationPoint = Deviation point number for limit orders Level = You can choise how many level do you want to create pending orders. BuyOrder = true/false SellOrder = true/false StartDistance = Distance between each level. StepDistance = Distance to be added incremen
FREE
This indicator draws on the chart high and low prices of different periods . And If you want, Indicator can alert you when the current price arrive these levels. Alert Options:   Send Mobil Message, Send E-mail, Show Message, Sound Alert Time Periods:  M1, M5, M15, M30, H1, H4, D1, W1, MN Inputs:  TimeShift: You can set start hour for calculating. And that way you can see levels independently from broker server's time-zone. PipDeviation: You can set price sensibility for alert (Default: 3) Lines
FREE
You can send MetaTrader screenshot easily to your identified telegram channel via press the send button that on the chart. TelegramBotToken: Telegram API credentials. You can create API credentials on my.telegram.org web page ChatId: Your telegram chatId. Secreenshots will be sending this channel - Please do not press the button repeatedly. This may cause your bot or ip address to be blocked. - You have to add telegram api address ( https://api.telegram.org ) in Option > Expert Advisors > Allow
FREE
You can send MetaTrader screenshot easily to your identified telegram channel via press the send button that on the chart. TelegramBotToken: Telegram API credentials. You can create API credentials on my.telegram.org web page ChatId: Your telegram chatId. Secreenshots will be sending this channel  - Please do not press the button repeatedly. This may cause your bot or ip address to be blocked. - You have to add telegram api address ( https://api.telegram.org ) in Option > Expert Advisors > Allow
FREE
This utility exports candle data   which you chosed by input parameter  to CSV  file. Time Frames:  M1,M5,M15,M30,H1,H4 Inputs: StartTime: Start time for exporting data. EndTime:   End time for exporting data. DataType: Close, Open, High, Low, Median(HL/2), Typical(HLC/3), Weighted(HLCC/4), Pip(H-L). DecimalSeperator: Decimal seperator for candle price data. (Default = ".") CSVDelimiter: Delimiter character for CSV file.  (Default = ";") * This utility exports candle data horizontally. That
FREE
This indicator calculates support and resistance prices in multi-timeframe with different formulation and draw them on the chart that style do you choose. And If you want, Indicator can alert you when the current price arrive these pivot levels. Formulations: Classic, Camarilla, Woodie, Demark, Floor, Fibonacci Alert Options: Send Mobil Message, Send E-mail, Show Message, Sound Alert Levels: PP, S1, S2, S3, S4, S5, R1, R2, R3, R4, R5, TC, BC and Middle Points Why do you need this indicator:
This Expert Advisor follows your channel lines that you draw. and when the price reaches these support and resistance trend lines, EA send open or close order automatically. You must draw two trend line with same color for EA to work, not equidistant channel line. and this color must be specified in ChannelColor parameter Strategies: Inside Channel Strategy: If the price reaches bottom trend line, the EA will place a buy order. and when the price reaches the top trend point, EA send close orde
フィルタ:
simon.metivier
71
simon.metivier 2024.04.02 13:37 
 

Hello Ali, Thanks for the indicator, it works great. I only can't seem to use the time shift, I am trying to start my H4 candle at custom time, but it doesn't seem to work when adding input 1 to 12 for time shift in Hour. Am-I correct?

Ali Gokay Duman
10456
開発者からの返信 Ali Gokay Duman 2024.04.03 14:01
Thank you for your feedback. No, You are correct. I'll check ASAP.
valdecism
128
valdecism 2022.12.06 21:13 
 

Amazing indicator! Could the line names be only M1, H1, D1 an so on? And could the line values be highlighted in the price area? In my screen when 2 TF'S have the same value, I can't read it. Thanks in advance. Regards!

Ali Gokay Duman
10456
開発者からの返信 Ali Gokay Duman 2022.12.07 06:47
Of course, it could be. Thank you for your good feedbacks. I'll add these features in the next version asap.
marcello 981
118
marcello 981 2022.06.15 07:38 
 

Great indicator! waiting for more timeframes like, H3, H6...

Ali Gokay Duman
10456
開発者からの返信 Ali Gokay Duman 2022.06.22 17:24
Thank you for your feedback. I added H2, H3, H6, H8 and H12 time frames
Detleff Böhmer
2602
Detleff Böhmer 2022.03.11 16:36 
 

Der Indikator arbeitet sehr genau, gute Arbeit.

Ali Gokay Duman
10456
開発者からの返信 Ali Gokay Duman 2022.03.12 17:18
Ich danke dir sehr. Wenn Sie irgendwelche Vorschläge haben, würde ich sie gerne hören.
drloewtz
69
drloewtz 2022.02.25 21:06 
 

Wirklich ein Top Indikator! Bin begeistert! Danke dafür :)

Ali Gokay Duman
10456
開発者からの返信 Ali Gokay Duman 2022.02.26 06:54
Danke. Ich bin froh, dass es dir gefällt.
vinnil07
14
vinnil07 2022.02.12 04:37 
 

An excellent indicator. Please make a separate notification for buying and selling. Thanks!

Ali Gokay Duman
10456
開発者からの返信 Ali Gokay Duman 2022.02.12 09:07
Thank you for your feedback. I'll add next version
13qwerty
55
13qwerty 2022.02.02 08:49 
 

Прекрасное дополнение к любой стратегии. Разработчику большое спасибо!

Ali Gokay Duman
10456
開発者からの返信 Ali Gokay Duman 2022.02.02 11:22
Thank you
Ruhail Ashraf Khan
630
Ruhail Ashraf Khan 2022.01.30 15:44 
 

Plz add high and low on chart and quarterly timeframe as well.

Ali Gokay Duman
10456
開発者からの返信 Ali Gokay Duman 2022.01.31 08:16
Thank you for your feedback. I'll add quarterly timeframe.
レビューに返信
バージョン 1.3 2022.11.30
- Lows and High lines were hidden in the object list for preventing wrong deletion.

- A drag-drop button was added to the chart window for hiding lines easily. (you should set ButtonEnable parameter in the user input list to use it)
バージョン 1.2 2022.06.22
- H2, H3, H6, H8, H12 time frames added
バージョン 1.1 2022.02.14
- Added AlertLH input parameter which you can choose low, high or both price alert.