Price Ratio
- インディケータ
- Tretyakov Rostyslav
- バージョン: 1.0
- アクティベーション: 5
The indicator calculates the price ratio between two timeframes
Selecting timeframes in the settings
First timeframe for analysis
Second timeframe for analysis
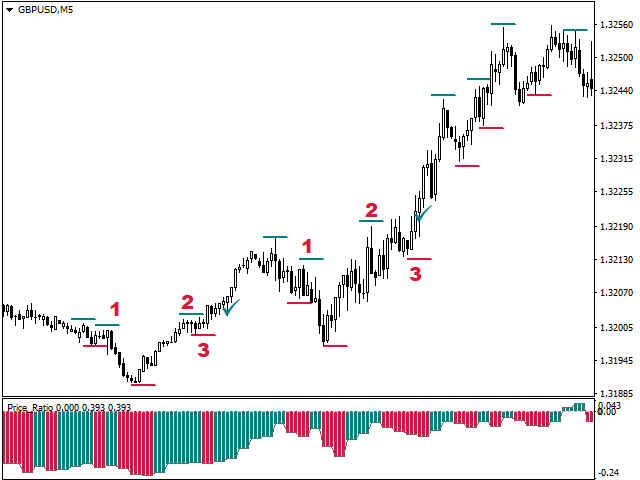
The oscillator shows the change in the price ratio
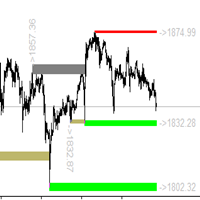
Calculates support and resistance levels and shows them on the chart
Displays pop-up windows with the price of the current level
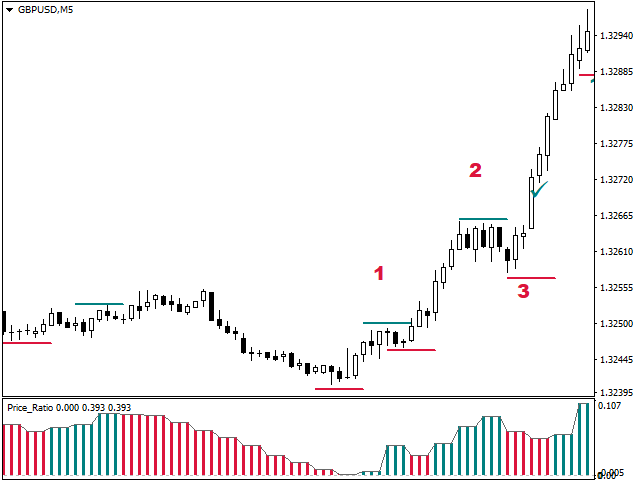
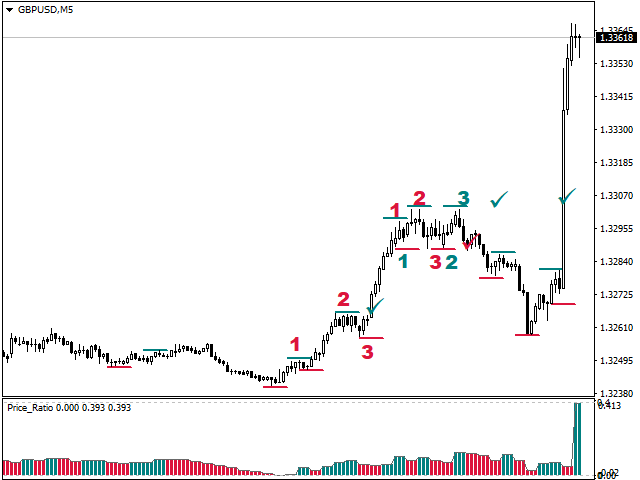
I found a bearish pattern for myself (fig. №1)
and a bullish pattern (fig. №2)
You can find patterns to your liking
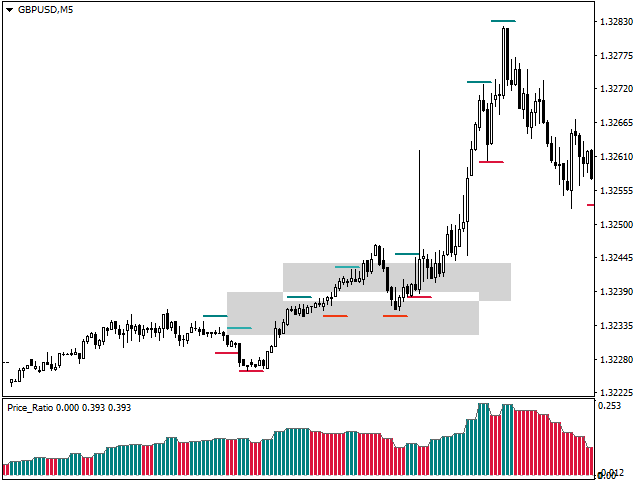
Can be used to determine support and resistance levels in your strategy (fig. №3)
Available to disable the display of levels
Show signal trend lines
Working time setting available
Hour of time to start showing trend lines
Hour of time to end showing trend lines
Available history limitation for displaying oscillator and levels
Month limiting history / false-all available
Resizable available
Width Histogram & lines
Color customization available
Color Histogram & lines UP
Color Histogram & lines DN
