Smart Channel New
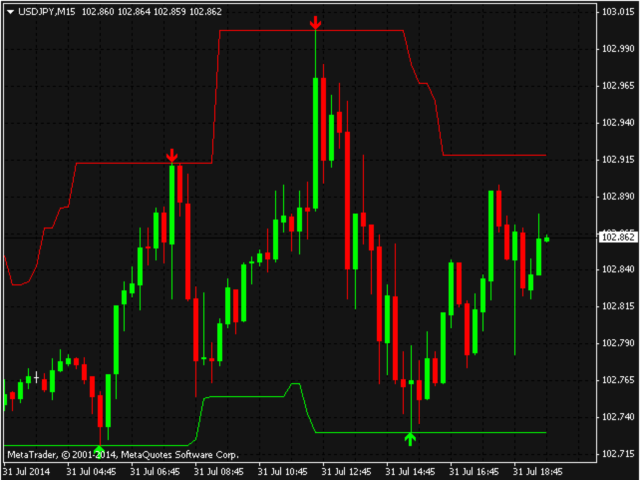
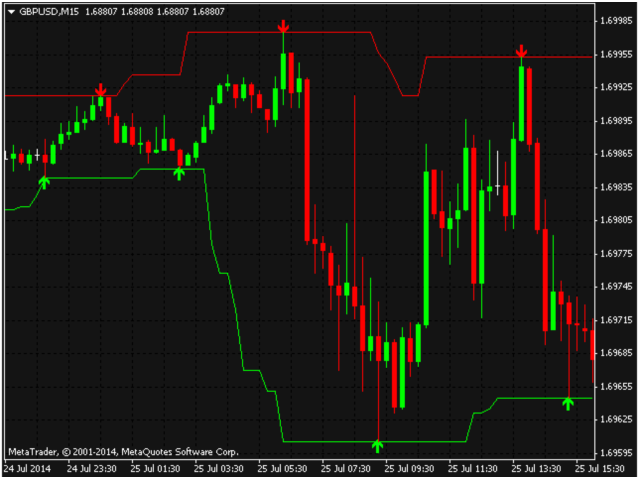
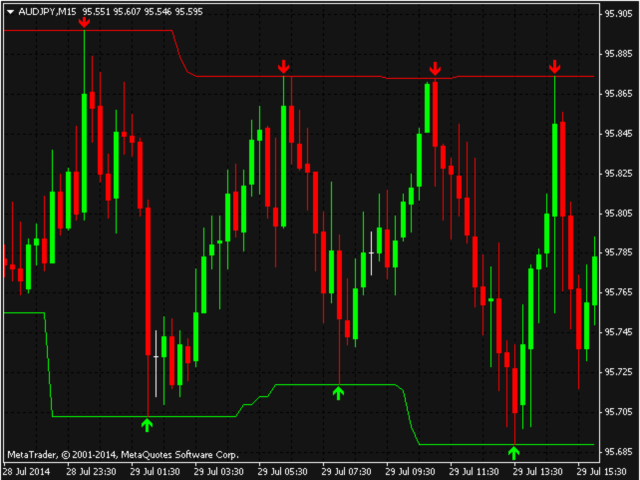
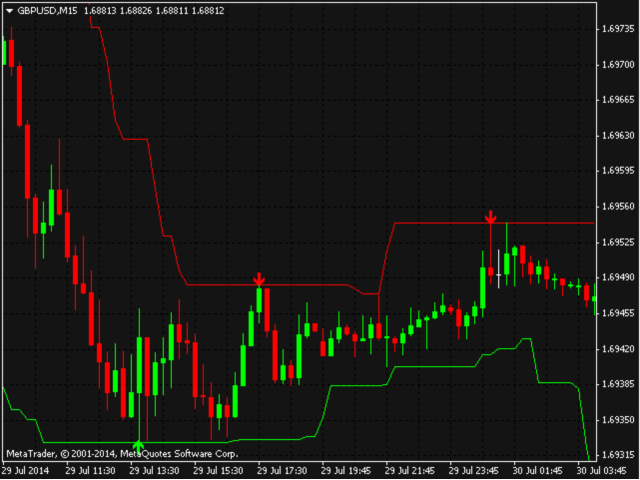
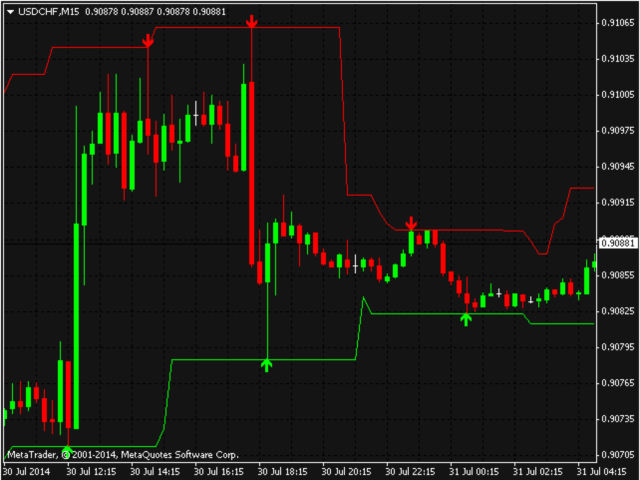
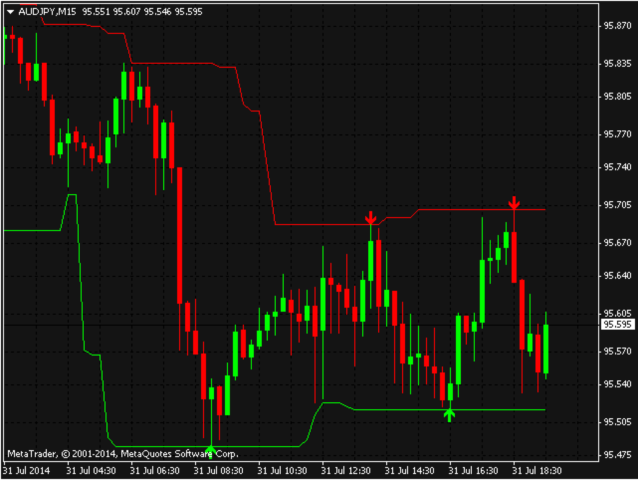
This simple, yet powerful indicator is very good way to determine actual S/R levels. It's main purpose is making your overview on markets much better.It has built-in arrow signal system, which should be used along with MT indicators for best results.Just try it.
Recommended MT indicators to use along:
- Bollinger Bands (default)
- RSI (period 3, levels 10/90)