Investment Castle Engulfing MT4
- インディケータ
- Ahmed Alaaeldin Abdulrahman Ahmed Elherzawi
- バージョン: 1.2
- アップデート済み: 9 5月 2022
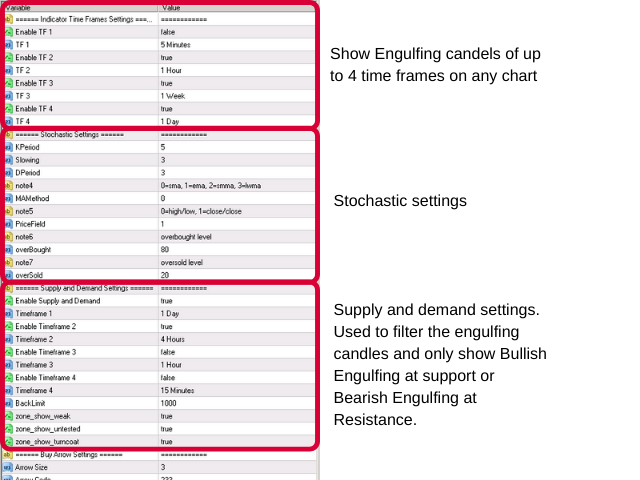
Whether you are a scalper or daily trader, you will always look for bullish / bearish engulfing candles. This can be a bit tricky and stressful when you try to visually identify the engulfing candles on the chart. Not only that, you might be trading on the M15 time frame but the engulfing candle is forming or has already formed in the H4 time frame. This indicator is made to do that on your behalf.
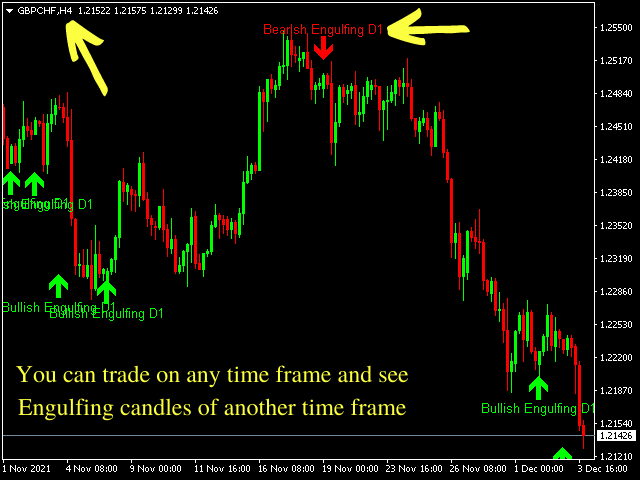
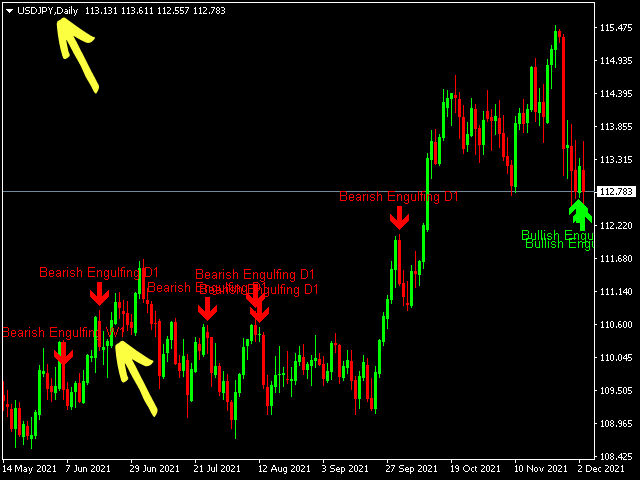
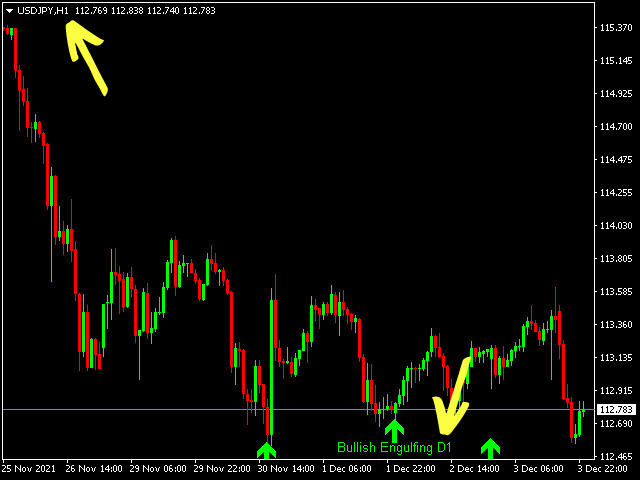
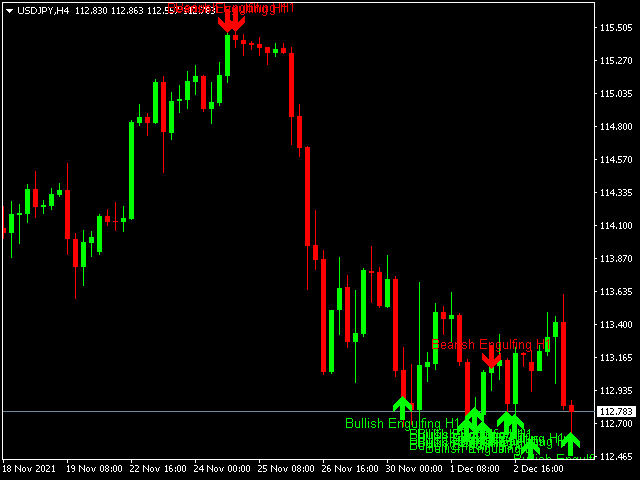
You can trade on any time frame and see Engulfing candles of another time frame, this means that you can choose up to 4 time frames to see their engulfing candles on a chart of a different time frame. I integrated the supply and demand indicator in this indicator so that it will only show the engulfing candles when the supply or demand option is active.
The indicator is available for both MT4 and MT5.