FIRST: I am NOT a coder ! I am a TRADER that was forced to code, because i needed some special tools! So i am sorry for minor graphic-bugs and so on...
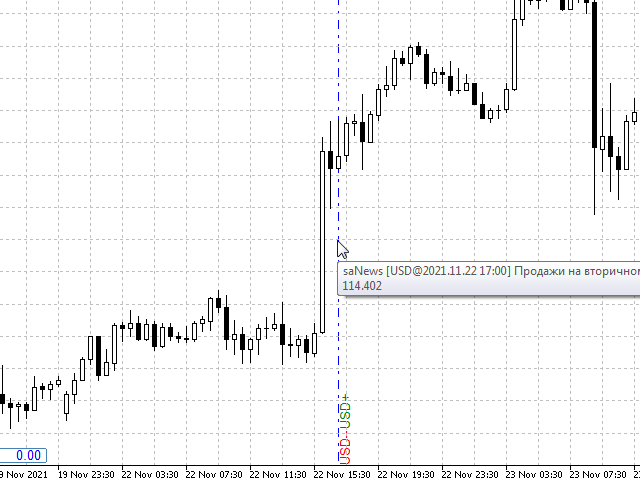
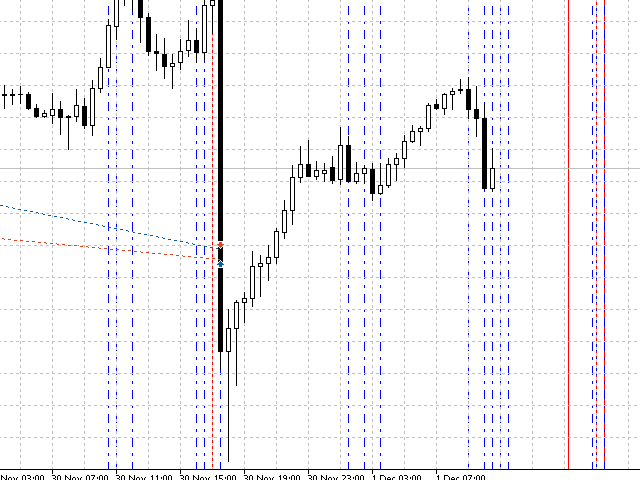
this little free tool allows you to set 5 vertical lines at specific time. you can use it to mark london open / asia open / comex open and so on... it draws the lines in the future space - so you wont miss an important time / candle
you can select color..thickness of the lines you can select only 2 or 3 of the 5 max. lines - you dont have to
This indicator displays Pivot-Lines, preday high and low, preday close and the minimum and maximum of the previous hour. You just have to put this single indicator to the chart to have all these important lines, no need to setup many single indicators.
Why certain lines are important Preday high and low : These are watched by traders who trade in a daily chart. Very often, if price climbs over or falls under a preday low/high there is an acceleration in buying/selling. It is a breakout out of
Coral trend is a trend-following indicator that is widely popular among FOREX traders . It is usually used as a confluence with other indicators. It uses combinations of moving averages with complex smoothing formulas! It has two configurable parameters: Coefficient - smoothing ratio (*)
Applied price Calculation: Coral = (-0.064) * B6 + 0.672 * B5 - 2.352 * B4 + 2.744 * B3
The Supertrend indicator was originally created by a french fellow named Olivier Seban , and its goal is to identify the Primary Trend of prices . Its calculation is easy and based on the average of Highs and Lows and then we add the volatility of a custom period, plus a multiplier. This way we get the Supertrend Line. You can find in the web several approaches and trading strategies using this very useful indicator.
HOW TO "READ" THIS INDICATOR
If the closing prices are above Supertrend Line
Simple and easy-to-use trading panel. Replaces the standard Meta Trader 5 panel. This new panel allows you to add stop loss and take profit (in points). It also allows you to click and drag it to any place on the screen, making it easier to view and operate. Choose the color of the panel, its initial position, and whether you want to disable the standard MT5 panel. When you close Trade Panel R3, the standard MT5 panel will be restored.
Free automatic Fibonacci is an indicator that automatically plots a Fibonacci retracement based on the number of bars you select on the BarsToScan setting in the indicator. The Fibonacci is automatically updated in real time as new highest and lowest values appears amongst the selected bars. You can select which level values to be displayed in the indicator settings. You can also select the color of the levels thus enabling the trader to be able to attach the indicator several times with differe
One of the simplest Pivot Point indicator, easy to operate, and most complete for a single chart in determining Resistance and Support level lines.
In single chart, it will show R&S Level Line with 5 popular types of Pivot Point, Highest&Lowest of closing price Include the Trend and up to 3 Time Frames.
Five types (Floor, Woodie, Camarilla, DeMark, & Fibonacci) of popular Pivot Points in determining Resistance and Support levels. With just using simple button on th
This indicator is especially for the binary trading. Time frame is 1 minutes and exp time 5 or 3 minutes only. You must be use martingale 3 step. So you must put lots size is 10 % at most. You should use Mt2 trading platform to connect with my indicator to get more signal without human working. This indicator wining rate is over 80% but you may get 100% of profit by using martingale 3 step. You should use MT2 Trading Platform to connect meta trader platform and binary platform . You can get mt2
Timer remaining to finish the candle. A simple informative indicator of how much time is left until the current candle ends. In a simple, easy and objective way. In the input parameters, enter the desired color of the clock, the font size and the displacement to the right of the candle. I hope I helped with this useful and free tool. Make good use and good business.
Trading Session Indicator The Trading Session Indicator visualizes the high and low points as well as the start and end times of the Asian, London, and New York trading sessions directly on your chart. Features: Visualization of major trading sessions Highlighting of high and low points Display of start and end times for each session Customizable session times User-friendly and efficient Customizability: Each trading session (Asian, London, New York) can be individually customized to match speci
RoundNum Readme (Traders Club)
特徴: このツールはDOWやNIKKEIなど500や1000ポイントがラウンドナンバーの 指数を取引する際に表示するように開発しました。 もちろんメジャー通貨でも表示はされます。
更新頻度を制限しているのでチャート表示が遅くなるということは ありません。
XMでDOWを取引される場合、Main Levelsを10000 Sub Levelsを5000にしてください。
各パラメータの説明: Number to display lines:表示するライン数を設定します。 Main Levels:メインレベルをポイントで指定します。 Main Line Color:メインラインの色を設定します。 Main Line Style:メインラインで使用されるラインを設定します。 Show Sub Lines:サブラインを表示するか設定します。 Sub Levels:サブレベルをポイントで指定します。 Sub Line Color:サブラインの色を設定します。 Sub Line Style:サブライン
This indicator obeys the popular maxim that: "THE TREND IS YOUR FRIEND" It paints a GREEN line for BUY and also paints a RED line for SELL. (you can change the colors). It gives alarms and alerts of all kinds. IT DOES NOT REPAINT and can be used for all currency pairs and timeframes. Yes, as easy and simple as that. Even a newbie can use it to make great and reliable trades. NB: For best results, get my other premium indicators for more powerful and reliable signals. Get them here: https://www.m
Sessions are very important in trading and often good area where to look for setup. In SMC, ICT we will look for Asian session to serve as liquidity
This indicator displays: High & Low of the Asia session Midnight New York time opening line
Congifuration Line Style, color Label position, size, color Start of the level (Start of the day, Start of the session, Highest or Lowest point in the session)
Any questions or comments, send me a direct message here https://www.mql5.com/en/users/mvonl
Este poderoso indicador analisa o gráfico e mostra zonas de Rejeição de Preços! Isto é, locais onde o preço foi, mas não foi aceito pelo mercado! A visualização desta zona de Rejeição, facilita o entendimento do trader na tomada de decisões de onde operar e como operar!
O indicador é composto por 4 linhas, sendo classificadas em 2 grupos: Linhas Vermelha e Amarela: Denotam os extremos onde o preço conseguiu chegar, mas não foi aceito! Linhas Laranja e Azul: A partir delas, denotam o Início da
Donchian Channel is an indicator created by Richard Donchian. It is formed by taking the highest high and the lowest low of the last specified period in candles. The area between high and low is the channel for the chosen period.
Its configuration is simple. It is possible to have the average between the upper and lower lines, plus you have alerts when price hits one side. If you have any questions or find any bugs, please contact me. Enjoy!
Hello friends. I wrote this utility specifically for use in my profile with a large number of Expert Advisors and sets ("Joint_profiles_from_grid_sets" https://www.mql5.com/en/blogs/post/747929 ). Now, in order to limit losses on the account, there is no need to change the "Close_positions_at_percentage_of_loss" parameter on each chart. Just open one additional chart, attach this utility and set the desired percentage for closing all trades on the account. The utility has the following fu
Fair Value Gaps (FVG) and Liquidity Voids are price ranges you can exploit for better entries and exits on your trades. They're similar concepts, so let's look at them from the top and break it down. Think of FVG and Liquidity voids as soft-spots in the market. They are paths of least resistance. That doesn't mean price will go through them, but price could go through them more easily.
To find and locate it is easy but tidiest to repeat the same thing all over again. This helps to boost your
如果产品有任何问题或者您需要在此产品上添加功能,请联系我 Contact/message me if you encounter any issue using the product or need extra feature to add on the base version.
You can get the free Close Button MT4 version at LINK . Close Button provides you an intuitive, effective, and handy way to close your orders and/or positions based on their type and their profit status. The tool provides seven close options: Close All: close all pending orders and positions. Close Profit: close all positions which are in profit. Close
Description : Rainbow MT5 is a technical indicator based on Moving Average with period 34 and very easy to use. When price crosses above MA and MA changes color to green, then this is a signal to buy. When price crosses below MA and MA changes color to red, then this is a signal to sell. The Expert advisor ( Rainbow EA MT5 ) based on Rainbow MT5 indicator is now available here .
MT4 version is available here .
The Donchian Channel Channels are among the most popular tools of technical analysis, as they visually convey to the analyst the limits within which most price movement tends to occur. Channel users know that valuable information can be obtained at any time, whether prices are in the central region of a band or close to one of the border lines.
One of the best known techniques to explore these concepts is Bollinger Bands. However, John Bollinger was not the only one to research the applicatio
Recommended broker to use the indicator: https://tinyurl.com/5ftaha7c Indicator developed by Diogo Sawitzki Cansi to show possible trade points. Do not repaint. The results displayed in the past are exactly what happened. We also use it to hold trades longer and not get out on false reversal signals which are actually just a profit taking of trades and no one is trying to reverse the direction of the trend. Indicator Parameters: PERIOD: Period for analyzing the buying or selling force to fin
Dark Bands is an Indicator for intraday trading. This Indicator is based on Counter Trend strategy but use also Volatility. We can enter in good price with this Indicator, in order to follow the inversions on the current instrument.
Key benefits
Easily visible take profit/stop loss lines Reliable bands lines with futuristic colors, and Intuitive directional arrows Useful statistics , which indicate the win rate of the signals Plus Package available, leave a feedback to receive it for
This indicator is a zero-lag indicator and displays strength of trend change . True Trend Oscillator Pro works best in combination with True Trend Moving Average Pro that displays exact trend as is. Oscillator value is exact price change in given direction of the trend.
True Trend Moving Average Pro: https://www.mql5.com/en/market/product/103586
If you set PERIOD input parameter to 1 this indicator becomes a sharpshooter for binary options.
Developers can use True Trend Oscillator in E
The indicator identifies when a divergence occurs between price and an indicator or oscillator. It identifies both regular and hidden divergences. Combined with your own rules and techniques, this indicator will allow you to create (or enhance) your own powerful system. Features
Can detect divergences for the following oscillators/indicators: MACD, OsMA, Stochastics, RSI, CCI, RVI, Awesome, ADX, ATR, OBV, Composite index, MFI and Momentum. Only one oscillator/indicator can be selected. Draws
The product will copy all telegram signal to MT5 ( which you are member) , also it can work as remote copier. Easy to set up, copy order instant, can work with almost signal formats, image signal, s upport to translate other language to English Work with all type of channel or group, even channel have "Restrict Saving Content", work with multi channel, multi MT5 Work as remote copier: with signal have ticket number, it will copy exactly via ticket number. Support to backtest signal. How to s
Tired of complex order placement and manual calculations? Trade Dashboard is your solution. With its user-friendly interface, placing orders becomes effortless, by a single click, you can open trades, set stop loss and take profit levels, manage trade lot size, and calculate risk to reward ratios, allowing you to only focus on your strategy. Say goodbye to manual calculations and streamline your trading experience with Trade Dashboard. Download Demo Version right now. You can find Details of
Attention: You can view the program operation in the free version YuClusters DEMO . YuClusters is a professional market analysis system. The trader has unique opportunities to analyze the flow of orders, trade volumes, price movements using various charts, profiles, indicators, and graphical objects. YuClusters operates on data based on Time&Sales or ticks information, depending on what is available in the quotes of a financial instrument. YuClusters allows you to build graphs by combining da
-25% discount ($199 -> $149) Advanced trading tool: One click smart orders that execute under your conditions Developed by trader for trading community: position size calculator (lot size), open position after price action, strategy builder, set and forget trading, mobile notifications...
Risk Management - Risk percentage position size calculator, gain percentage, target risk reward ratio, spread and commissions are included in calculations 7 Advanced order types - Set and forget trading w
Attention: this is a multicurrency EA, which trades by several pairs from one chart! Therefore, in order to avoid duplicate trades, it is necessary to attach EA only to one chart, ---> all trading in all pairs is conducted only from one chart! we can trade simultaneously in three different pairs, as by default (EURUSD + GBPUSD + AUDUSD), which take into account the correlation when entering the market for all three; we can trade only EURUSD (or any currency pair) and at the same time take into
Set price targets, and leave everything else to HINN Lazy Trader! This tool is designed for automatic position sizing from specified levels to designated targets. Using a VPS is recommended (*). The demo version limited in functionality, be sure to watch this video before using --> https://youtu.be/geLQ6dUzAr8 A community for users, product discussion, update news, and first line of support are organized in a free Discord: https://discord.gg/zFhEZc7QDQ
Use Webmoney For payments in cryptocu
Cerberus the Equity Watcher はリスク管理ツールであり、アカウントの資産を常に監視し、不完全な EA や裁量的なトレーダーの場合は感情的な行動によって引き起こされる大きなドローダウンを回避します。これは、バグを含む可能性のある EA や、予想外の市況でうまく機能しない可能性のある EA に依存するシステマティック トレーダーにとって非常に役立ちます。 Cerberus では、最小エクイティ値と (オプションで) 最大値を設定できます。これらのいずれかに達すると、すべてのポジションがフラットになり、すべての未決注文がクローズされ、すべての EA が「強制終了」されます。すべての位置を平坦化すると、ユーザーの携帯電話に通知が送信され、画面に明確なメッセージが表示されます。 「平坦化」の後、Cerberus は株式価値を監視し続け、再初期化されるまでそれ以上の取引の試みを停止し続けます。 Cerberus によって実行されるすべての操作は、画面に明確に表示され、Expert advisor タブに報告され、通知がユーザーに送信されます。ユーザーのミスを避けるために、
-25% discount ($149 -> $111) Everything for chart Technical Analysis indicator mt5 in one tool Draw your supply demand zone with rectangle and support resistance with trendline and get alerts to mobile phone or email alert - Risk reward indicator mt5 Video tutorials, manuals, DEMO download here . Find contacts on my profile .
1. Extended rectangles and trendlines Object will be extended to the right edge of the chart when price will draw new candles on chart. This is rectangle extend
Unlimited Trade Copier Pro MT5 is a tool to copy trade remotely to multiple MT4, MT5 and cTrader accounts at different computers/locations over internet. This is an ideal solution for you if you are a signal provider and want to copy your trades to other receivers globally on your own rules. One provider can copy trades to multiple receivers and one receiver can get trade from multiple providers as well. The provider can even set the subscription expiry for each receiver, so that receiver will n
The added video will showcase all functionality, effectiveness, and uses of the trade manager. Drag and Drop Trade Manager. Draw your entry and have the tool calculate the rest. Advanced targeting and close portions of a trade directly available in tool (manage trades while you sleep). Market order or limit order on either side with factored spread. Just draw the entry, the tool does the rest. Hotkey setup to make it simple. Draw where you want to enter, and the stop loss, the tool calculates al
KT Equity Protector EA consistently monitors the account equity and closes all the market and pending orders once the account equity reached a fixed equity stop loss or profit target. After closing all trading positions, the EA can close all open charts to stop other expert advisors from opening more trading positions.
Equity Stop-Loss
If your current account balance is $5000 and you set an equity stop loss at $500. In this case, the KT Equity Protector will close all the active and pending
取引セッションインジケータは、各取引セッションの開始と終了を強調表示します。 セッションの開始/終了をカスタマイズする可能性のあるTrading_Session_Indicator_Pro製品の有料版 >>>
[オプション:] Timeshift - セッションの時間オフセットがある場合に使用します
[パラメータの設定:] Asian session Open=0; Asian session Close=9; Asian session OpenSummertime=1; Asian session CloseSummertime=10; European session Open=8; European session Close=17; European session Open=13; European session Close=22;
市場の私の他のプロダクト https://www.mql5.com/en/users/sky-angel/seller
Highlights trading sessions on the chart
The demo version only works on the AUDNZD chart!!! The full version of the product is available at: (*** to be added ***)
Trading Session Indicator displays the starts and ends of four trading sessions: Pacific, Asian, European and American. the ability to customize the start/end of sessions; the ability to display only selected sessions; works on M1-H2 timeframes;
The following parameters can be configured in the indicator:
TIME_CORRECTION = Cor
Demo version of the Virtual SL TP Trailing product for testing all functions https://www.mql5.com/ru/market/product/75210
ВНИМАНИЕ: ТОЛЬКО ДЛЯ ДЕМО-СЧЕТОВ !!!
Make Trailing Stop, Take Profit, Breakeven, Stop Loss levels invisible to the broker!
HIDDEN MODE (STEALTH MODE) Virtual Trailing Stop (Virtual Trailing Stop) Virtual Take Profit (Virtual Take Profit) Virtual Breakeven (Virtual Breakeven) Virtual Stop Loss (Virtual Stop Loss) Виртуальный 2-уровневый Трейлинг-стоп Virtual
Make your Trailing Stop, Take Profit, Breakeven, and Stop Loss levels invisible to the broker!
STEALTH MODE Virtual Trailing Stop Virtual Take Profit Virtual Breakeven Virtual Stop Loss Virtual 2-levels Trailing Stop Virtual Trailing Take Profit Virtual Lifetime of Orders Setting levels by dragging labels on the chart (Drag&Drop)
TRADING PANEL Operate faster with orders/positions [1] Change Order lot [2] Place BUY order [3] Place SELL order [4] Place BUY LIMIT order [5] Place
取引セッションインジケータは、各取引セッションの開始と終了を強調表示します 。
セッションの開始/終了をカスタマイズする可能性のある Trading_Session_Indicator_Free 製品の有料版。
[オプション:] Asian session Open Asian session Close Asian session OpenSummertime Asian session CloseSummertime European session Open European session Close European session Open European session Close Timeshift
最良の結果を得るには、M15-H2時間枠を使用してください。
時間枠M1、M5の修正を追加しました。 おおよその補正:
Bars Correction ------------------ 23.50 ____ 10 23.54 ____ 5 23.55 ____ 4(5) 00.05 ____ 5(6)
市場の私の他のプロダ
Discount - $110 for the following 5 buyers (2 people left) : Next price: $300
BUX - universal Trading Advisor
Main features of the BUX EA: Optimal set of indicators for signal generation Opening/closing trades on a signal/without a signal, Pending orders Martingale mode (including Dynamic Martingale) Virtual trailing stop (not visible to the broker) Global trailing in the account currency (3 modes + 3 options for calculating the distance)
All the necessary information is in the FAQ .
Ne