• 概要
  • レビュー
  • コメント

Connection Report

This Expert Advisor helps checking the connection of your trade accounts and it generates a report as a CSV file. Disconnections can be caused by trade server or by client terminal.

Many users run their trading EAs on VPS, and this product help them to find out the cause of disconnection - trade server or VPS.

To do that, open 2 client terminals with different brokers on one VPS and run this EA on both 2 terminals for some time. Then you can compare 2 report files from 2 terminals.

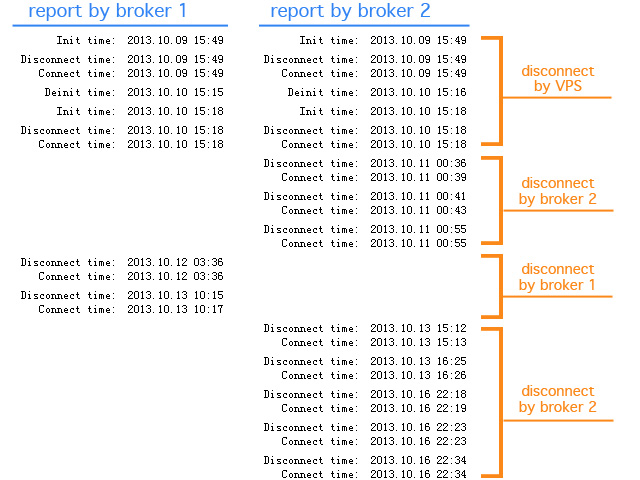
An example is demonstrated on the screenshot. Import the data from 2 report files into Excel, and compare the disconnection time. If the disconnection time is the same, that means that the disconnection is cause by VPS, otherwise the disconnection is cause by the trade server. So you can estimate the connection quality of VPS and trade servers.


おすすめのプロダクト
Was: $249  Now: $99   Market Profile defines a number of day types that can help the trader to determine market behaviour. A key feature is the Value Area, representing the range of price action where 70% of trading took place. Understanding the Value Area can give traders valuable insight into market direction and establish the higher odds trade. It is an excellent addition to any system you may be using. Inspired by Jim Dalton’s book “Mind Over Markets”, this indicator is designed to suit the
プレミアムレベルは、正しい予測の精度が80%を超える独自の指標です。 この指標は、最高のトレーディングスペシャリストによって2か月以上テストされています。 あなたが他のどこにも見つけられない作者の指標! スクリーンショットから、このツールの正確さを自分で確認できます。 1は、1キャンドルの有効期限を持つバイナリーオプションの取引に最適です。 2はすべての通貨ペア、株式、商品、暗号通貨で機能します 手順: 赤い矢印が表示されたらすぐにダウントレードを開き、青い矢印が表示されたら閉じます。青い矢印の後に開くこともできます。 試してテストしてください!推奨設定はデフォルトです! 日足チャートで最高の精度を示します! インディケータは、2600 Pipsの収益性に対して、約10Pipsという非常に小さなマージンを使用します。
トレンドキャッチャー: アラートインジケーター付きのトレンドキャッチャーストラテジーは、市場トレンドやポテンシャルなエントリーポイントやエグジットポイントを特定するのに役立つ多目的な技術分析ツールです。動的なトレンドキャッチャーストラテジーを備えており、市場状況に適応してトレンドの方向を明確に視覚化します。トレーダーは、自身の好みやリスク許容度に合わせてパラメーターをカスタマイズできます。このインジケーターはトレンドの識別を支援し、ポテンシャルなリバーサルをシグナルし、トレイリングストップのメカニズムとして機能し、市場への迅速な対応のためのリアルタイムアラートを提供します。 特徴: - トレンドの識別:上昇トレンドと下降トレンドをシグナルします。 - トレンドのリバーサル:ローソク足の色が上昇から下降に変わった場合やその逆の場合に、ポテンシャルなリバーサルを警告します。 - リアルタイムアラート:新しいトレンドの識別に対するアラートを生成します。 推奨事項: - 通貨ペア:EURUSD、AUDUSD、XAUUSDなど... - タイムフレーム:H1。 - アカウン
FREE
このインジケーターは、チャート上のすべての注文 (トランザクション/注文ラインにクローズ) に対して既に設定した TP および SL 値 (その通貨で) を表示し、すべての注文の利益と損失を見積もるのに大いに役立ちます。また、PIP 値も表示されます。表示されている形式は、「利益または損失の通貨値 / PIP 値」です。 TP 値は緑色で表示され、SL 値は赤色で表示されます。 ご質問や詳細については、fxlife.asia@hotmail.com で販売者にお気軽にお問い合わせください。 (そして、近日中にインジケータに追加される次の機能は、「自動または半自動の TP および SL 設定」であり、お客様は無料で更新バージョンを入手できます。よろしくお願いします。) (または、表示に何か機能を追加すべきだと思われる場合は、お気軽にお申し付けください)
Market Profile Introducing the Market Profile MetaTrader Indicator—your gateway to mastering market dynamics with precision and insight. This powerful tool delivers a classic Market Profile analysis, revealing price density over time and highlighting crucial levels, including the value area and control value for any trading session.  Compatible with timeframes from M1 to D1, it adapts to daily, weekly, monthly, or even intraday sessions, offering you unmatched flexibility. Lower timeframes pro
Горячие клавиши плюс клик левой кнопки мыши на графике. Советник открывает сделки, выставляет лимитные и стоповые ордера, удаляет ордера и закрывает позиции, также  делает реверс  открытых позиций, выставляет прописанные в настройках стоп лосс и тейк профит. (реверс только на неттинговых счетах) При запуске советника можно посмотреть подсказку как действует советник при нажатии клавиши + клик на графике. Правее последнего бара, ниже цены Ctrl+ЛКМ  - OpenSell Правее последнего бара, выше цены
The Penta-O is a 6-point retracement harmonacci pattern which usually precedes big market movements. Penta-O patterns can expand and repaint quite a bit. To make things easier this indicator implements a twist: it waits for a donchian breakout in the right direction before signaling the trade. The end result is an otherwise repainting indicator with a very reliable trading signal. The donchian breakout period is entered as an input. [ Installation Guide | Update Guide | Troubleshooting | FAQ | A
Best SAR MT5
Ashkan Hazegh Nikrou
5 (1)
説明 :  外国為替市場(PSAR)で専門的で人気のあるインジケーターの1つに基づいた新しい無料インジケーターをご紹介します。このインジケーターは元のパラボリックSARインジケーターの新しい変更です。プロSARインジケーターでは、ドットと価格チャートのクロスオーバーを見ることができます。クロスオーバーはシグナルではありませんが、動きの終わりの可能性について話します。新しい青いドットで購入を開始し、最初の青いドットの1 atr前にストップロスを配置し、最後にドットが価格チャートを横切るとすぐに終了できます。 売買シグナルを開く方法は? 最初の青い点によるオープンバイトレードと最初の赤いドットによるオープンセルトレード 正しいストップロスはどこにありますか? 安全なストップロスは最初のドットにある可能性があります(最初の青いドットの買いの場合と最初の赤い点の売りの場合) 正しいテイクプロフィットはどこにありますか? テイクプロフィットはストップロス距離とRRに基づいて調整できるので、私の提案は2 RRで、ストップロスの2倍です。 利益を上げているのにtpを達成でき
FREE
数列の一つに「森林火災数列」があります。これは、最も美しい新しいシーケンスの 1 つとして認識されています。その主な特徴は、このシーケンスが線形トレンドを回避することです。最短のものであってもです。この指標の基礎を形成したのはこのプロパティです。 財務時系列を分析する場合、この指標は可能なすべての傾向オプションを拒否しようとします。そして失敗した場合にのみ、トレンドの存在を認識し、適切なシグナルを発します。このアプローチにより、新しいトレンドの始まりの瞬間を正しく判断できます。ただし、偽陽性の可能性もあります。それらの数を減らすために、このインジケーターに追加のフィルターが追加されました。新しいバーが開くとシグナルが生成されます。いずれの場合も再描画は発生しません。 指標パラメータ: Applied Price   - 適用価格定数; Period Main   - インディケータのメイン期間、その有効な値は 5 ~ 60 です。 Period Additional   - 追加の期間。このパラメーターの有効な値は 5 ~ 40 です。 Signal Filter   - 追加の信号
Your Trend Friend
Luigi Nunes Labigalini
5 (1)
The trend is your friend! Look at the color of the indicator and trade on that direction. It does not  repaint. After each candle is closed, that's the color of the trend. You can focus on shorter faster trends or major trends, just test what's most suitable for the symbol and timeframe you trade. Simply change the "Length" parameter and the indicator will automatically adapt. You can also change the color, thickness and style of the lines. Download and give it a try! There are big movements
Upgraded - Stars added to indentify Areas you can scale in to compound on your entry  when buying or selling version 2.4 Upgraded Notifications and alerts added version 2.3 *The indicator is suitable for all pairs fromm  Deriv pairs (Vix,jump,boom & crash indices) , Currencies, cryptos , stocks(USA100, USA30 ), and metals like gold etc. How does it work? Increasing the period make it more stable hence will only focus on important entry points However  lowering the period will mean the indica
| Fully-automated Smart Money Concept (ICT) inspired trading solution with multi-strategy capabilities | Built by a grid trader >> for grid traders.  This is MT5 version, click  here  for  Blue CARA MT4  (settings and logics are same in both versions)     Real monitoring signal  -->  Cara Gold Intro Blue CARA EA   ('CARA') - short for  C omprehensive  A lgorithmic   R esponsive   A dvisor is a next-gen  multi-currency    multi-timeframe  EA base on the widely known (and perhaps the most popul
Free automatic Fibonacci is an indicator that automatically plots a Fibonacci retracement based on the number of bars you select on the BarsToScan setting in the indicator. The Fibonacci is automatically updated in real time as new highest and lowest values appears amongst the selected bars. You can select which level values to be displayed in the indicator settings. You can also select the color of the levels thus enabling the trader to be able to attach the indicator several times with differe
FREE
Please backtest with the exact balance of your live account before applying to real money. ==> If account balance is too low it may not trade at all! For MT4 version please contact via private message. martingale version is available here . Strategy description - Detect trend based on EMA18-EMA50-SMA200 alignment in three time frames: M15, H1, H4 - Trade in trend direction and exit when above alignment is broken. - The bot is tuned to trade XAUUSD(Gold). - The bot output is break even in rangi
FREE
インディケータは現在のクオートを作成し、これを過去のものと比較して、これに基づいて価格変動予測を行います。インジケータには、目的の日付にすばやく移動するためのテキスト フィールドがあります。 オプション: シンボル - インジケーターが表示するシンボルの選択; SymbolPeriod - 指標がデータを取る期間の選択; IndicatorColor - インジケータの色; HorisontalShift - 指定されたバー数だけインディケータによって描画されたクオートのシフト; Inverse - true は引用符を逆にします。false - 元のビュー。 ChartVerticalShiftStep - チャートを垂直方向にシフトします (キーボードの上下矢印)。 次は日付を入力できるテキストフィールドの設定で、「Enter」を押すとすぐにジャンプできます。
Noize Absorption Index - is the manual trading system that measures the difference of pressure between bears forces and bulls forces. Green line - is a noize free index that showing curent situation. Zero value of index shows totally choppy/flat market.Values above zero level shows how powerfull bullish wave is and values below zero measures bearish forces.Up arrow appears on bearish market when it's ready to reverse, dn arrow appears on weak bullish market, as a result of reverse expectation.
Point Black
Ignacio Agustin Mene Franco
Black Card Pack indicator 5/1 point black It has the strategy of professional bollingers where each arrow gives you a different entry signal. It is used to operate in m1 and in d1 It is used for scalping and intraday, modified for forex markets ! suitable for all pairs modified for synthetic index markets suitable for all pairs! Ideal for volatility and jumps!
MT4版  |  FAQ Owl Smart Levels Indicator は、 Bill Williams の高度なフラクタル、市場の正しい波構造を構築する Valable ZigZag、エントリの正確なレベルをマークする Fibonacci レベルなどの一般的な市場分析ツールを含む 1 つのインジケーター内の完全な取引システムです。 利益を得るために市場と場所に。 戦略の詳細な説明 インジケータを操作するための指示 顧問-取引助手 プライベートユーザーチャット ->購入後に私に書いて、私はプライベートチャットにあなたを追加し、あなたはそこにすべてのボーナスをダウンロードすることができます 力はシンプルさにあります! Owl Smart Levels 取引システムは非常に使いやすいので、専門家にも、市場を勉強し始めて自分で取引戦略を選択し始めたばかりの人にも適しています。 戦略と指標に秘密の数式や計算方法が隠されているわけではなく、すべての戦略指標は公開されています。 Owl Smart Levels を使用すると、取引を開始するためのシグナルをすばやく確認し、注文を出すため
Gyroscope        professional forex expert   (for EURUSD, GBPUSD, USDJPY, AUDUSD, USDCHF, EURGBP, EURJPY, NZDUSD, USDCAD, EURCHF, AUDJPY, CADJPY pairs)   alyzing the market using the Elliot Wave Index. Elliott wave theory is the interpretation of processes in financial markets through a system of visual models (waves) on price charts. The author of the theory, Ralph Elliott, identified eight variants of alternating waves (of which five are in the trend and three are against the trend). The mo
Before installing the HeatMap indicator make sure you are using a broker that gives you access to the Depth of market (DOM) !! This indicator creates a heatmap on your chart allowing you to see the buy or sell limit orders easily and in real time. You have the possibility to change the setting and the colors of the HeatMap in order to adapt to all markets and all charts. Here is an example of a setting you can use with the NASDAQ100 on the AMPGlobal broker :  https://www.youtube.com/watch?v=x0
Awesome Oscillator by Bill Williams with the ability to fine-tune and replace the averaging algorithms of the indicator, which significantly expands the possibilities of using this oscillator in algorithmic trading and brings it closer in its properties to such an indicator as the MACD. To reduce price noise, the final indicator is processed with an additional Smooth averaging. The indicator has the ability to give alerts, send mail messages and push signals when the direction of movement of th
KT Renko Patterns scans the Renko chart brick by brick to find some famous chart patterns that are frequently used by traders across the various financial markets. Compared to the time-based charts, patterns based trading is easier and more evident on Renko charts due to their uncluttered appearance. KT Renko Patterns features multiple Renko patterns, and many of these patterns are extensively explained in the book titled Profitable Trading with Renko Charts by Prashant Shah. A 100% automate
Crash 1000 Scalping Indicator for the Crash 1000 Deriv Synthetic Index. Introduction The Crash 1000 Scalping Indicator is a specialized tool designed for the Crash 1000 index on the Deriv Synthetic market. This indicator is particularly useful for scalping on the M1 timeframe, helping traders to identify precise entry and exit points for buy positions. It is designed to be non-repainting, providing clear signals with audible alerts and push notifications, and is compatible with mobile devices th
Order Book, known also as Market Book, market depth, Level 2, - is a dynamically updated table with current volumes of orders to buy and to sell specific financial instument at price levels near Bid and Ask. MetaTrader 5 provides the means for receiving market book from your broker, but in real time only, without access to its history. The indicator OrderBook Cumulative Indicator accumulates market book data online and visualizes them on the chart. In addition, the indicator can show the market
This indicator draws strong price levels (price consolidation levels). The levels are plotted using 2 MA indicators and 1 MACD using a complex algorithm. The algorithm used in the EA is also in personal use.  These levels have 4 variants (colors of the variants can be customized): strong up, weak up, strong down, weak down. In turn, a weak level usually appears and then it can become strong. A strong level can also become weak. Version MT4:  https://www.mql5.com/en/market/product/27997/ Versio
Cumulative delta indicator As most traders believe, the price moves under the pressure of market buying or selling. When someone redeems an offer standing in the cup, the deal is a "buy". If someone pours into the bid standing in the cup - the deal goes with the direction of "sale". The delta is the difference between purchases and sales. A cumulative delta - the difference between the cumulative sum of purchases and sales for a certain period of time. It allows you to see who is currently contr
SolarTrade Suite 金融ロボット: LaunchPad Market Expert - 取引を開始するために設計されています! これは、革新的で高度なアルゴリズムを使用して値を計算する取引ロボットであり、金融​​市場の世界でのアシスタントです。 SolarTrade Suite シリーズのインジケーター セットを使用して、このロボットを起動するタイミングをより適切に選択してください。 説明の下部にある SolarTrade Suite シリーズの他の製品をご覧ください。 投資と金融市場の世界を自信を持ってナビゲートしたいですか? SolarTrade Suite 金融ロボット: LaunchPad Market Expert は、情報に基づいた投資決定を行い、利益を増やすのに役立つ革新的なソフトウェアです。 SolarTrade Suite 金融ロボット: LaunchPad Market Expert の利点: - 正確な計算: 当社のロボットは、高度なアルゴリズムと分析方法を使用して、市場の動きを正確に予測します。 資産を売買するのに最適
Terra Infinity is a flat indicator. This improved version of the CalcFlat indicator has three additional lines that significantly increase its effectiveness. Unlike its predecessor with two static levels, Terra Infinity adds three dynamic lines above the main histogram, which are interpreted as follows: base signal line, minimum signal line, maximum signal line. These lines are formed using the additional parameter Avg, which is the average value of the histogram. Averaging produces a line
Matrix Arrow EA MT5
Juvenille Emperor Limited
5 (5)
マトリックスアローEAMT4 は、 マトリックスアローインジケーターのMT5 シグナルをチャート上のトレードパネルと手動または100%自動でトレードできるユニークなエキスパートアドバイザーです。 マトリックスアローインジケーターMT5 は、初期段階で現在のトレンドを判断し、最大10の標準インジケーターから情報とデータを収集します。 平均方向移動指数(ADX) 商品チャネルインデックス(CCI) クラシック平研アシキャンドル 移動平均 移動平均収束発散(MACD) 相対活力指数(RVI) 相対力指数(RSI) 放物線SAR ストキャスティクス ウィリアムズのパーセント範囲 すべてのインジケーターが有効な買いまたは売りシグナルを与えると、対応する矢印がチャートに印刷され、次のろうそく/バーの開始時に強い上昇トレンド/下降トレンドを示します。ユーザーは、使用するインジケーターを選択し、各インジケーターのパラメーターを個別に調整できます。   Matrix Arrow EA MT5 を使用すると、チャートのトレードパネルから直接、または100%アルゴリズム取引オプションを使用して100%自動
まず第一に、この取引インジケーターは再描画されず、再描画されず、遅延しないことを強調する価値があります。これにより、手動取引とロボット取引の両方に理想的なものになります。 ユーザーマニュアル:設定、入力、戦略。 アトミックアナリストは、価格の強さとモメンタムを利用して市場でより良いエッジを見つけるためのPA価格アクションインジケーターです。ノイズや誤ったシグナルを除去し、取引ポテンシャルを高めるための高度なフィルターを備えています。複雑なインジケーターの複数のレイヤーを使用して、アトミックアナリストはチャートをスキャンし、複雑な数学的計算をシンプルなシグナルと色に変換します。これにより、どのような初心者トレーダーでも理解して使用し、一貫した取引の決定を行うことができます。 「アトミックアナリスト」は、新規および経験豊富なトレーダー向けにカスタマイズされた包括的な取引ソリューションです。プレミアムインジケーターとトップノッチの機能を1つの取引戦略に組み合わせ、すべてのタイプのトレーダーにとって汎用性のある選択肢にします。 デイリートレーディングとスキャルピング戦略:高速で正確な
このプロダクトを購入した人は以下も購入しています
Trade Assistant MT5
Evgeniy Kravchenko
4.38 (164)
取引 ごとのリスクの 計算、新規注文 の 簡単 な 設置、部分的 な 決済機能 を 持 つ 注文管理、 7 種類 のトレーリングストップなど 、便利 な 機能 を 備 えています 。 注意、アプリケーションはストラテジーテスターでは機能しません。 説明ページからデモ版をダウンロードできます  Manual, Description, Download demo ライン機能 チャート上にオープニングライン、ストップロス、テイクプロフィットを表示します。この機能により、新規注文を簡単に設定することができ、注文を出す前にその特徴を確認することができます。   リスク計算 リスク計算機能は、設定されたリスクとストップロス注文のサイズを考慮して、新規注文のボリュームを計算します。ストップロスの大きさを自由に設定できると同時に、設定したリスクを守ることができます。 Lot calc ボタン - リスク 計算 を 有効 / 無効 にします 。 Risk フィールドでは 、必要 なリスクの 値 を 0 から 100 までのパーセンテージまたは 預金通貨 で 設定 します 。 設定」 タブで 、
価格が一瞬で変わる可能性のある市場では、注文はできるだけ簡単にすべきだと思いますか? Metatraderでは、注文を開くたびに、開始価格を入力し、損失を止めて利益を得るウィンドウと、取引サイズを開く必要があります。金融市場の取引では、初期預金を維持し、それを増やすために資本管理が不可欠です。それで、あなたが注文をしたいとき、あなたはおそらくあなたがどれくらいの大きさの取引を開くべきか疑問に思いますか?この単一の取引であなたの預金の何パーセントを危険にさらすべきですか?この取引からどれだけの利益を得ることができますか?また、リスクに対する利益の比率はどのくらいですか?トレードサイズを設定する前に、トレードサイズがどうあるべきかという質問に対する答えを得るために必要な計算を行います。 これらすべてを自動的に行うツールがあると想像してみてください。チャートを開き、市場分析を行い、エントリーポイント、ディフェンスポイント(ストップロス)、ターゲット(テイクプロフィット)を水平線でマークし、最後にリスクのレベルを定義します。利用可能な資本の%として、このトランザクションで負担することができ、こ
TradePanel MT5
Alfiya Fazylova
4.85 (114)
Trade Panel は、多機能の取引アシスタントです。 このアプリケーションには手動取引用の 50 以上の機能が含まれており、ほとんどの取引アクションを自動化できます。 購入する前に、デモ アカウントでデモ バージョンをテストできます。 デモは こちら から。 詳しい手順は こちら をご覧ください。 取引。 ワンクリックで基本的な取引操作を実行できます。 未決の注文とポジションをオープンする 注文のグリッドを開く 未決の注文とポジションを決済する ポジションの反転(買いを閉じて売りをオープンする、または売りを閉じて買いをオープンする) ポジションをロックする(反対のポジションをオープンすることで、売りポジションと買いポジションの量を等しくします) すべてのポジションを部分的に決済します。 すべてのポジションのテイクプロフィットやストップロスを共通のレベルに設定します。 すべてのポジションのストップロスを損益分岐点レベルに設定します。 注文とポジションをオープンする際に、次のことが可能になります。 確立されたリスクに応じて取引量の自動計算を使用します。 ワンクリックで複数の注文を開き
Local Trade Copier EA MT5
Juvenille Emperor Limited
4.99 (68)
Local Trade Copier EA MT5 による、驚くほど高速な取引コピーを体験してください。1分で簡単にセットアップできるこの取引コピー機は、同じWindowsコンピュータまたはWindows VPS上の複数のMetaTrader端末間で取引をコピーすることができ、0.5秒未満の高速コピースピードを実現します。 初心者であろうとプロのトレーダーであろうと、 Local Trade Copier EA MT5 には、あなたの特定のニーズに合わせてカスタマイズするための幅広いオプションが用意されています。これは、利益の可能性を高めたい人にとって究極のソリューションです。 今すぐ試してみて、これが市場で最も速くて簡単なトレードコピー機である理由を理解してください。 ヒント: デモアカウントで Local Trade Copier EA MT5 デモバージョンをダウンロードして試すことができます: ここ ダウンロードした無料のデモ ファイルを MT5 >> ファイル >> データ フォルダを開く >> MQL5 >> Experts フォルダに貼り付けて、ターミナルを再起動し
The product will copy all telegram signal to MT5 ( which you are member) , also it can work as remote copier.  Easy to set up, copy order instant, can work with almost signal formats, image signal,  s upport to translate other language to English Work with all type of channel or group, even channel have "Restrict Saving Content", work with  multi channel, multi MT5 Work as remote copier: with signal have ticket number, it will copy exactly via ticket number. Support to backtest signal. How to s
あなたがメンバーである任意のチャネルから(プライベートおよび制限されたものを含む)シグナルを直接あなたのMT5にコピーします。  このツールは、トレードを管理し監視するために必要な多くの機能を提供しながら、ユーザーを考慮して設計されています。 この製品は使いやすく、視覚的に魅力的なグラフィカルインターフェースで提供されています。設定をカスタマイズして、数分で製品を使用を開始できます! ユーザーガイド + デモ  | MT4版 | Discord版 デモを試してみたい場合は、ユーザーガイドにアクセスしてください。 Telegram To MT5 受信機は、ストラテジーテスターで動作しません! Telegram To MT5の特徴 複数のチャネルから一度にシグナルをコピー プライベートおよび制限されたチャネルからシグナルをコピー BotトークンまたはChat IDは必要ありません   (必要に応じて使用することができます) リスク%または固定ロットを使用して取引 特定のシンボルを除外 すべてのシグナルをコピーするか、コピーするシグナルをカスタマイズするかを選択 すべてのシグナ
Tired of complex order placement and manual calculations? Trade Dashboard is your solution. With its user-friendly interface, placing orders becomes effortless, by a single click, you can open trades, set stop loss and take profit levels, manage trade lot size, and calculate risk to reward ratios, allowing you to only focus on your strategy. Say goodbye to manual calculations and streamline your trading experience with Trade Dashboard. Download  Demo Version  right now. You can find  Details of
MT5 to Telegram Signal Provider は、Telegramのチャット、チャンネル、またはグループに 指定された シグナルを送信することができる、完全にカスタマイズ可能な簡単なユーティリティです。これにより、あなたのアカウントは シグナルプロバイダー になります。 競合する製品とは異なり、DLLのインポートは使用していません。 [ デモ ] [ マニュアル ] [ MT4版 ] [ Discord版 ] [ Telegramチャンネル ] セットアップ ステップバイステップの ユーザーガイド が利用可能です。 Telegram APIの知識は必要ありません。必要な全ては開発者から提供されます。 主な特長 購読者に送信する注文の詳細をカスタマイズする機能 例えば、Bronze、Silver、Goldといった階層型のサブスクリプションモデルを作成できます。Goldサブスクリプションでは、すべてのシグナルが提供されます。 id、シンボル、またはコメントによって注文をフィルターできます 注文が実行されたチャートのスクリーンショットが含まれます 追加の
MT5のトレードコピー機は、МetaТrader5プラットフォームのトレードコピー機です 。 それは間の 外国為替取引をコピーします   任意のは 、MT5 - MT5、MT4 - MT5   COPYLOT MT5版の アカウント (またはを MT4 - MT4   MT5 - MT4   COPYLOT MT4版用) 信頼できるコピー機! MT4のバージョン 完全な説明   +DEMO +PDF 購入する方法 インストールする方法     ログファイルの取得方法     テストと最適化の方法     Expforex のすべての製品 МТ4ターミナルでトレードをコピーすることもできます(   МТ4   -   МТ4、МТ5   -   МТ4   ):   MT4のCOPYLOT CLIENT このバージョンには、端末間 МТ5   -   МТ5、МТ4   -   МТ5が含まれ ます。 ディールコピー機は、2/3/10端末間でディール/ポジションをコピーするために作成されます。 デモ口座と投資口座からのコピーがサポートされています。 プログラムは、複数の端末
Attention: this is a multicurrency EA, which trades by several pairs from one chart!  Therefore, in order to avoid duplicate trades, it is necessary to attach EA only to one chart, ---> all trading in all pairs is conducted only from one chart! we can trade simultaneously in three different pairs, as by default (EURUSD + GBPUSD + AUDUSD), which take into account the correlation when entering the market for all three; we can trade only EURUSD (or any currency pair) and at the same time take into
Hedge Ninja
Robert Mathias Bernt Larsson
5 (1)
Make sure to join our Discord community over at www.Robertsfx.com , you can also buy the EA at robertsfx.com WIN NO MATTER IN WHICH DIRECTION THE PRICE MOVES This robot wins no matter in which direction the price moves by following changing direction depending on in which direction price moves. This is the most free way of trading to this date. So you win no matter which direction it moves (when price moves to either of the red lines as seen on the screenshot, it wins with the profit target yo
YuClusters
Yury Kulikov
4.93 (41)
Attention: You can view the program operation in the free version  YuClusters DEMO .  YuClusters is a professional market analysis system. The trader has unique opportunities to analyze the flow of orders, trade volumes, price movements using various charts, profiles, indicators, and graphical objects. YuClusters operates on data based on Time&Sales or ticks information, depending on what is available in the quotes of a financial instrument. YuClusters allows you to build graphs by combining da
Trade copier MT5
Alfiya Fazylova
4.44 (25)
Trade Copierは、取引口座間の取引をコピーして同期するように設計された専門的なユーティリティです。 コピーは、同じコンピューターまたはvps にインストールされている、サプライヤーのアカウント/端末から受信者のアカウント/端末に行われます。 購入する前に、デモ アカウントでデモ バージョンをテストできます。 デモ版 こちら 。 詳細な説明は こちら 。 主な機能と利点: MT5ネッティングアカウントを含む、MT5> MT5、MT4> MT5、MT5> MT4のコピーをサポートします。 高いコピー速度(0.5秒未満)。 ベンダーモードと受信者モードは同じ製品内に実装されています。 チャートから直接リアルタイムでコピーを制御できる、簡単で直感的なインターフェイス。 接続が切断されたり、端末が再起動されたりしても、設定と位置が失われることはありません。 コピーするシンボルを選択できます。また、受信者のシンボルを置き換えることもできます(例:EURUSD> USDJPY)。 バックコピーをサポートします。 特定の注文のみのコピーを有効にする機能。 取引開始価格の最大差と最大遅延時間を
Trade Manager は、リスクを自動的に計算しながら、取引を迅速に開始および終了するのに役立ちます。 過剰取引、復讐取引、感情的な取引を防止する機能が含まれています。 取引は自動的に管理され、アカウントのパフォーマンス指標はグラフで視覚化できます。 これらの機能により、このパネルはすべてのマニュアル トレーダーにとって理想的なものとなり、MetaTrader 5 プラットフォームの強化に役立ちます。多言語サポート。 MT4バージョン  |  ユーザーガイド + デモ Trade Manager はストラテジー テスターでは機能しません。 デモについてはユーザーガイドをご覧ください。 危機管理 % または $ に基づくリスクの自動調整 固定ロットサイズを使用するか、ボリュームとピップに基づいた自動ロットサイズ計算を使用するオプション RR、Pips、または価格を使用した損益分岐点ストップロス設定トレーリングストップロス設定 目標に達したときにすべての取引を自動的に終了するための 1 日あたりの最大損失 (%)。 過度のドローダウンからアカウントを保護し、オーバートレードを防ぎます
-25% discount ($199 -> $149) Advanced trading tool: One click smart orders that execute under your conditions Developed by trader for trading community:  position size calculator (lot size), open position after price action, strategy builder, set and forget trading, mobile notifications... Risk Management -  Risk percentage position size calculator, gain percentage, target risk reward ratio, spread and commissions are included in calculations 7 Advanced order types  - Set and forget trading w
Set price targets, and leave everything else to HINN Lazy Trader! This tool is designed for automatic position sizing from specified levels to designated targets. Using a VPS is recommended (*). The demo version   limited in functionality, be sure to watch this video before using -->  https://youtu.be/geLQ6dUzAr8 A community for users, product discussion, update news, and first line of support are organized in a free Discord: https://discord.gg/zFhEZc7QDQ Use Webmoney For payments in cryptocu
ニュースイベントの洞察でトレードを強化 トレードの世界では、ニュースイベントが市場価格に大きな影響を与えることがあります。これらのイベントが価格変動にどのように影響するかを理解することは、ボラティリティの高い時期にトレードを管理するために重要です。News Tool EA は、過去および今後のニュースイベントに関する洞察を提供し、情報に基づいたトレードの意思決定を支援します。 このEAは、ストラテジーテスターでは実行できません。 ユーザーガイド 主な機能: 歴史的影響分析 過去の特定のニュースイベントに対して価格変動がどのように反応したかを理解します。イベントがしばしば強気または弱気のトレンドに従うかを分析し、調整可能な時間枠でポイントまたはパーセンテージの平均価格影響を表示します。ビジュアルグラフを使用して、ニュースイベントと価格反応を並べて観察し、より深い市場の洞察を得ることができます。 リアルタイムニュースの統合 MT5内で直接、今後のニュースイベントのライブアップデートを受け取ります。特定のイベントや重要度レベルに対するアラートを設定し、通貨や関連性でイベントをフィルタ
Mentfx Mmanage mt5
Anton Jere Calmes
4.25 (8)
The added video will showcase all functionality, effectiveness, and uses of the trade manager. Drag and Drop Trade Manager. Draw your entry and have the tool calculate the rest. Advanced targeting and close portions of a trade directly available in tool (manage trades while you sleep). Market order or limit order on either side with factored spread. Just draw the entry, the tool does the rest. Hotkey setup to make it simple. Draw where you want to enter, and the stop loss, the tool calculates al
Trade Assistant 38 in 1
Makarii Gubaydullin
4.89 (18)
多機能ツール 搭載機能: ロット計算機、プライスアクション、リスク/リワードレシオ、トレードマネージャー、需要供給ゾーンなどをはじめ65以上の機能。 バージョ:デモ版   |   ユーザーマニュアル   |    MT5版 このユーティリティはストラテジー テスターでは機能しません。 ここからデモ   バージョンをダウンロードして製品をテストできます。 ご不明な点や改善提案、バグの発見などございましたら、 連絡してください 。 取引プロセスを簡素化、高速化、自動化します。このダッシュボードで標準端末機能を拡張します 1. 新しい取引を開始します : ロット / リスク / RR の計算 1. Lot計算機(リスクサイズに基づく取引量計算 2. リスク計算機(ロットサイズに基づくリスク量) 3. リスク/リワードレシオ (R/R) 4. 注文のアクティベーション トリガー + Buy StopLimit / Sell StopLimit 5. 仮想 SL / TP レベル (隠しSL、TP: ブローカーには見えない) 6.  Smart SL / エントリー レベル: バ
この製品は、ニュースタイム中にすべてのエキスパートアドバイザーと手動チャートをフィルタリングするため、急激な価格変動によるマニュアルトレードのセットアップの破壊や他のエキスパートアドバイザーによって入力された取引について心配する必要はありません。この製品には、ニュースのリリース前にオープンポジションとペンディングオーダーを処理できる完全な注文管理システムも付属しています。 The News Filter  を購入すると、将来のエキスパートアドバイザーのためにビルトインのニュースフィルターに頼る必要はなく、今後はすべてのエキスパートアドバイザーをここからフィルタリングできます。 ニュース選択 ニュースソースは、Forex Factoryの経済カレンダーから取得されます。 USD、EUR、GBP、JPY、AUD、CAD、CHF、NZD、CNYなど、任意の通貨数に基づいて選択できます。 Non-Farm(NFP)、FOMC、CPIなどのキーワード識別に基づいて選択することもできます。 影響レベルによってフィルタリングするニュースを選択することができ、低、中、高の影響範囲から選択できます
ワンクリックで取引できるトレーディングパネル。ポジションと注文の操作!チャートまたはキーボードから取引。 当社の取引パネルを使用すると、チャートから直接シングルクリックで取引を実行でき、標準の MetaTrader コントロールよりも 30 倍高速に取引操作を実行できます。 パラメータと関数の自動計算により、トレーダーにとって取引がより速く、より便利になります。 グラフィックのヒント、情報ラベル、取引取引に関する完全な情報はチャート MetaTrader にあります。 MT4のバージョン 完全な説明   +DEMO +PDF 購入する方法 インストールする方法     ログファイルの取得方法     テストと最適化の方法     Expforex のすべての製品 手動取引用の取引パネル。チャート(チャートウィンドウ)またはキーボードから取引できます。  開閉、リバース、ロックポジションと注文を処理する МetaТrader5 のメインオーダーのトレーディングコントロールパネル:売買、売却、売却、売却、売却、閉じる、削除、修正、トレーリングストップ、ストップロス、takep
ATTENTION the expert does not work in strategy tester, for a trial version visit my profile. Manual RiskGuard Management   RiskGuard management was born with the idea of ​​helping traders from their initial journey to becoming expert and aware traders. Compatible with any operating system whether Mac or Windows. The operations panel is integrated into the graph giving the possibility to choose size and position between right and left, while the various buttons light up when they can be used,
Adam FTMO MT5
Vyacheslav Izvarin
5 (2)
ADAM EA Special Version for FTMO Please use ShowInfo= false for backtesting ! Our 1st EA created using ChatGPT technology Trade only GOOD and checked PROP FIRMS  Default parameters for Challenge $100,000 Tested on EURUSD and GBPUSD only  Use 15MIN Time Frame Close all deals and Auto-trading  before Weekend at 12:00 GMT+3  Friday For Prop Firms MUST use special Protector  https://www.mql5.com/en/market/product/94362 -------------------------------------------------------------------------------
Grid Manual MT5
Alfiya Fazylova
4.87 (15)
「Grid Manual」は、注文のグリッドを操作するための取引パネルです。 ユーティリティはユニバーサルで、柔軟な設定と直感的なインターフェイスを備えています。 それは、損失を平均化する方向だけでなく、利益を増やす方向でも注文のグリッドで機能します。 トレーダーは注文のグリッドを作成して維持する必要はありません。 すべてが「Grid Manual」によって行われます。 注文を開くだけで十分であり、「Grid Manual」は注文のグリッドを自動的に作成し、非常に閉じるまでそれに付随します。 完全な説明とデモバージョン ここ。 ユーティリティの主な機能と機能 ユーティリティは、モバイル端末から開かれた注文を含め、あらゆる方法で開かれた注文を処理します。 「制限」と「停止」の2種類のグリッドで機能します。 グリッド間隔の計算には、固定と動的(ATRインジケーターに基づく)の2つの方法で機能します。 オープンオーダーグリッドの設定を変更できます。 チャート上の各注文グリッドの損益分岐点を表示します。 各注文グリッドの利益率を表示します。 ワンクリックでグリッドから収益性の高い注文を閉じるこ
Cerberus Equity Watcher
Samuel Bandi Roccatello
5 (2)
Cerberus the Equity Watcher はリスク管理ツールであり、アカウントの資産を常に監視し、不完全な EA や裁量的なトレーダーの場合は感情的な行動によって引き起こされる大きなドローダウンを回避します。これは、バグを含む可能性のある EA や、予想外の市況でうまく機能しない可能性のある EA に依存するシステマティック トレーダーにとって非常に役立ちます。 Cerberus では、最小エクイティ値と (オプションで) 最大値を設定できます。これらのいずれかに達すると、すべてのポジションがフラットになり、すべての未決注文がクローズされ、すべての EA が「強制終了」されます。すべての位置を平坦化すると、ユーザーの携帯電話に通知が送信され、画面に明確なメッセージが表示されます。 「平坦化」の後、Cerberus は株式価値を監視し続け、再初期化されるまでそれ以上の取引の試みを停止し続けます。 Cerberus によって実行されるすべての操作は、画面に明確に表示され、Expert advisor タブに報告され、通知がユーザーに送信されます。ユーザーのミスを避けるために、
-25% discount ($149 -> $111) Everything for chart Technical Analysis indicator mt5 in one tool Draw your supply demand zone with rectangle and support resistance with trendline and get alerts to mobile phone or email alert -  Risk reward indicator mt5 Video tutorials, manuals, DEMO download   here .   Find contacts on my   profile . 1.   Extended rectangles and trendlines Object will be extended to the right edge of the chart when price will draw new candles on chart. This is rectangle extend
The top-selling EAs on the market cost a lot and one day they are suddenly gone. This is because one strategy will not work in the forex market all the time. Our product is unique from all others in the MQL Marketplace because our EA comes with 34+ built-in indicators that allow develop strategies every time.  You build your strategy and keep updating it. If one strategy does not work, simply build another all using only one EA. This is All-In-One EA   in this market place. You can use as trade
Unlimited Trade Copier Pro MT5 is a tool to copy trade remotely to multiple MT4, MT5 and cTrader accounts at different computers/locations over internet. This is an ideal solution for you if you are a signal provider and want to copy your trades to other receivers globally on your own rules. One provider can copy trades to multiple receivers and one receiver can get trade from multiple providers as well. The provider can even set the subscription expiry for each receiver, so that receiver will n
UTM Manager は、迅速かつ効率的な取引執行を提供する直感的で使いやすいツールです。際立った機能の 1 つは、「スプレッドを無視」モードです。これにより、スプレッドを完全に無視して、ローソク足の価格で取引できるようになります (たとえば、LTF でより高いスプレッドのペアを取引でき、スプレッドによって取引から除外されるのを回避できます)。 UTM Manager のもう 1 つの重要な側面は、独自のローカル取引コピー機であり、各ブローカーで異なる取引戦略と設定 (たとえば、さまざまな TP、BE、およびリスク ルール) を柔軟に実行できます。 取引執行: 迅速かつ効率的な取引執行: チャート上のエントリー価格とストップロス価格をクリックして簡単に取引を入力するか、ワンクリックの固定ストップロスサイズ機能を使用します。 自動ロットサイズ計算: ロットは事前定義されたリスク設定に基づいて計算され、ドラッグによってポジションが変更されると再計算されます。 1 つまたは複数のポジションを同時に処理できる能力。 利益確定と損益分岐点: 柔軟なテイクプロフィット設定: 特定のリスク対報
Profit or Loss Pad
Vladislav Andruschenko
4.5 (10)
利益追跡機能で総利益/損失に達したときにMetaTrader5のポジションをクローズします。   CloseIfProfitorLoss with Trailing 仮想停止(個別注文)を 有効にできます。 買いポジションと売りポジションを別々に 計算して閉じる(別々の買い売り)、 すべてのシンボルまたは現在のシンボルのみを 閉じて計算する(すべてのシンボル)、 利益のためにトレーリングを有効にする( トレーリング 利益) ポジションは、預金通貨、ポイント、%、およびドローダウンの 値に基づいてクローズされます。 このアプリケーションは、他のEAと一緒に、または手動取引と組み合わせて、任意のアカウントで使用するように設計されています。 MT4のバージョン 完全な説明   +DEMO +PDF 購入する方法 インストールする方法     ログファイルの取得方法     テストと最適化の方法     Expforex のすべての製品 一部またはすべてのペアの貿易収支の合計が設定で指定された値以上になるとすぐに、すべてのポジションがクローズされ、注文が削除されます。 このバージ
作者のその他のプロダクト
。。。。。。。。。。。。。。。。。。。。。。。。。。。。。。。。。。。。。。。。。。。 This indicator is based on Bollinger Bands indicator. It helps user clearly know the Band is expand or contract. The method of use is the same as the traditional Brin channel index. Users can use different color areas to distribute forest channel indicators in expansion or contraction stage. -------------------------------------------------------------------------------------------
FREE
Reverse TradeCopier for Followers   can copy trades from an account that is running Reverse TradeCopier Source . Features: Copies trades from one source (master) account to multiple following (slave) accounts. Allows investor (read only) password for source (master) account. There are no complicated settings and input parameters, everything is easy. Works with different brokers. Works with different quotes symbols (EURUSD_FX, eurusd_m, etc.). Can copy orders from 4-digit quotes platform to 5-dig
Reverse TradeCopier for Followers can copy trades from an account that is running   Reverse TradeCopier for Source . Features: Copies trades from one source (master) account to multiple following (slave) accounts. Allow investor (read only) password for source (master) account. There are no complicated settings and input parameters, everything is easy. Works with different brokers. Works with different quotes symbols (EURUSD_FX, eurusd_m, etc.). Can copy orders from 4-digit quotes platform to 5-
FREE
If you want something as below: Sell FOREX trading signal. Manage multiple accounts. Follow the trading from somebody. "TradeCopier_follow" and   "TradeCopier_source"   can help you! Features: Copying from one source (master) account to multiple follower (slave) accounts. Allow investor (read only) password for the source (master) account. There are no complicated settings and input parameters, everything is easy. Works with different Brokers. Works with different symbols (EURUSD_FX, eurusd_m, e
FREE
The Synchronized Charts script allows comparing bars of different symbols or different periods of the same symbol. Attach the script to a chart and move bars or change the scale, all opened chart will move synchronously with the current one. The bars on different charts aligned to the border according to their open time. Please be sure the relevant history datas have been downloaded before synchronize charts. 。。。。。。。。。。。。。。。。。。。。。。。。。。。。。。。。。。。。。。。。。。。。。。。。。。
This product is used to check the foreign exchange market history datas. Good quality historical datas is important for traders to perform market analysis or back testing. But the quality of historical datas provided by various foreign exchange brokers is uneven. Sometimes we notice missing k-line sequences, but sometimes it is not easy to detect them. This product helps users locate these missing locations.If there are many gaps in a given period of time on a chart, you need to be careful about
Some trading strategies are suitable for the quiet market with less volatility, while others are suitable for the volatile and violent market. Either way, traders should have a clear measure of how hot or cold the market is. This product is convenient for traders to compare the degree of cold heat of different trading varieties, or the trading heat of the same trading variety in different time periods. You can put it on different charts to get the intuition. It's easy to see which is more hot an
This indicator is used to indicate the difference between the highest and lowest prices of the K line, as well as the difference between the closing price and the opening price, so that traders can visually see the length of the K line. The number above is the difference between High and Low, and the number below is the difference between Close and Open. This indicator provides filtering function, and users can only select K lines that meet the criteria, such as positive line or negative
Some traders don't like expose Take Profit/Stop Loss level in their positions, this Expert Advisor can help them. Put it to chart and set Take Profit/Stop Loss pips (0 means ignore), it watch the price of the symbol on chart and close the position if price reach Hidden TP/SL level. It hide user's TP/SL price in effect. Welcome to contact me. 。。。。。。。。。。。。。。。。。。。。。。。。。。。。。
This script allows traders to easily close positions if their profit/loss reaches or exceeds a value specified in pips. The script allows users to easily close positions if their profit/loss reaches or exceeds a value specified in pips. Please set slippage value first. Sometimes some positions do not close due to high volatility of the market. Please set larger slippage or restart the script. ..............................................................................................
Script to Delete Pending Orders Sometimes you placed many Pending Orders and then you want delete certain kind of these orders, this script can help you! Usage: Download and drag and drop this script to the chart. Check "Allow AutoTrading" in "Common" tab and set input parameters in "Inputs" tab. Input Parameters: TypeOfPending: which type Order you would delete. mySymbol: which Symbol you would delete. The input format of the Symbol is such as "EURUSD" or "eurusd".
The script allows to easily watch the date and time of several cities selected by the user from more than 30 important cities all over the world. It also shows GMT, Server time and Local time. The cities on the screen are automatically sorted by the date and time. You can save your setting on the Inputs tab and use them in future. Notice: Daylight saving time is not considered.
Some trading strategies are suitable for the quiet market with less volatility, while others are suitable for the volatile and violent market. Either way, traders should have a clear measure of how hot or cold the market is. This product is convenient for traders to compare the degree of cold heat of different trading varieties, or the trading heat of the same trading variety in different time periods. You can put it on different charts to get the intuition. It's easy to see which is more hot an
Painting Deals on active chart. It allows analyzing trade history on an account to which you have an investor (read only) password. Type of the arrow displayed indicated the deal type: Right Arrow means In and In/Out deals Arrow Left Left means Out deals. Blue arrows are for Buy deals and Red arrows are for Sell deals. The indicator displays deals in the real time mode, it also displays their Stop Loss and Take Profit levels. Put the mouse over the arrows to see the details of deals including op
The script shows statistics of trades for the specified period. For example, if you want to know the details of trades of the ATC2010 Winner ( bobsley ): Login with his account using the investor (read-only) password (MetaTrader5); Open the chart of his trading symbol (EURUSD); Run this script on the chart; Specify 2010.10.1 in "date from", and the diagram will be shown.
The Synchronized Charts script allows comparing bars of different symbols or different periods of the same symbol. Attach the script to a chart and move bars or change the scale, all opened charts will move synchronously with the current one. The bars on different charts aligned to the border according to their open time. Please be sure the relevant history datas have been downloaded before synchronize charts.
This script allows traders to easily close positions if their profit/loss reaches or exceeds a value specified in pips. The script allows users to easily close positions if their profit/loss reaches or exceeds a value specified in pips. Please set slippage value first. Sometimes some positions do not close due to high volatility of the market. Please set larger slippage or restart the script. ............................................................................................
This script notifies a user about different events by playing sounds, sending emails and text messages to a mobile device. The following events are supported: New deals (in/in out/out). Expiration of Pending orders. The terminal disconnected. The terminal or the script closed. Please set a notification type for each event separately. If you need notifications via Email, please make sure that the settings on the Email tab are correct. If you need to receive notifications on a mobile device, pleas
This script alerts a user via sounds and alert box at the end of a countdown. It is like an alarm clock. There are 2 ways to start counting down: Set a value of remaining minutes. Example: if you need an alert after 1 hour, set it to 60. Set countdown end time. If you like to use a custom sound for the alert, copy your sound files to "terminal_path\Sounds" folder and set the exact file name in the input parameters. The sound file must be in *.wav format.
This product is used to check the foreign exchange market history datas. Good quality historical datas is important for traders to perform market analysis or back testing. But the quality of historical datas provided by various foreign exchange brokers is uneven. Sometimes we notice missing k-line sequences, but sometimes it is not easy to detect them. This product helps users locate these missing locations.If there are many gaps in a given period of time on a chart, you need to be careful about
This is a trend indicator, as you can see here. When the white line is above the red, it means a bull market. Conversely, the white line below the red line is a bear market. This index is suitable for long - term trading and is suitable for most trading varieties. --------------------------------------------------------------------------------------------
This indicator let user clearly see Buy/Sell signals. When a bar is closed and conditions meet, arrow signal will come up at Close Price, up is Buy and down is Sell. It works on all Timeframes. And you can set sound alert when signals come up.
This indicator is used to compare the relative strength of the trade on the chart against the other several selected symbols. By comparing the price movement of each traded variety based on the same base day, several trend lines of different directions can be seen, reflecting the strong and weak relationship between the several different traded varieties, so that we can have a clearer understanding of the market trend. For example, you can apply this indicator on a EurUSD chart and compare it
.................................. This script is intended to help users to get information about ticks and spreads (e.g. ticks count, minimum/maximum/average spread). It can export reports in the CSV format with this information. Traders can see spread statistics in real time in the chart window It is useful for comparing spreads of different brokers. --------------------------------------------------------------------------
This is visualization tool based on the Depth of Market. It works with the symbols that have the Depth of Market available. It's a visual indicator that shows the volume of each Bid/Ask price and ratio of total volume of Bids/Asks. Note: check if your broker supports DOM before purchasing. 。。。。。。。。。。。。。。。。。。。。。。。。。。。。。。。。。。。。。。。。。。。。。。。。。。。 。。。。。。。。。。。。。。。。。。。。。。。。。。。。。。。。。。。。。。。。。。。。。。。。。。。
This indicator is used to compare the relative strength of the trade on the chart against the other two selected symbols. By comparing the price movement of each traded variety based on the same base day, three trend lines of different directions can be seen, reflecting the strong and weak relationship between the three different traded varieties, so that we can have a clearer understanding of the market trend. For example, you can apply this indicator on a EurUSD chart and compare it with curre
Most time the market is in a small oscillation amplitude. The Trade Area indicator helps users to recognize that time. There are 5 lines in this indicator: Area_high, Area_middle, Area_Low, SL_high and SL_low. Recommendations: When price is between Area_high and Area_Low, it's time to trade. Buy at Area_Low level and sell at Area_high level. The SL_high and SL_low lines are the levels for Stop Loss. Change the Deviations parameter to adjust SL_high and SL_low.
This indicator is used to indicate the difference between the highest and lowest prices of the K line, as well as the difference between the closing price and the opening price, so that traders can visually see the length of the K line. The number above is the difference between High and Low, and the number below is the difference between Close and Open. This indicator provides filtering function, and users can only select K lines that meet the criteria, such as positive line or negative line.
This script allows you to compare quotes and spreads from different trading servers or brokers to identify a server/broker that offers the best bid/ask price and the tightest spread. It can be compared with up to six different servers or brokers at a time, and it is easy to find the best quote provider by score. Usage: Open up to 6 MetaTrader client terminals, login to different servers/brokers, and then start the script on each terminal's chart.
This is a multi-currency paired trading system.I won't go into the details of how it works, but what the user needs to care about is how it actually works. It is highly recommended that you download the product and test it thoroughly, including back testing with the historical data and foward testing in the simulated account. As this EA trades multiple currency pairs, relevant historical data will be automatically downloaded at the first time of its historical review, with data volume around 6GB
フィルタ:
レビューなし
レビューに返信