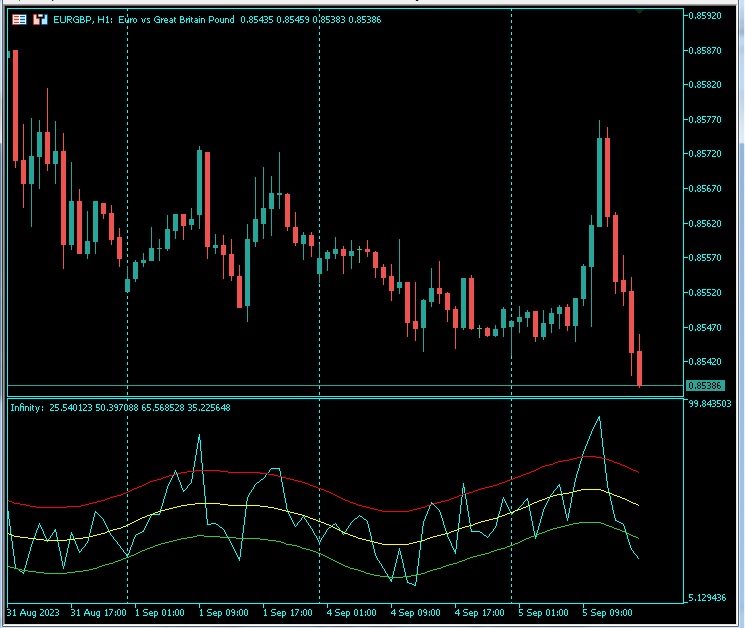
Infinity Indicator MT5
- インディケータ
- Luiz Felipe De Oliveira Caldas
- バージョン: 1.0
- アクティベーション: 20
Infinity Indicator MT5 1.0
| Panel Asset | Rate % |
|---|---|
| EURUSD | 96.0% |
| GBPUSD | 94.1% |
| AUDCAD | 90.5% |
| USDCHF | 87.8% |
| BTCUSD | 78.4% |
- Panel Win Rate based on CandleMT4
- Exit Button
- Calculates the StdDev standard deviation indicator on the RSI data, stored in the matrix similar to the keltner.
- input int HourCalculate = 12;
- RsiLength = 5;
- RsiPrice = PRICE_CLOSE;
- HalfLength = 4;
- DevPeriod = 100;
- Deviations = 0.9;
- UseAlert = true;
- DrawArrows = true;
- TimerWork=300;
- LevelUp = 80;
- LevelDown = 20;
- MoreSignals = true;