Audusd and Nzdusd Hedge Strategy
- インディケータ
- GEORGIOS VERGAKIS
- バージョン: 5.0
- アップデート済み: 29 12月 2023
- アクティベーション: 6
Caution! This indicator is mainly for investors and medium term traders, Day-trading is not possible! This is because correlation is a medium to long term thing. Ideal use of this indicator is for currency Option sellers, where they can deploy sure fire profiable Option selling over few days to several weeks out. We provide further advice on this plus an optional hedge strategy idea and indicator on long time rentals*.
This indicator keeps performing very well, in all market conditions, making it extremely difficult to get trapped on the wrong side of the market
and only has temporarily open losing trades when timing is bad, and final real winning trades. In addition, it has some unique ultra accurate signals occuring on daily and weekly charts, few times a year.
An indicator with an incredible edge in detecting one type of bounding condition, one where the forward trade is bound to reverse!
No other indicator in the market does this!
Forward trade = long AUDUSD & short NZDUSD
Reverse trade = short AUDUSD & long NZDUSD
This indicator comes with complete support and version updates, for example one client requested custom made version with email alerts and additional training and guidance, which we delivered over several months.
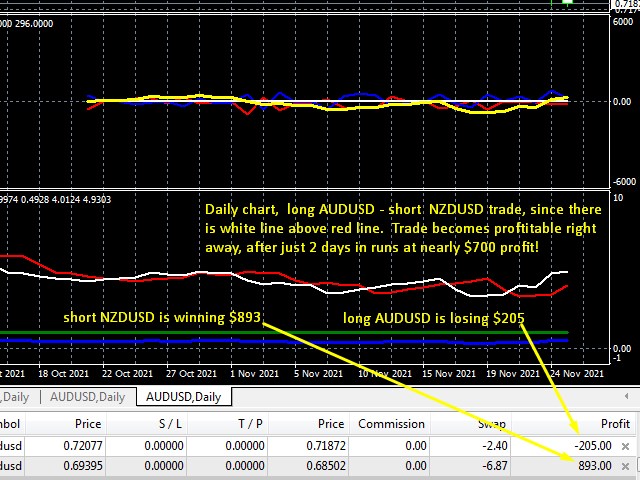
In these strategies we trade the combined trend, we trade AUDUSD and NZDUSD at the same time, and yet one of them will usually be a losing trade and the other will be a winner, and often we don't know which will be which. NO classic forex strategy is this profitable! The only catch is that you need more capital than classic strategies. It's far better than classic forex, Binaries, or Cryptos. Of course is not the only 2 pair strategy, but it is one of the best. Before this one we used to test the GOLD vs USDJPY strategy (inverse markets)
This is for large account traders seeking low stress/risk trading!
This strategy is quite safe, there's no need to worry about stops getting triggered, the trade is self protected against sudden movements, since one trade offsets the other. The indicator takes care of the directional bias, sooner or later some trend may develop.
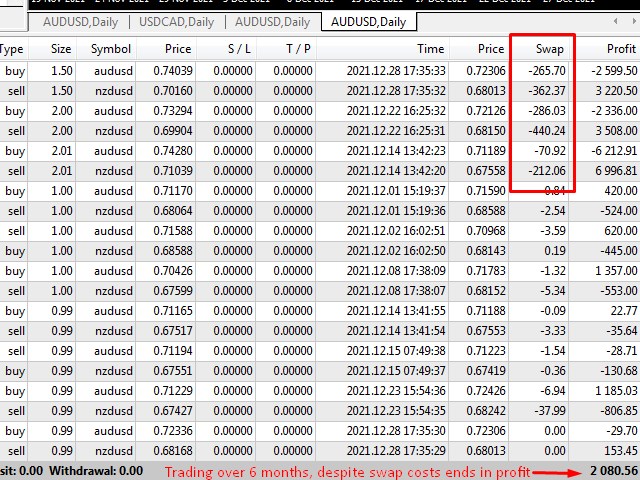
This strategy requires more capital to implement than classic trading. Nonetheless, it can make many $1000s per year, on a medium size account. Risk is significantly lower! Typical profitability is few $100s per week, at one lot size. More specifically, in actual demo tests over 6 months, this strategy was able to turn a $50K demo account into $225K, trading in relaxed mode, just once per day, on trades lasting few days each. When the trend of the 2 pairs changed against us, we were able to get out at small loss, typically at a $150-$300 loss, then catching the new trend right away for a profit in the range of $400 to $1500.
How to use:
Drop the indicator on either AUDUSD or NZDUSD chart, or any other chart, it will work. Please read through the instructions.
also on the sam chart use the free trading tool to see what a trade would look like
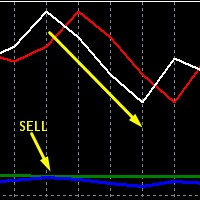
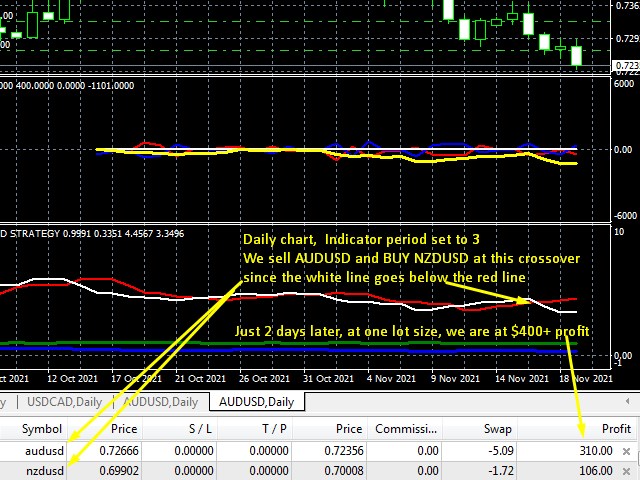
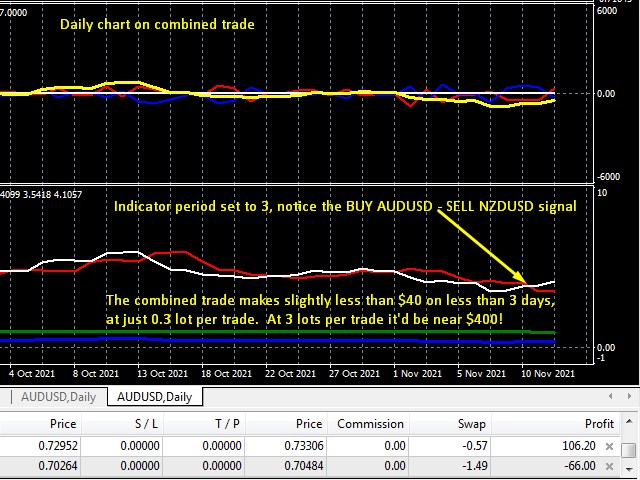
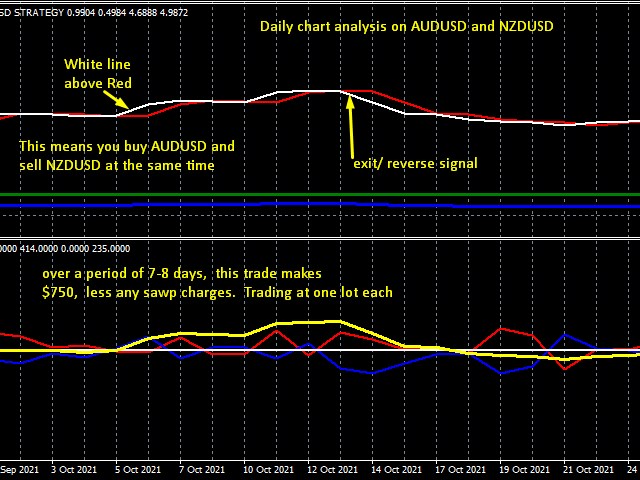
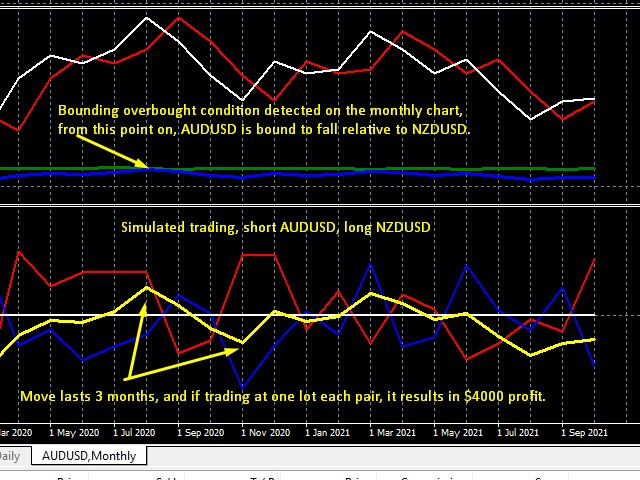
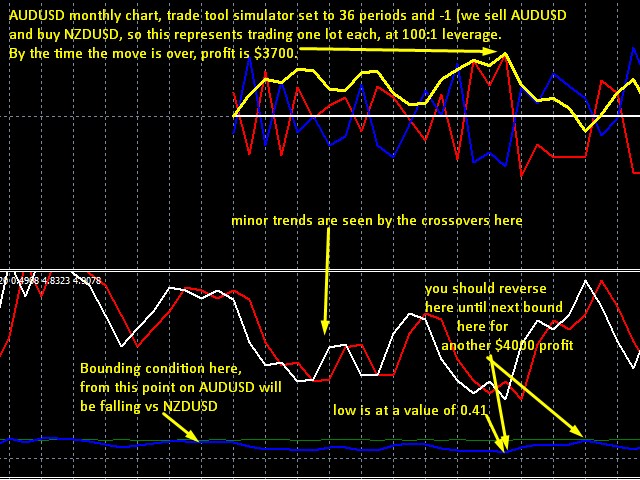
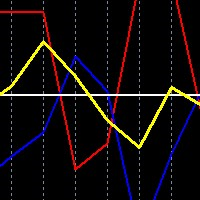
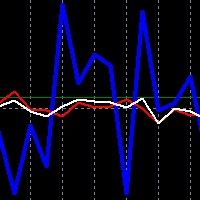
The indicator does just that, it detects the directional component in 2 phases, first ti detects the momentum based component, which si apparent in all time frames. If the white line is aboe the red line, then you have to buy AUDUSD and SELL NZDUSD. If the White line is below the Red line you have to sell AUDUSD and buy NZDUSD. No stops are required, since further risks on one pair are offset by the opposing trade in the other currency pair.
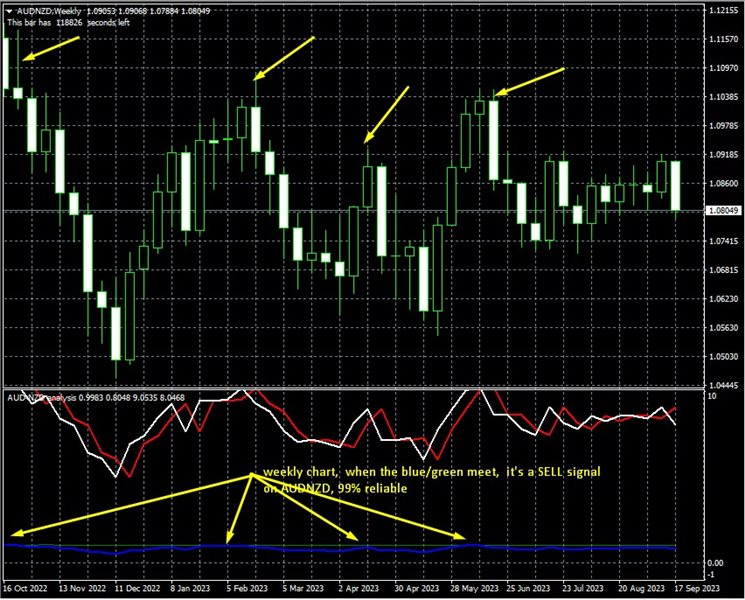
On the second, more long term phase (weekly and monthly charts only), the indicator does something incredible, it can detect bounding conditions when the long AUDUSD short NZDUSD is totally exhausted, and there's no chance of going further, which means the trend will reverse you have to SELL AUDUSD, and BUY NZDUSD. This is incredibly accurate! And it is detected when the blue line approaches the value of 1, which is almost always at the Green line. This is something which is impossible to do in single pair trading! As you know with indicators such as RSI, overbought can become more overbought, whereas here with these 2 pairs, when a bounding condition occurs, it is really overbought and cannot go any further, that is what a bounding condition is.
The reverse is not possible, we cannot detect bounding conditions when the said trade is oversold, we can only approximate oversold levels on the Blueline, based on previous lows.
All in all, the White and Red lines are a kind of momentum indicator, but because we are trading 2 pairs, the underlying combined trend is much smoother than trading any single currency pair on its own. That being said, it is possible for this momentum function to repaint. Whereas the weekly and monthly bounding overbought conditions, is an indication which happens few times over the year, but is so solid, we have never seen it repaint, or give nonsense.
#hedge trading, #corrolation hedge, #directionless trading, #hedge fund method, #pairs trading
