Flex Channel MT4
- インディケータ
- Aleksandrs Butrims
- バージョン: 1.0
- アクティベーション: 5
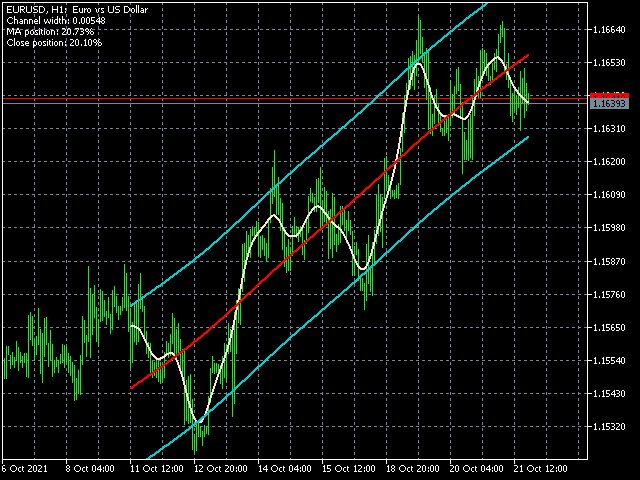
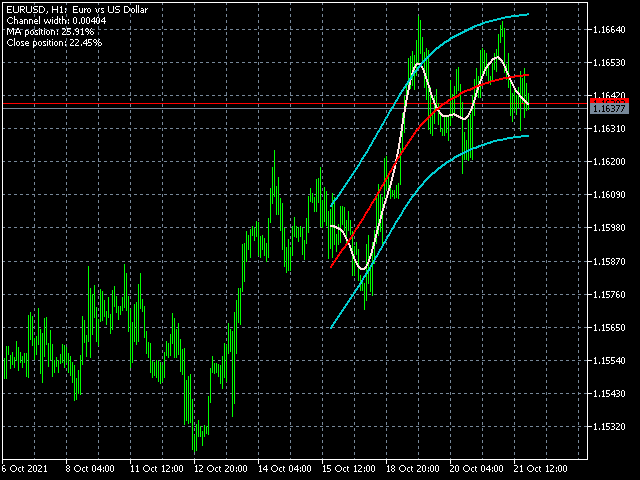
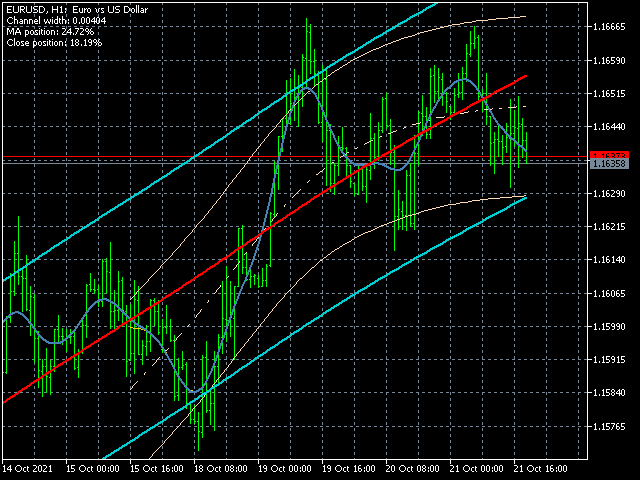
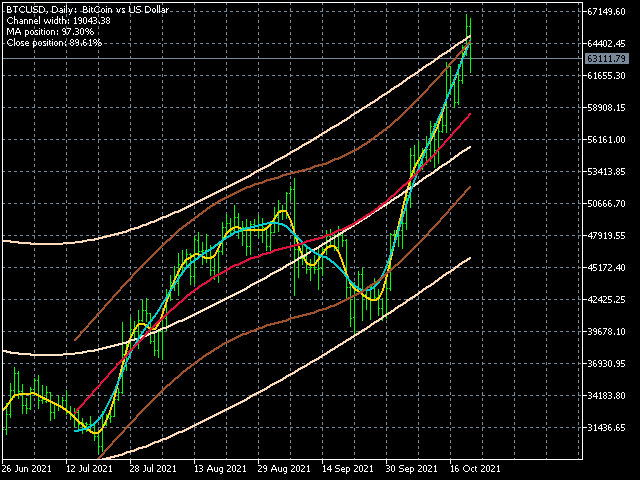
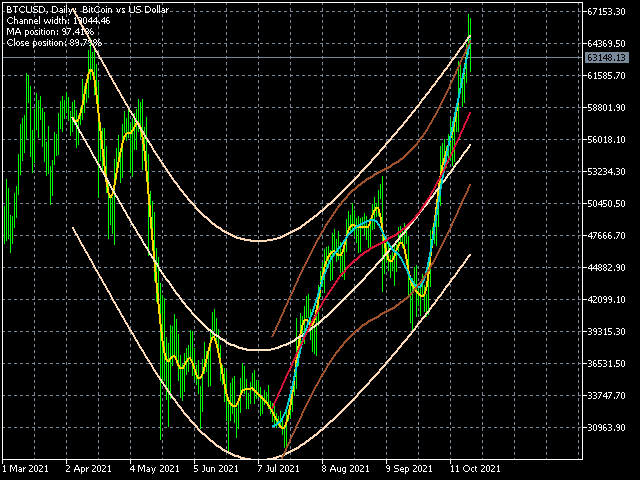
Flex channel - indicator plots channel using Hodrick-Prescott filter. Hodrick-Prescott filter is the method of avreaging time series to remove its cycling componets and shows trend.
Settings
- HP Fast Period - number of bars to calculate fast moving average
- HP Slow Period - number of bars to calculate slow moving average
Additional information in the indicator
- Channel width - channel width in pips at first bar
- MA position - fast moving average position in the channel in persentage
- Close position - Close price position in the channel in persentage