• 概要
  • レビュー (18)
  • コメント (28)
  • 最新情報

Auto Orderblock with Break of Structure MT5

4.64

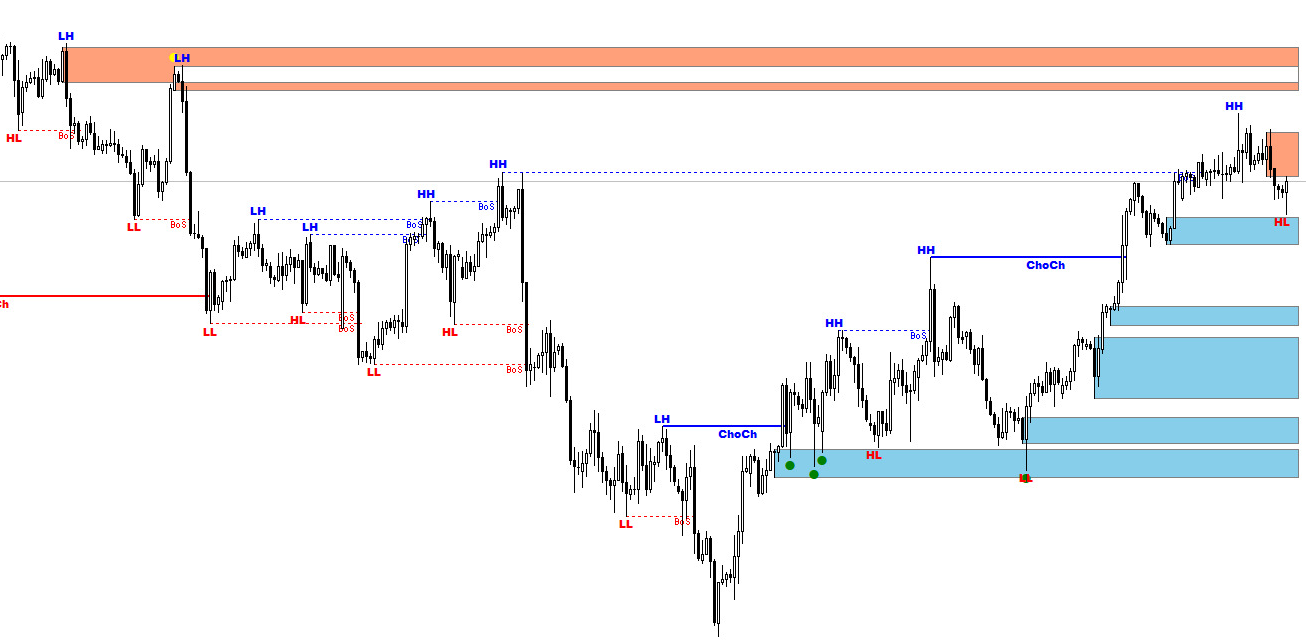
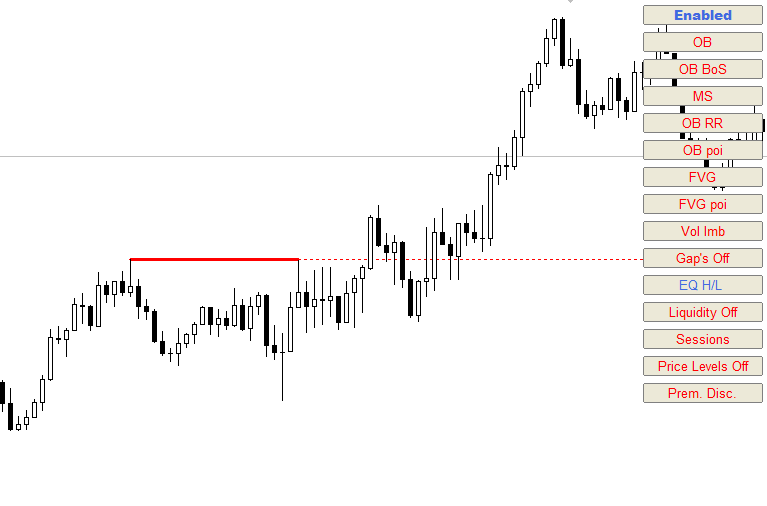
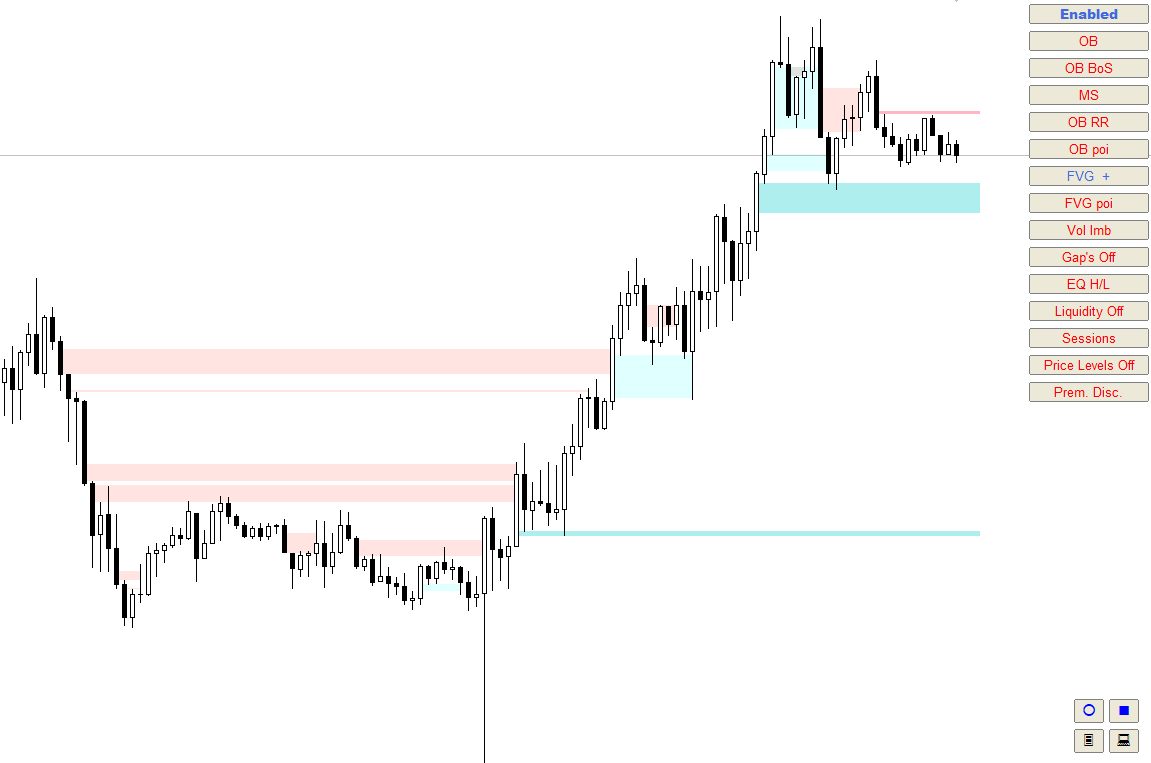
Auto Order Block with break of structure based on ICT and Smart Money Concepts (SMC)

Futures

  • Break of Structure ( BoS )           
  • Order block ( OB )          
  • Higher time frame Order block / Point of Interest ( POI )   shown on current chart          
  • Fair value Gap ( FVG ) / Imbalance   -  MTF     ( Multi Time Frame )   
  • HH/LL/HL/LH  -  MTF     ( Multi Time Frame ) 
  • Choch  MTF     ( Multi Time Frame ) 
  • Volume Imbalance    ,  MTF          vIMB
  • Gap’s
  • Equal High / Low’s     ,  MTF             EQH / EQL
  • Liquidity             
    • Current Day High / Low           HOD / LOD
    • Previous Day High / Low          PDH + PDL
    • Current Week High / Low        HOW / LOW
    • Previous Week High / Low       PWH / PWL
    • Current Month High / Low       HOM / LOM
    • Previous Month High / Low      PMH / PML
    • Previous Day Close                    PDC 
    • Previous Week Close                 PWC 
    • Previous Month Close               PMC
    • Daily Open
    • Weekly Open
  • Premium / Discount - MTF     ( Multi Time Frame ) 
    • Sessions             
      • Asian , London and NY sessions
      • Kill Zone
      • Silver Bullet
    • Alerts
      • BoS Alerts
      • New OB Formed Alerts
      • New High / Low Formed Alerts
      • OB touched Alerts
      • OB  and  POI touch alerts
      • Fair value Gap ( FVG )/ Imbalance touch Alerts
      • Equal High / Low Alerts
      • Liquidity touch Alerts


    Manual Link


    MT 4 Version


    Orderblock's for Android phones


    Other Indicators


    レビュー 18
    TradeBizz
    20
    TradeBizz 2023.12.13 13:19 
     

    Very nice indicator!! I love it. It gets better and better with update after update! Good job

    Kitomi09
    153
    Kitomi09 2023.09.07 08:17 
     

    For ICT students if you're a fan of the Judas swing strategy this indicator is absolutely perfect. The only comment I would say is, instead of the "50% entry" appearing once the orderblock has been touched could you additionally have the option to already have it set for whenever the orderblock appears

    Thapelo Steven Agus
    181
    Thapelo Steven Agus 2023.08.22 15:51 
     

    Thank you so much Barend for this exceptional indicator. It is really making my life easier since I’m automating my trades using Expert Advisor. Kudos to you for the excellent work! Any chance you could add POI touch markers as well? That will be very helpful. Once again, thank you for this awesome indicator.

    UPDATE: Hi Barend. Thank you very much for adding the POI touch markers on version 3.7 as per my request. I honestly appreciate that. If it is not much of a hassle, would you kindly change the labeling to POI_mark_bear_xx/POI_mark_bull_xx? The labeling is the same as the OB markers.

    UPDATE: Thanks Barend for making all the requested changes. I really appreciate it. You are the best!

    おすすめのプロダクト
    Hunt markets with Hunttern ZigZag . Easy to use with one parameter    You can use it for the following:       -Classic patterns       -Heads and shoulders       -Harmonic patterns       -Elliott Wave       -Support and resistance       -Supply and Demand Single parameter:      -Period (1-120) Features:        -Candle time        -Single parameter        -Light mode template This is version 1 of Hunttern ZigZag. We are very happy to receive feedback from you.
    FREE
    Introduction to Smart Renko The main characteristics of Renko Charting concern price movement. To give you some idea on its working principle, Renko chart is constructed by placing a brick over or below when the price make the movement beyond a predefined range, called brick height. Therefore, naturally one can see clear price movement with less noise than other charting type. Renko charting can provide much clearer trend direction and it helps to identify important support and resistance level
    A professional tool for trading - the divergence indicator between the WPR and the price, which allows you to receive a signal about a trend reversal in a timely manner or catch price pullback movements (depending on the settings). The indicator settings allow you to adjust the strength of the divergence due to the angle of the WPR peaks and the percentage change in price, which makes it possible to fine-tune the signal strength. The indicator code is optimized and is tested very quickly as par
    FREE
    基本的なRenkoインディケータは、明確で簡潔な相場観を求めるトレーダーにとって強力なツールです。当社のインディケータは、トレンドの視覚化を簡素化するだけでなく、反転の正確なアラートを提供し、あなたの取引に戦略的な優位性を提供します /  MT4無料版 特徴 フルカスタマイズ可能:   高度なカスタマイズオプションにより、インジケーターをお好みに合わせてカスタマイズできます。色からボックスサイズ設定まで、チャート上の情報表示方法を完全にコントロールできます。 反転アラート:   反転アラートで、市場の方向性が変化する可能性をいち早く知ることができます。これにより、利益を最大化し、損失を最小化するために、情報に基づいたタイムリーな意思決定を行うことができます。 入力項目 Size of the boxes:   ボックスサイズ(ポイントベース) Bullish box colour:   強気ボックスの色 Bearish box colour:   弱気ボックスの色 Box opacity:   不透明度(0から100の間)。不透明度が低くなるにつれて透明度が高くなる
    FREE
    Fibo Expertt
    Ignacio Agustin Mene Franco
    Fibo expert! It is an automatic fibonacci indicator. adapting to any temporality, to catch those rebounds, or the path of that trend, special to make longs in H1 or H4 clear the trend, but it also works for scalp in m1 up to m15 works for all forex pairs and for all pairs of synthetic indices, ideal for volatility 75 in synthetics no more to enjoy good profit World Investor.
    Free automatic Fibonacci is an indicator that automatically plots a Fibonacci retracement based on the number of bars you select on the BarsToScan setting in the indicator. The Fibonacci is automatically updated in real time as new highest and lowest values appears amongst the selected bars. You can select which level values to be displayed in the indicator settings. You can also select the color of the levels thus enabling the trader to be able to attach the indicator several times with differe
    FREE
    A professional tool for trading - the divergence indicator between the  RVI and the price, which allows you to receive a signal about a trend reversal in a timely manner or catch price pullback movements (depending on the settings). The indicator settings allow you to adjust the strength of the divergence due to the angle of the  RVI peaks and the percentage change in price, which makes it possible to fine-tune the signal strength. The indicator code is optimized and is tested very quickly as p
    FREE
    This is the demo version of "All Harmonics 26" indicator . "All Harmonics 26" searches for 26 types of harmonic patterns and outputs them in a convenient way. You can check out the documentation here . This demo version has the following limitations: The indicator searches only for one type of harmonic patterns out of 26:- Gartley. The indicator outputs new patterns with a lag of 10 bars.
    FREE
    Renko Plus
    Eadvisors Software Inc.
    With Renko Plus you can use the features in the Indicator functionality, just add it to the Metatrader5 chart.             The Renko chart is a type of chart, developed by the Japanese, that is constructed using price movement rather than standardized prices and time intervals like most charts. It is believed to be named after the Japanese word for bricks, "renga", as the graphic looks like a series of bricks.             A new brick is created when the price moves a specified p
    Simple Weis Wave
    Jean Jacques Huve Ribeiro
    4.2 (5)
    One of the best tools for analyzing volume, Weis Wave was idelized by David Weis, to facilitate the reading of directional flow. For the VSA method disciples it is an evolution of the practices created by Richard Wycoff, facilitating a predictive reading of the market, always seeking an accumulation and distribution of the negotiated contracts. Cumulative wave volume  Range of wave ( removed) Average Wave volume Ref "Tim Ord lectures" ( removed)
    FREE
    Weis Wave Double Side Alert
    Eduardo Da Costa Custodio Santos
    The Weis Wave Bouble Side Indicator for MT5 is part of the toolkit (Wyckoff Academy Wave Market) The Weis Wave Bouble side Indicator for MT5 was created based on the already established Weis Wave created by David Weis. The Weis Wave Double Side indicator reads the market in waves as R. Wyckoff did in 1900. It helps in the identification of effort x result, cause and effect, and Supply and demand Its differential is that it can be used below the zero axis and has a breakout alert showing Who is s
    The idea of the system is to indentify the reversal patterns using the calculation of the composite candle. The reversal patterns is similar to the "Hammer" and "Hanging Man" patterns in Japanese candlestick analysis. But it uses the composite candle instead the single candle and doesn't need the small body of the composite candle to confirm the reversal. Input parameters: Range - maximal number of bars, used in the calculation of the composite candle. Minimum - minimal size of the composite can
    FREE
    Weis Wave Double Side
    Eduardo Da Costa Custodio Santos
    The Weis Wave Bouble Side Indicator for MT5 is part of the toolkit (Wyckoff Academy Wave Market) The Weis Wave Bouble side Indicator for MT5 was created based on the already established Weis Wave created by David Weis. The Weis Wave Double Side indicator reads the market in waves as it was done by R. Wyckoff in 1900. It helps in the identification of effort x result, cause and effect, and Supply and demand Its differential is that it can be used below the zero axis, further improving plus operat
    Necessary for traders: tools and indicators Waves automatically calculate indicators, channel trend trading Perfect trend-wave automatic calculation channel calculation , MT4 Perfect trend-wave automatic calculation channel calculation , MT5 Local Trading copying Easy And Fast Copy , MT4 Easy And Fast Copy , MT5 Local Trading copying For DEMO Easy And Fast Copy , MT4 DEMO Easy And Fast Copy , MT5 DEMO The homeopathic indicator is also called the CCI indicator. The CCI indicator was propos
    FREE
    This is a buyer and seller aggression indicator that analyzes the shape of each candle and project this data in a histogram form. There are 4 histograms in one. On the front we have two: Upper - Buyer force. Lower - Seller force. At the background we also have two histogram, both with same color. They measure the combined strenght of buyers and sellers. This histograms can be turned off in Input Parameters. It is also possible to have the real or tick volume to help on this force measurement. IN
    FREE
    Standardize
    Manuel Espinosa
    5 (1)
    The "Standardize" indicator   is a technical analysis tool designed to   standardize and smooth price or volume data to highlight significant patterns and reduce market noise, making it easier to interpret and analyze. Description & Functionality: Standardization : The indicator standardizes price or volume values by subtracting the mean and dividing by the standard deviation. This converts the data into a distribution with zero mean and standard deviation of one, allowing different data sets
    FREE
    このインジケーターは、H.M.Gartley (「株式市場の利益」、1935 年) の開発に従って調和パターン (XABCD) を識別します。 D 点を透視投影の点として投影します (設定で ProjectionD_Mode = true を指定します)。 再描画はしません。 作業時間枠のバーが閉じるとき、特定されたパターン ポイントが Patterns_Fractal_Bars バーの間に移動していない場合、チャート上に (予想される価格変動の方向に) 矢印が表示されます。 この瞬間から、矢印はチャート上に永久に残ります。 連続した 2 ~ 3 つ以上の矢印 - これは市場状況の変化であり、再描画/再描画ではありません (時間枠を前後に切り替えてはなりません)。 注: 2 ~ 3 つ以上の矢印が連続している場合 - これは市況の変化であり、再描画ではありません。 パターンの総数は 85 です (Gartley-222 と Gartley-222WS を含む。完全なリストはコメント セクションにあります)。 識別されたすべてのパターンのうち、最後に識別されたパター
    Renko Chart
    Marcin Konieczny
    4.33 (12)
    This indicator allows to display Renko charts in the indicator window. Renko charts show only price movements that are bigger than the specified box size. It helps to eliminate noise and allows to focus on main trends. Time is not a factor here. Only price movements are taken into account. That's why Renko chart is not synchronized with the main chart it is attached to. Indicator works in two modes: CLOSE - only close prices are taken into account while building the chart HIGH_LOW - only high/
    FREE
    VI Vortex
    Fernando Lahude Ritter
    4.67 (3)
    Description : Enhance Your Trading Strategy with the Advanced Vortex Indicator for MT5! Discover the power of the Vortex Indicator (VI), a robust technical analysis tool now available for MetaTrader 5. This custom-built indicator is designed to help traders identify trends and reversals, offering a critical edge in the dynamic Forex market. Key Features: Dynamic Trend Identification : With the VI's unique calculations of VI+ (positive) and VI- (negative) lines, you can easily spot trend strength
    FREE
    Gino Renko
    Stephane, Andr Valette
    1 (1)
    Another renko-based indicator. It returns different usable values ​​for an EA, and is directly displayed on the main chart. Its setting is very simple: The size of the renko The number of bars taken into account The falling color The color on the rise Returned values: Buffer 0 : Value of the middle Buffer 1 : Value of the Top Buffer 2 : Value of the Bottom Buffer 3 : Direction of renko (0.0 for top ; 1.0 for bottom) Buffer 4 : Ratio of the renko, for example, if it is twice, 3 times, ro more of
    This indicator uses a mathematical calculation algorithm . This algorithm calculates the remainder between the updated model and the actual values and produces the possible progress of the graph on the graph. It is not a super prophet in trading, but it is very good for the trader when entering the market and to analyze it before entering. Applicable for all currencies. Данный индикатор использует алгоритм математических вычислений . Данный алгоритм вычисляет остаток между обновленной моделью и
    The Penta-O is a 6-point retracement harmonacci pattern which usually precedes big market movements. Penta-O patterns can expand and repaint quite a bit. To make things easier this indicator implements a twist: it waits for a donchian breakout in the right direction before signaling the trade. The end result is an otherwise repainting indicator with a very reliable trading signal. The donchian breakout period is entered as an input. [ Installation Guide | Update Guide | Troubleshooting | FAQ | A
    FREE
    Professional renko charting on a custom symbol chart accurate pricing to the tick  accurate timeline (no future date projections ) every renko variation in a single package very responsive charts optional display of live trade levels on the chart An Expert Advisor (EA) used to create custom Renko charts and provide real-time updates. This is an MT4 "offline" chart equivalent which is very simple to use. All historical renkos are constructed using real tick data from the broker's server.
    Follow The Line MT5
    Oliver Gideon Amofa Appiah
    4.4 (30)
    This indicator obeys the popular maxim that: "THE TREND IS YOUR FRIEND" It paints a GREEN line for BUY and also paints a RED line for SELL. (you can change the colors). It gives alarms and alerts of all kinds. IT DOES NOT REPAINT and can be used for all currency pairs and timeframes. Yes, as easy and simple as that. Even a newbie can use it to make great and reliable trades. NB: For best results, get my other premium indicators for more powerful and reliable signals. Get them here: https://www.m
    FREE
    Combining the best of Price Action , Directional Movement , and Divergence/Convergence analysis, Candle Color Trend is a easy and reliable way to identify trend direction. The indicator automatically paints the candles according to the assumption that an uptrend is defined by prices that form a series of higher highs and higher lows. In contrast, a downtrend is defined by prices that form a series of lower highs and lower lows. Additionally, ADX Wilder indicator is used to measure trend weakness
    FREE
    A professional tool for trading - the divergence indicator between the  MACD and the price, which allows you to receive a signal about a trend reversal in a timely manner or catch price pullback movements (depending on the settings). The indicator settings allow you to adjust the strength of the divergence due to the angle of the  MACD peaks and the percentage change in price, which makes it possible to fine-tune the signal strength. The indicator code is optimized and is tested very quickly as
    FREE
    Matreshka
    Dimitr Trifonov
    5 (1)
    Matreshka self-testing and self-optimizing indicator: 1. Is an interpretation of the Elliott Wave Analysis Theory. 2. Based on the principle of the indicator type ZigZag, and the waves are based on the principle of interpretation of the theory of DeMark. 3. Filters waves in length and height. 4. Draws up to six levels of ZigZag at the same time, tracking waves of different orders. 5. Marks Pulsed and Recoil Waves. 6. Draws arrows to open positions 7. Draws three channels. 8. Notes support and re
    AliPivot Points is a Meta Trader 5 Indicator that draws you the latest pivot points. You can choose from timeframes ranging from 1 Minute to 1 Month. Calculation methods for pivot points includes: Classic Pivot Points Camarilla Pivot Points Fibonacci Pivot Points Woodie Pivot Points You can personalize the line colors, style, and width to suit your preference. The indicator displays values on the right side of the chart. AliPivot Points values can also be utilized by developers for creating Expe
    FREE
    トレンドキャッチャー: アラートインジケーター付きのトレンドキャッチャーストラテジーは、市場トレンドやポテンシャルなエントリーポイントやエグジットポイントを特定するのに役立つ多目的な技術分析ツールです。動的なトレンドキャッチャーストラテジーを備えており、市場状況に適応してトレンドの方向を明確に視覚化します。トレーダーは、自身の好みやリスク許容度に合わせてパラメーターをカスタマイズできます。このインジケーターはトレンドの識別を支援し、ポテンシャルなリバーサルをシグナルし、トレイリングストップのメカニズムとして機能し、市場への迅速な対応のためのリアルタイムアラートを提供します。 特徴: - トレンドの識別:上昇トレンドと下降トレンドをシグナルします。 - トレンドのリバーサル:ローソク足の色が上昇から下降に変わった場合やその逆の場合に、ポテンシャルなリバーサルを警告します。 - リアルタイムアラート:新しいトレンドの識別に対するアラートを生成します。 推奨事項: - 通貨ペア:EURUSD、AUDUSD、XAUUSDなど... - タイムフレーム:H1。 - アカウン
    FREE
    Pare de seguir as "sardinhas" e comece a operar como big player, de forma automática. O robô Imbalance Autotrader é a mais recente tecnologia de trade que monitora os big players (grandes investidores) do mercado financeiro. Com estratégia de rompimento ( breakout ) ou pullback (Fair Value Gap FVG e Order Block) , você consegue configurar o robô para o ativo, conforme condições que você deseja operar. Além disso, o robô pode ter stops configuráveis, dinâmicos ou fixos. Na questão de gerenciamen
    このプロダクトを購入した人は以下も購入しています
    まず第一に、この取引インジケーターは再描画されず、再描画されず、遅延しないことを強調する価値があります。これにより、手動取引とロボット取引の両方に理想的なものになります。 ユーザーマニュアル:設定、入力、戦略。 アトミックアナリストは、価格の強さとモメンタムを利用して市場でより良いエッジを見つけるためのPA価格アクションインジケーターです。ノイズや誤ったシグナルを除去し、取引ポテンシャルを高めるための高度なフィルターを備えています。複雑なインジケーターの複数のレイヤーを使用して、アトミックアナリストはチャートをスキャンし、複雑な数学的計算をシンプルなシグナルと色に変換します。これにより、どのような初心者トレーダーでも理解して使用し、一貫した取引の決定を行うことができます。 「アトミックアナリスト」は、新規および経験豊富なトレーダー向けにカスタマイズされた包括的な取引ソリューションです。プレミアムインジケーターとトップノッチの機能を1つの取引戦略に組み合わせ、すべてのタイプのトレーダーにとって汎用性のある選択肢にします。 デイリートレーディングとスキャルピング戦略:高速で正確な
    まず第一に、このトレーディングシステムがノンリペイント、ノンリドロー、ノンラグのインジケーターであることを強調する価値がある。これにより、手動取引とロボット取引の両方に理想的なものになっています。 オンラインコース、マニュアル、プリセットのダウンロード。 「スマートトレンドトレーディングシステム MT5」は、新規および経験豊富なトレーダー向けにカスタマイズされた包括的なトレーディングソリューションです。10以上のプレミアムインジケーターを組み合わせ、7つ以上の堅実なトレーディング戦略を備えており、多様な市場状況に対応する多目的な選択肢となっています。 トレンドフォロー戦略:トレンドを効果的に乗り越えるための正確なエントリーとストップロス管理を提供します。 リバーサル戦略:潜在的なトレンドの反転を特定し、トレーダーがレンジ相場を活用できるようにします。 スキャルピング戦略:高速で正確なデイトレードおよび短期取引のために設計されています。 安定性:すべてのインジケーターはノンリペイント、ノンリドロー、ノンラグであり、信頼性の高いシグナルを保証します。 カスタマイズ:個々の取引の嗜好に合わせ
    74% discount for the next 10 buyers (original price $605): 1 left Get a 50% bonus by buying (or even renting) any of our products. After buying (or renting), send a message for more information. 3 Indicators in 1 indicator Strategy based on price action Made specifically for the best forex currency pairs Can be used in the best time frame of the market at a very reasonable price This indicator is basically 3 different indicatos . But we have combined these 3 indicators in 1 indicator so th
    ご紹介   クォンタム トレンド スナイパー インジケーターは 、トレンド反転を特定して取引する方法を変革する画期的な MQL5 インジケーターです。 13年以上の取引経験を持つ経験豊富なトレーダーのチームによって開発されました。     クォンタムトレンドスナイパーインジケーター   は、非常に高い精度でトレンドの反転を識別する革新的な方法で、あなたのトレーディングの旅を新たな高みに押し上げるように設計されています。 ***Quantum Trend Sniper Indicatorを購入すると、Quantum Breakout Indicatorを無料で入手できます!*** クォンタム ブレイクアウト インジケーターは、トレンドの反転を特定するとアラートを発し、矢印を示し、3 つのテイクプロフィットレベルを提案します。 初心者トレーダーにもプロのトレーダーにも適しています。 量子EAチャネル:       ここをクリック MT4のバージョン:       ここをクリック 推奨事項: 期間:すべての時間枠。最良の結果を得るには、M
    A key element in trading is zones or levels from which decisions to buy or sell a trading instrument are made. Despite attempts by major players to conceal their presence in the market, they inevitably leave traces. Our task was to learn how to identify these traces and interpret them correctly. Reversal First Impulse levels (RFI)   -  Version MT4                  INSTRUCTIONS                 RUS                 ENG                         R ecommended to use with an indicator   -  TREND PRO  
    まず第一に、この取引ツールはノンリペイント、ノンリドロー、ノンラグの指標であり、プロの取引に理想的ですことを強調する価値があります。 オンラインコース、ユーザーマニュアル、デモ。 スマートプライスアクションコンセプトインジケーターは、新米から経験豊富なトレーダーまで、非常 に強力なツールです。Inner Circle Trader AnalysisやSmart Money Concepts Trading Strategiesなど、20以上の有用な指標を1つに組み合わせています。このインジケーターはスマートマネーコンセプトに焦点を当て、大手機関の取引方法を提供し、彼らの動きを予測するのに役立ちます。 特に、流動性分析に優れており、機関がどのように取引しているかを理解しやすくしています。市場のトレンドを予測し、価格の動きを慎重に分析するのに優れています。機関の戦略とトレードを合わせることで、市場の動向についてより正確な予測ができます。このインジケーターは多目的であり、市場構造を分析し、重要な注文ブロックを特定し、さまざまなパターンを認識するのに優れています。 このインジ
    FX Volume MT5
    Daniel Stein
    4.94 (17)
    mql5と Telegramの モーニング・ブリーフィングで、詳細とスクリーンショットを含む毎日のマーケット・アップデートをご覧 ください! FX Volumeは、ブローカーの視点から市場のセンチメントをリアルに洞察する、最初で唯一の出来高インジケーターです。 ブローカーのような機関投資家が外国為替市場でどのようなポジションをとっているか、COTレポートよりもはるかに速く、素晴らしい洞察を提供します。 この情報をチャート上で直接見ることは、あなたの取引にとって真のゲームチェンジャーであり、画期的なソリューションです。 以下のようなユニークなマーケットデータ洞察から利益を得てください。 比率は 、通貨のロングポジションとショートポジションの比率をパーセントで表示します。 比率の変化は 、選択した期間内のロング比率とその変化率を表示します。 Volumes Totalは 、通貨の取引量(ロングとショート)の合計をロット単位で表示します。 Volumes Long :全通貨のロングポジションの取引量を表示します。 Volumes(ショート )は、全通貨のショートポジションの取引量を表示
    TPSpro TRENDPRO  - is a trend indicator that automatically analyzes the market and provides information about the trend and each of its changes, as well as giving signals for entering trades without redrawing! The indicator uses each candle, analyzing them separately. referring to different impulses - up or down impulse. Exact entry points into transactions for currencies, crypto, metals, stocks, indices!  -  Version MT4                  DETAILED DESCRIPTION        /       TRADING SETUPS       
    今、147ドル(いくつかの更新後に499ドルに増加します) - 無制限のアカウント(PCSまたはMac) RelicusRoad ユーザー マニュアル + トレーニング ビデオ + プライベート Discord グループへのアクセス + VIP ステータス 市場の新しい見方 RelicusRoad は、外国為替、先物、暗号通貨、株式、および指数の世界で最も強力な取引インジケーターであり、トレーダーに収益を維持するために必要なすべての情報とツールを提供します。初心者から上級者まで、すべてのトレーダーが成功するためのテクニカル分析と取引計画を提供します。これは、将来の市場を予測するのに十分な情報を提供する重要な取引指標です。意味をなさないチャート上のいくつかの異なる指標ではなく、完全な解決策を信じています.これは、信号、矢印 + 価格アクション情報を表示するオールインワンのインジケーターで、他に類を見ない非常に正確です。 強力な AI に基づいて、RelicusRoad は不足している情報とツールを提供して、あなたを教育し、トレーディングのプロ、成功したトレーダーにします。
    ICT, SMC, SMART MONEY CONCEPTS, SMART MONEY, Smart Money Concept, Support and Resistance, Trend Analysis, Price Action, Market Structure, Order Blocks, BOS/CHoCH,   Breaker Blocks ,  Momentum Shift,   Supply&Demand Zone/Order Blocks , Strong Imbalance,   HH/LL/HL/LH,    Fair Value Gap, FVG,  Premium  &   Discount   Zones, Fibonacci Retracement, OTE, Buy Side Liquidity, Sell Side Liquidity, BSL/SSL Taken, Equal Highs & Lows, MTF Dashboard, Multiple Time Frame, BigBar, HTF OB, HTF Market Structure
    Quantum平均足PRO のご紹介 市場のトレンドに対する明確な洞察を提供するように設計された平均足キャンドルは、ノイズを除去し、誤ったシグナルを排除する能力で知られています。混乱を招く価格変動に別れを告げ、よりスムーズで信頼性の高いチャート表現を導入しましょう。 Quantum Heiken Ashi PRO を真にユニークなものにしているのは、従来のローソク足データを読みやすい色のバーに変換する革新的なフォーミュラです。赤と緑のバーはそれぞれ弱気トレンドと強気トレンドをエレガントに強調し、潜在的なエントリーポイントとエグジットポイントを驚くほど正確に見つけることができます。 量子EAチャネル:       ここをクリック MT4のバージョン:       ここをクリック この注目すべき指標には、いくつかの重要な利点があります。 明確性の向上: 価格変動を平滑化することで、平均足バーは市場トレンドをより明確に表現し、有利な取引機会を特定しやすくします。 ノイズの削減: 誤ったシグナルを引き起こすことが多い不安定な価格変動に別れを告げます。 Quantum Heik
    ご紹介     Quantum Breakout PRO は 、ブレイクアウト ゾーンの取引方法を変革する画期的な MQL5 インジケーターです。 13年以上の取引経験を持つ経験豊富なトレーダーのチームによって開発されました。     クォンタム ブレイクアウト プロ   は、革新的でダイナミックなブレイクアウト ゾーン戦略により、あなたのトレーディングの旅を新たな高みに押し上げるように設計されています。 クォンタム ブレイクアウト インジケーターは、5 つの利益ターゲット ゾーンを備えたブレイクアウト ゾーン上のシグナル矢印と、ブレイクアウト ボックスに基づいたストップロスの提案を提供します。 初心者トレーダーにもプロのトレーダーにも適しています。 量子EAチャネル:       ここをクリック 重要!購入後、インストールマニュアルを受け取るためにプライベートメッセージを送ってください。 推奨事項: 時間枠: M15 通貨ペア: GBPJPY、EURJPY、USDJPY、NZDUSD、XAUUSD アカウントの種類: ECN、Raw、またはス
    mql5と Telegramの モーニング・ブリーフィングで、詳細とスクリーンショットを含む毎日のマーケット・アップデートをご覧 ください! FX Power MT5 NGは 、長年の人気を誇る通貨強度計FX Powerの次世代モデルです。 この次世代ストレングスメーターは何を提供するのでしょうか?初代FXパワーの魅力すべて プラス GOLD/XAUの強さ分析 より正確な計算結果 個別に設定可能な分析期間 カスタマイズ可能な計算上限値により、さらに優れたパフォーマンスを実現 もっと見たい人のための特別なマルチインスタンス設定 すべてのチャートでお好みの色を無限に設定可能 数え切れないほどの通知オプションにより、重要なことを見逃すことはありません。 Windows 11とmacOSのスタイルで角を丸くした新しいデザイン 魔法のように動くインジケーターパネル FXパワーの主な機能 すべての主要通貨の強さの完全な履歴 すべての時間枠における通貨の強さの履歴 すべてのブローカーとチャートで同一の計算結果 100%信頼できるリアルタイム計算 -> リペイントなし ドロップダウン・リストから
    Bill Williams Advanced is designed for automatic chart analysis using Bill Williams' "Profitunity" system. The indicator analyzes four timeframes at once. Manual (Be sure to read before purchasing) Advantages 1. Automatically analyzes the chart using the "Profitunity" system of Bill Williams. The found signals are placed in a table in the corner of the screen. 2. Equipped with a trend filter based on the Alligator indicator. Most of the system signals are recommended to be used only accordi
    IX Powerは 、FX Powerの無敵の精度をついにFX以外のシンボルにも提供します。 お気に入りの指数、株式、コモディティ、ETF、さらには暗号通貨の短期、中期、長期のトレンドの強さを正確に判断します。 お使いの端末が提供する すべてを分析する ことができます。ぜひお試しいただき、取引 タイミングが大幅に改善 されることをご体験ください。 IXパワーの主な特徴 100%正確で再描画されない計算結果 - ターミナルで利用可能なすべての取引シンボルに対して 予め設定され、さらに個別に設定可能な強度分析期間のドロップダウン選択 Eメール、メッセージ、モバイル通知による無数の通知オプション EAリクエストのためのアクセス可能なバッファ カスタマイズ可能な計算制限により、さらに優れたパフォーマンスを実現 もっと見たい人のための特別なマルチインスタンス設定 すべてのチャートでお好みの色を無限に設定可能 Windows 11とmacOSのスタイルで角を丸くした新しいパネルデザイン サブ・ウィンドウとメイン・チャートの間をシームレスに移動する、魔法のように動くイン
    これはMT5のインジケーターで、再描画なしで取引に参入するための正確なシグナルを提供します。 外国為替、暗号通貨、金属、株式、インデックスなど、あらゆる金融資産に適用できます。かなり正確な見積もりを提供し、取引を開始して終了するのに最適な時期を教えてくれます。1つのシグナルを処理しただけでインジケーターの元が取れた例の 動画 (6:22)をご覧ください。Entry PointsPro インジケーターの助けを借りたほとんどのトレーダーの最初の1週間の結果が改善しています。 Telegramグループ に登録してください。Entry Points Proインジケーターのメリットは次の通りです。 再描画のないエントリーシグナル 再描画されるインジケーターでは一度表示されたシグナルが削除されて大きな金銭的損失につながることがありますが、これと異なり、表示されて確認されたシグナルは消えることがありません。 エラーなしの取引開始 インジケーターアルゴリズムによって取引を開始する(資産を売買する)理想的な瞬間を見つけることができます。それを使用するすべてのトレーダーの成功率が向上します。
    Was: $249  Now: $99   Market Profile defines a number of day types that can help the trader to determine market behaviour. A key feature is the Value Area, representing the range of price action where 70% of trading took place. Understanding the Value Area can give traders valuable insight into market direction and establish the higher odds trade. It is an excellent addition to any system you may be using. Inspired by Jim Dalton’s book “Mind Over Markets”, this indicator is designed to suit the
    Was: $299  Now: $99   Supply Demand uses previous price action to identify potential imbalances between buyers and sellers. The key is to identify the better odds zones, not just the untouched ones. Blahtech Supply Demand indicator delivers functionality previously unavailable on any trading platform. This 4-in-1 indicator not only highlights the higher probability zones using a multi-criteria strength engine, but also combines it with multi-timeframe trend analysis, previously confirmed swings
    レンジと次の動きを特定     |    トレンドの最も早いシグナルと強さを得る     |    反転の前に明確な出口を得る     |    価格がテストするフィボ・レベルを見つける。   |  非リペイント、非遅延インディケータ - マニュアルおよび自動売買に最適 - すべての資産、すべての時間単位に対応 - 発売記念50%割引   - その後 149 ドルに戻る 購入後、 推奨セッティングについては、このチャンネルで私に連絡してください。 MT4 バージョン: ここをクリック BladeSCALPER と PowerZONES を使った完全な方法を入手する どのようなものですか? TrendDECODERは、トレンド監視をシンプルかつ簡単にするための複数のイノベーションを集約したものです。 Projective TrendLine (投影トレンドライン) - 今後のトレンドのスピードリファレンス RealTime TrendLine vs. Projective TrendLine (リアルタイムトレンドライン vs. Projective Tren
    現在33%オフ 初心者にもエキスパートトレーダーにも最適なソリューション このインジケーターは独自の機能と新しい公式を多数内蔵しており、ユニークで高品質かつ手頃な取引ツールです。このアップデートでは、2つの時間枠ゾーンを表示できるようになります。より長いTFだけでなく、チャートTFとより長いTF(ネストゾーンを表示)の両方を表示できます。すべてのSupply Demandトレーダーの皆さんのお気に召すはずです。:) 重要情報の公開 Advanced Supply Demandの可能性を最大化するには、 https://www.mql5.com/ja/blogs/post/720245 にアクセスしてください。   エントリーまたはターゲットの正確なトリガーポイントを正確に特定できれば取引がどのように改善されるか想像してみてください。新しい基盤となるアルゴリズムに基づいて構築されているため、買い手と売り手の間の潜在的な不均衡をさらに簡単に特定できます。これは、最も強い需要と供給のゾーンと、過去のパフォーマンス(古いゾーンを表示)がグラフィカルに表現されるためです。これらの機能は、最適
    初心者やエキスパートトレーダーに最適なソリューション! このインジケーターは、独自の機能と新しい計算式を取り入れた、ユニークで高品質、かつ手頃な価格のトレーディングツールです。たった1枚のチャートで28の為替ペアの通貨強度を読み取ることができます。新しいトレンドやスキャルピングチャンスの引き金となるポイントを正確に特定することができるので、あなたのトレードがどのように改善されるか想像してみてください。 ユーザーマニュアルはこちら  https://www.mql5.com/en/blogs/post/697384 これが最初の1本、オリジナルだ! 価値のないクローンを買わないでください。 特別な サブウィンドウの矢印で強い通貨の勢いを表示 GAPがあなたのトレードを導く! 基準通貨や気配値が売られすぎ・買われすぎのゾーン(外相フィボナッチレベル)にあるとき、個別チャートのメインウィンドウに警告表示。 通貨がレンジの外側から反落した場合、プルバック/リバーサルのアラート。 クロスパターンの特別なアラート 複数の時間枠を選択可能で、トレンドを素早く確認できます。通貨強
    まず最初に、このトレーディングシステムがリペイントされず、再描画されず、遅延しないことを強調する価値があります。これにより、プロのトレーディングに最適な状態になります。 オンラインコース、ユーザーマニュアル、デモ。 「スマートサポートアンドレジスタンストレーディングシステム」は、新規および経験豊富なトレーダー向けにカスタマイズされた高度なインジケーターです。この包括的なシステムは、7以上の戦略、10のインジケーター、およびデイトレード戦略、スイングトレード戦略、サポートおよびレジスタンス戦略、ローソク足パターン戦略、VWAP戦略、マルチタイムフレームトレンド戦略など、さまざまなトレーディングアプローチを組み合わせています。これは、矢印信号、エントリーポイント、出口ポイント、トレードアラート、より高い時間枠のトレンド分析、リアルタイムのトレードモニタリング、そして洞察力のあるトレンドとボリュームキャンドルの着色を提供します。自動的なサポートとレジスタンスの検出により、さまざまな市況下でトレーダーが的確な決定を下すのを支援する多面的なインジケーターとなっています。 スマートサポートア
    Gartley Hunter Multi - An indicator for searching for harmonic patterns simultaneously on dozens of trading instruments and on all classic timeframes: (m1, m5, m15, m30, H1, H4, D1, Wk, Mn). Manual (Be sure to read before purchasing) | Version for MT4 Advantages 1. Patterns: Gartley, Butterfly, Shark, Crab. Bat, Alternate Bat, Deep Crab, Cypher 2. Simultaneous search for patterns on dozens of trading instruments and on all classic timeframes 3. Search for patterns of all possible sizes. Fr
    Professional Scalping Tool on Deriv Attention! The indicator will be sold in limited quantities!!! The previous 5 copies were sold for $250 The remaining 4 copies will be sold for $350 The next price is $500 Description: This trading indicator is designed for professional traders focused on scalping. Designed with the market in mind, it provides highly accurate spike trading signals. It works on the M1 timeframe and supports the following symbols: Boom 300 Index, Boom 500 Index, Boom 1000 I
    BUY INDICATOR AND GET EA FOR FREE AS A BONUS + SOME OTHER GIFTS! ITALO VOLUME INDICATOR  is the best volume indicator ever created, and why is that? The Indicator works on all time-frames and assets, indicator built after 7 years of experience on forex and many other markets. You know many volume indicators around the internet are not complete, does not help, and it's difficult to trade, but the Italo Volume Indicator is different , the Italo Volume Indicator shows the wave volume, when market
    MetaForecast M5
    Vahidreza Heidar Gholami
    5 (2)
    MetaForecastは、価格データのハーモニクスに基づいて、どんな市場の未来を予測し視覚化します。市場が常に予測可能ではありませんが、価格にパターンがある場合、MetaForecastは可能な限り正確な未来を予測できます。他の類似製品と比較して、MetaForecastは市場のトレンドを分析することでより正確な結果を生成することができます。 入力パラメータ Past size (過去のサイズ) MetaForecastが将来の予測を生成するために使用するバーの数を指定します。モデルは選択したバー上に描かれた黄色の線で表されます。 Future size (将来のサイズ) 予測すべき将来のバーの数を指定します。予測された将来は、ピンクの線で表示され、その上に青い回帰線が描かれます。 Degree (程度) この入力は、MetaForecastが市場で行う分析のレベルを決定します。 Degree 説明  0 Degree 0の場合、価格の全てのピークや谷、そして詳細をカバーするために、「Past size」の入力に大きな値を使用することが推奨されています。  1 (推奨) Degr
    Chart Sync MT5
    Dragos Mihai Ofrim
    5 (3)
    ChartSync Pro MT5 is an indicator, designed for the MetaTrader 5 trading terminals. It enables the trader to perform better multi-timeframe technical analysis, by synchronizing symbols and objects into virtually unlimited charts.  Built by traders for traders!   Telegram Premium Support - Dd you purchase the Chart Sync indicator and need a bit of help? Send us a screenshot with your purchase and your Telegram ID so we can add you to our premium support Telegram group.  The indicator has vario
    クリスマスセール!40% OFF!1月1日に価格が$250に値上がり! GoldenGate Entriesをご紹介します:最先端のトレーディングソリューション! GoldenGate Entries(GGE)を使用して取引する革新的なアプローチを発見しましょう。GGEは、取引体験を向上させるために設計された先進的なインジケーターで、ユーザーに正確性と自信を持たせるための包括的な機能を提供します。 通貨ペア:Any(FX - 商品 - 株式 - 株式 - クリプト) タイムフレーム:15分からH1 主な特徴: 買いと売りの矢印の指示:常に情報を受け取るために、買いと売りの矢印の指示をポップアップアラートとともに受け取ります。 GoldenGate_Algo:GoldenGate_Algoを使用して市場の状況を把握し、市場が「売り過ぎ」または「買い過ぎ」かどうかを評価する強力なツールです。 現在のトレンド分析:視聴中のタイムフレームで現在のトレンドにアクセスして、取引を市場の主流方向に合わせることができます。 組み込みのピボットポイント:組み込まれた
    The Volume by Price Indicator for MetaTrader 5 features Volume Profile and Market Profile TPO (Time Price Opportunity). Volume and TPO histogram bar and line charts. Volume Footprint charts. TPO letter and block marker collapsed and split structure charts. Session filtering and grouping. Static, dynamic and flexible range segmentation and compositing methods with relative and absolute visualizations. Graphical layering, positioning and styling options to suit the user's analytic and aesthetic n
    Create Unlimited Dashboards Each dashboard can be upto 28 Symbols x 24 Indicators. Mix and match from 31 leading indicators and all timeframes, to create unlimited unique dashboards. Create Group Alerts to be alerted when your chosen indicators are all aligned. 33 customizable trading strategy alerts (Trend, Breakout, Overbought, Oversold, Thresholds, Saucers etc). Scalper, Day or Long Term Trader?  Mega Dash has you covered, design your unique dashboard to suit your trading style. Mega Dash is
    作者のその他のプロダクト
    Auto Order Block with break of structure based on ICT and Smart Money Concepts Futures Break of Structure ( BoS )             Order block ( OB )            Higher time frame Order block / Point of Interest ( POI )    shown on current chart           Fair value Gap ( FVG ) / Imbalance   ,  MTF      ( Multi Time Frame )    Volume Imbalance     ,  MTF          vIMB Gap’s Equal High / Low’s     ,  MTF             EQH / EQL Liquidity               Current Day High / Low           HOD /
    Imbalance MTF mt4
    Barend Paul Stander
    3 (2)
    Imbalance / FVG  MTF Mark Imbalance on chart of  Selected Multi Time frames. Trend is Manually set to filter signals in the chosen direction by a button on the chart. . Futures Auto Mark Imbalance / FVG on chart on selected time frames Select time frames by buttons on chart Popup Alert, Push Notification or email when New Imbalance Form Popup Alert, Push Notification or email when Imbalance is Taken out Select Alert Mode to be a single or multiple Imbalance ( OR / AND option ) when Imbalan
    DR and IDR mt5
    Barend Paul Stander
    5 (8)
    Defining Range ( DR ) and Implied Defining Range ( IDR  ) indicator New  Pro version here :   https://www.mql5.com/en/market/product/91851?source=Site+Profile+Seller Show DR and IDR ranges on the chart for   Regular , Overnight and After Sessions for more information how DR and IDR work and the high probability  watch :  https://www.youtube.com/@themas7er or   https://twitter.com/IamMas7er Remember to set set your chart TimeZone when you attach indicator to the chart under indicator set
    FREE
    DR IDR Pro
    Barend Paul Stander
    5 (3)
    Defining Range ( DR ) and Implied Defining Range ( IDR  ) indicator Pro with added features from free version Show DR and IDR ranges Sessions on the chart for   RDR     Regular defining range (New York Session) ADR    After defining range (Asian session) ODR     Outside defining range (London Session) Buttons on chart to enable / disable : Show  Imbalance ( IMB ) Show Volume Imbalance ( VIB ) Show  Gap's between open and close Show  Standard Deviation ( SD ) Show last 3 Sessions
    DR and IDR
    Barend Paul Stander
    5 (2)
    Defining Range ( DR ) and Implied Defining Range ( IDR  ) indicator Show DR and IDR ranges on the chart for   Regular , Overnight and After Sessions for more information how DR and IDR work and the high probability  watch :  https://www.youtube.com/@themas7er or   https://twitter.com/IamMas7er Remember to set set your chart TimeZone when you attach indicator to the chart under indicator settings / inputs Volume Imbalance : https://www.mql5.com/en/market/product/91165?source=Site+Pr
    FREE
    Equal Highs and Lows Indicator Find and Mark Equal Highs and Lows on chart of Selected Multi Time frames. Options: set min and max bars between Equal High's / Low's bars set max points difference between High's / Low's  ( Sensitivity  ) Select time frames by buttons on chart Select / Filter only High's or Low's by a button Extend Equal High's / Low's line forward for chart reference Manual  MT4 version MT5 version Other Indicators
    DR IDR Pro mt4
    Barend Paul Stander
    5 (1)
    Defining Range ( DR ) and Implied Defining Range ( IDR  ) indicator Pro with added features from free version Show DR and IDR ranges Sessions on the chart for   RDR     Regular defining range (New York Session) ADR    After defining range (Asian session) ODR     Outside defining range (London Session) Buttons on chart to enable / disable : Show  Imbalance ( IMB ) Show Volume Imbalance ( VIB ) Show  Gap's between open and close Show  Standard Deviation ( SD ) Show last 3 Sessions
    Quarterly Cycles Quarterly Cycles is based on the Quarterly Theory developed by Daye (  traderdaye on X ). This is an aid to the user to find Cycles and it is NOT automatic detected, user can select AMDX or XAMD  in each Cycle and it will be visually drawn on the chart.  Quarterly Cycles:   Yearly, Monthly, Weekly, Daily, 6 Hour (90 minutes) –  Yearly Cycle : The year is divided in four sections of three months each Q1 - January, February, March Q2 - April, May, June Q3 - July, August, Sept
    Quarterly Cycles Quarterly Cycles is based on the Quarterly Theory developed by Daye (  traderdaye on X ) T his is an aid to the user to find Cycles and it is NOT automatic detected, user can select AMDX or XAMD in each Cycle and it will be visually draw on the chart. Quarterly Cycles:   Yearly, Monthly, Weekly, Daily, 6 Hour (90 minutes) Yearly Cycle: The year is divided in four sections of three months each Q1 - January, February, March Q2 - April, May, June Q3 - July, August, September Q4
    ICT Kill zone and Macros Indicator mark and display the following zone times on the chart: Kill zones   Kill zone Forex Asian London Open New York Open London Close Central Bank Dealing range Kill zone Indices Asian London Open New York AM New York Lunch New York PM Power Hour Macros London 1 London 2 New York Am 1 New York AM 2 New York Lunch New York PM 1 New York PM 2 Silver bullet London Open New York AM New York PM Sessions Asian London New York Chart The display of  Kill zone ,
    Imbalance / FVG MTF Mark Imbalance on chart of  Selected Multi Time frames. Trend is Manually set to filter signals in the chosen direction by a button on the chart. . Futures Auto Mark Imbalance / FVG on chart on selected time frames Select time frames by buttons on chart Popup Alert, Push Notification or email when New Imbalance Form Popup Alert, Push Notification or email when Imbalance is Taken out Select Alert Mode to be a single or multiple Imbalance ( OR / AND option )  when Imbalan
    ICT Kill zone and Macros Indicator mark and display the following zone times on the chart: Kill zones   Kill zone Forex Asian London Open New York Open London Close Central Bank Dealing range Kill zone Indices Asian London Open New York AM New York Lunch New York PM Power Hour Macros London 1 London 2 New York Am 1 New York AM 2 New York Lunch New York PM 1 New York PM 2 Silver bullet London Open New York AM New York PM Sessions Asian London New York Chart The display of  Kill zone ,
    Equal Highs and Lows Indicator Find and Mark Equal Highs and Lows on chart of Selected Multi Time frames. Options: set min and max bars between Equal High's / Low's bars set max points difference between High's / Low's  ( Sensitivity  ) Select time frames by buttons on chart Select / Filter only High's or Low's by a button Extend Equal High's / Low's line forward for chart reference Manual  MT4 version MT5 version Other Indicators
    フィルタ:
    NKTrade1970
    29
    NKTrade1970 2023.12.30 23:53 
     

    Très utile et patrique en swing comme en scalping

    stany-k
    19
    stany-k 2023.12.26 23:12 
     

    How can I change the display of the Indicator?? show Icon instead of text??

    Barend Paul Stander
    12727
    開発者からの返信 Barend Paul Stander 2023.12.27 07:37
    Hi if you talk about the old icon menu go to indicator inputs , Other settings and set Use_old_menu to true
    TradeBizz
    20
    TradeBizz 2023.12.13 13:19 
     

    Very nice indicator!! I love it. It gets better and better with update after update! Good job

    Kitomi09
    153
    Kitomi09 2023.09.07 08:17 
     

    For ICT students if you're a fan of the Judas swing strategy this indicator is absolutely perfect. The only comment I would say is, instead of the "50% entry" appearing once the orderblock has been touched could you additionally have the option to already have it set for whenever the orderblock appears

    Thapelo Steven Agus
    181
    Thapelo Steven Agus 2023.08.22 15:51 
     

    Thank you so much Barend for this exceptional indicator. It is really making my life easier since I’m automating my trades using Expert Advisor. Kudos to you for the excellent work! Any chance you could add POI touch markers as well? That will be very helpful. Once again, thank you for this awesome indicator.

    UPDATE: Hi Barend. Thank you very much for adding the POI touch markers on version 3.7 as per my request. I honestly appreciate that. If it is not much of a hassle, would you kindly change the labeling to POI_mark_bear_xx/POI_mark_bull_xx? The labeling is the same as the OB markers.

    UPDATE: Thanks Barend for making all the requested changes. I really appreciate it. You are the best!

    robertmalota
    61
    robertmalota 2023.08.04 09:40 
     

    Hi, how many candels can I add to the chart? Its working so good...

    Barend Paul Stander
    12727
    開発者からの返信 Barend Paul Stander 2023.08.04 10:20
    Hi recommended not more than 300 , max set at 600
    Panasco
    19
    Panasco 2023.07.16 12:30 
     

    I bought 2.5 version this week. how to upgrade?

    Barend Paul Stander
    12727
    開発者からの返信 Barend Paul Stander 2023.07.16 16:28
    Martin Matomo
    26
    Martin Matomo 2023.06.10 18:43 
     

    The indicator is very useful, it's a good job.

    Niccyril Chirindo
    2061
    Niccyril Chirindo 2023.06.08 10:48 
     

    Good Product

    camira
    224
    camira 2023.05.23 08:19 
     

    good tool! really recommended

    jumah55
    66
    jumah55 2023.04.09 11:18 
     

    Great product. Identifies the break of structures.

    Delacosa
    80
    Delacosa 2023.01.31 10:00 
     

    I give 5 stars but please asap make an update where you can set the sensitivity of OB detection. Currently many OB are not detected. Please make an update where you can set the sensitivity in terms of OB detection. this is a very nice indicator.

    Dosseh Esse
    21
    Dosseh Esse 2023.01.24 16:50 
     

    Bonjour la famille, svp après l'achat de auto order block comment faire pour le mettre sur le graphique ?

    Oscar Henao
    60
    Oscar Henao 2022.11.18 05:05 
     

    algo no funciona bien, mientras el grafico llega al SL, y lo sobrepasa, el aplicativo sigue estático. aun superándolo.

    mattogle24
    24
    mattogle24 2022.09.25 18:00 
     

    I do really enjoy the indicator. I can't seem to download the PDF that has insturctions on how to properly use, but after some clicking around it is intuitive enough. For some reason my version doesn't allow me to click on the POI and change from the higher timeframe OB between M1 M5 M15 etc like it does on MT4 for my friend. I'd really like to see this feature available - which would bring this up to 5 stars for me.

    Tinashemk_263
    37
    Tinashemk_263 2022.09.06 21:13 
     

    impressive work.

    ayomide1234
    19
    ayomide1234 2022.09.01 20:47 
     

    This is simply one of the best out there. Money well spent!

    MAKARIOS YACOUBIAN
    2891
    MAKARIOS YACOUBIAN 2022.08.16 10:24 
     

    I am using this tools from several months , i gave 5 stars ... after today update this is acomplete system with more added important tools .. would like to thank Barend for his efforts to improve .. thanks again for your time to deliver such as beautful job .. 7 stars

    レビューに返信
    バージョン 5.2 2024.05.24

    add HH , LL , HL , LH

    add HTF Choch / HTF BOS
    バージョン 5.1 2024.05.13

    add a button to Show / Hide Trade Levels
    add FVG poi / higher time-frame option
    バージョン 5.0 2024.02.21

    add FVG middle line

    add PDC PWC PMC

    premium / discount

    add option to show session mid line

    add option to show kill zone mid line

    add option to show silver bullet mid line

    add button to Enable second function for FVG , Vol.IMB and EHL buttons
    バージョン 4.9 2024.02.09

    add button to move or Hide Menu
    バージョン 4.8 2024.01.27

    add error checking
    vol imbalance extend past bar 0
    バージョン 4.7 2023.12.19
    bug fixes
    バージョン 4.6 2023.12.14
    Add button to take and save a screenshot

    Add FVG formed alert
    バージョン 4.5 2023.11.25

    Upgrade Volume Imbalance to MTF
    Upgrade EQ H/L to MTF
    some fixes
    バージョン 4.3 2023.10.29

    new Menu style buttons
    バージョン 4.2 2023.10.27

    add Weekly and daily NY day open to liquidity

    add Equal_HL alerts

    add a option to set imbalance button to show current only

    add option to show old FVG/ Imbalance up to takeout bars
    バージョン 4.1 2023.10.13

    add date number to session labels

    minor fixes
    バージョン 4.0 2023.10.06
    Fix Menu Location option
    バージョン 3.9 2023.10.06

    add alerts when Liquidity line is touched

    add MTF options to FVG / Imbalance button

    add options to mark sessions time , kill zone times and silver bullet times

    バージョン 3.8 2023.09.19

    add - select Liquidity mode by button
    バージョン 3.7 2023.09.15

    add option to Mark POI touches

    add option to show Liquidity levels on the side of chart
    バージョン 3.6 2023.09.13

    fix OB price labels spacing

    add option to hide menu
    バージョン 3.5 2023.09.09
    minor bug fix
    バージョン 3.4 2023.09.08
    Add Liquidity line Labels
    バージョン 3.3 2023.09.07
    extend OB rectangle pass bar 0
    バージョン 3.0 2023.08.30
    Added :

    - button to turn BOS on/off

    - Vol Imbalance

    - Mark Gap's

    - Show Equal High / Lows

    - Show Liquidity lines :

    PMH - Previous Month High
    PWH - Previous Week High
    PDH - Previous Day High
    HOD - High Of Day
    HOW - High Of Week


    PML - Previous Month Low
    PWL - Previous Week Low
    PDL - Previous Day Low
    LOD - Low Of Day
    LOW - Low Of Week

    - show buffers in Data Window for bar 0 if OB touched
    バージョン 2.6 2023.07.16
    OB touch markers
    バージョン 2.5 2023.05.03
    Show RR improvements
    バージョン 2.4 2023.04.28
    add object tooltip info
    バージョン 2.3 2023.03.06
    add new OB formed alert
    バージョン 2.2 2023.01.25
    Add more POI time frames to POI button
    バージョン 2.1 2022.09.20
    POI time frame setting
    バージョン 2.0 2022.06.21
    updated version
    バージョン 1.6 2021.10.10
    Push Notifications Added