GRat Clusters
- インディケータ
- Ivan Titov
- バージョン: 1.0
- アクティベーション: 10
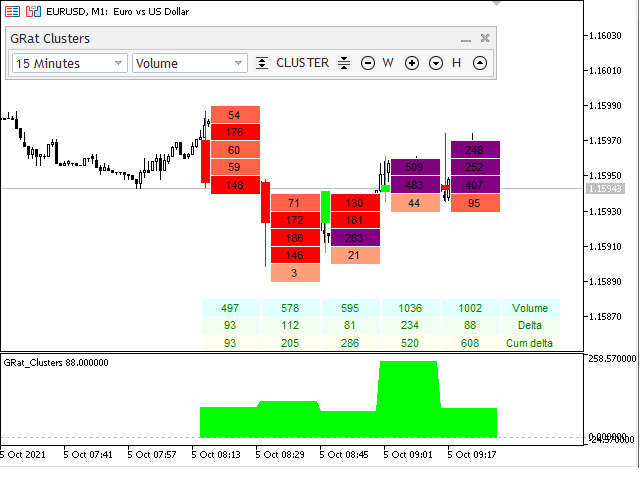
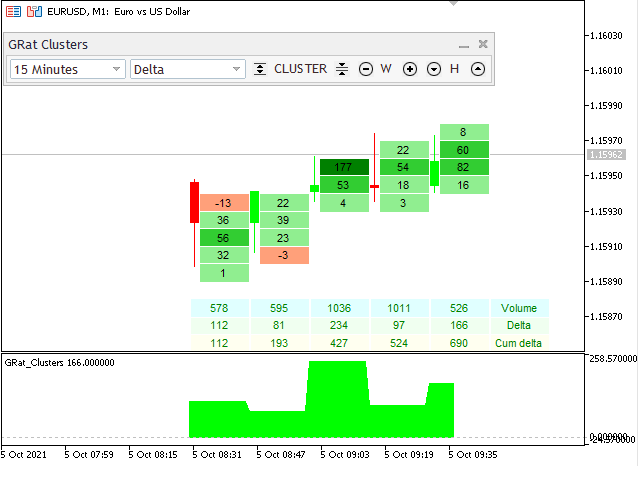
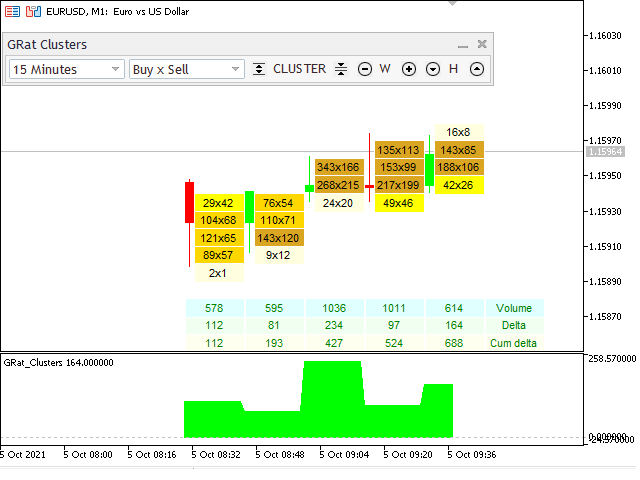
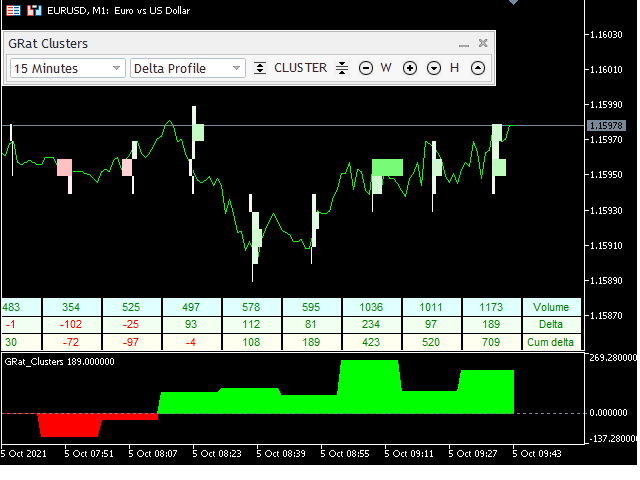
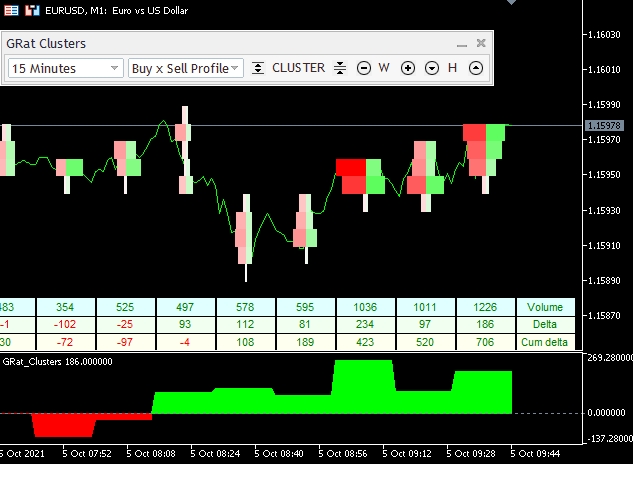
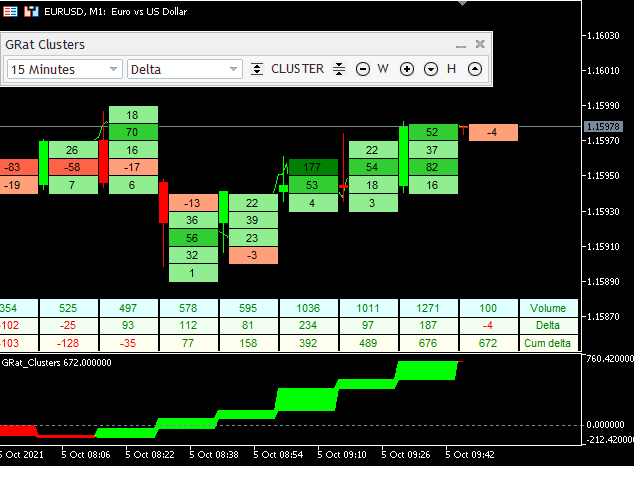
GRat Clusters is an indicator that shows various data in the form of clusters on a price chart: volume, delta, ratio of sales and purchases, etc. It allows you to visually see the market profile in real time and on history at a given depth.
Capabilities
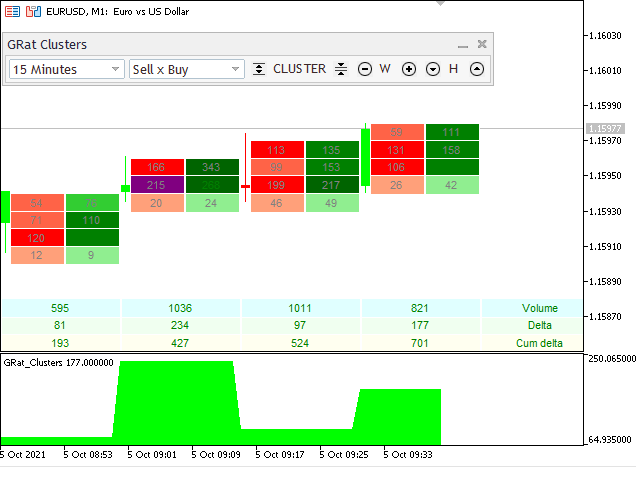
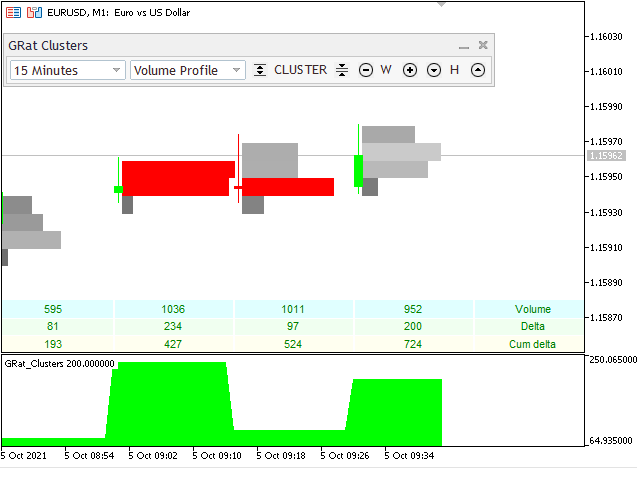
1.8 types of cluster data: volume, delta, purchases and sales, volume and delta, imbalance between sales and purchases , volume profile, delta profile, buy and sell profile.
2. A cluster period can be either any available in MT5 timeframe or variable, but with a fixed number of clusters (like Renko candles).
3. Optional display of candlesticks of cluster periods.
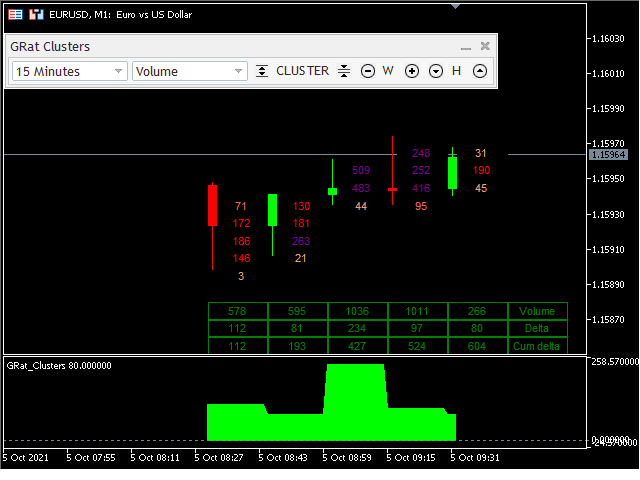
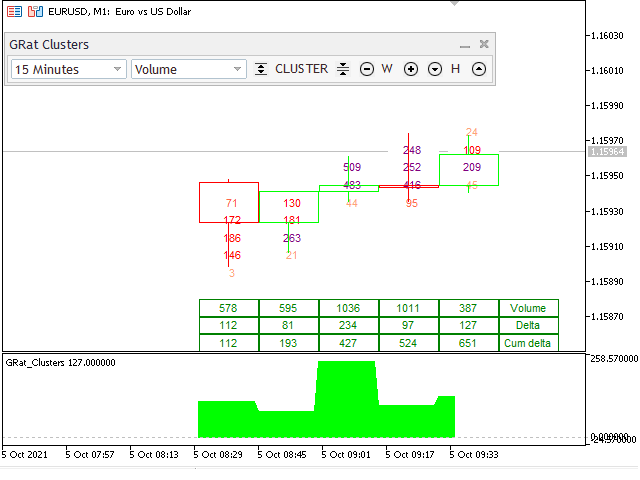
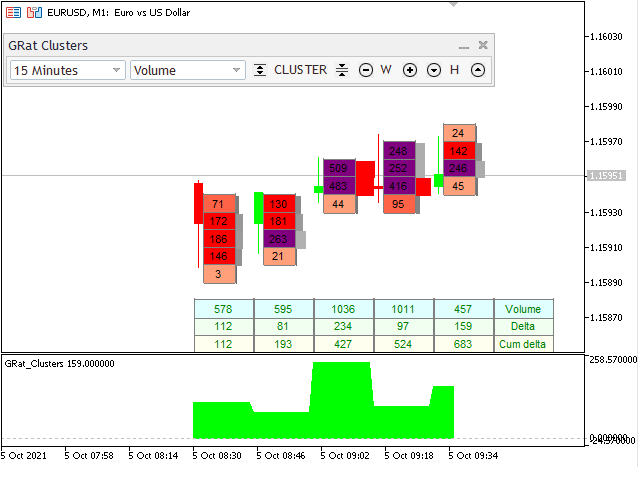
4. 4 styles of displaying clusters.
5. Control panel on the chart for changing the size and data type of the cluster on the fly.
6. Table of totals for each period of the cluster with data for volume, delta and cumulative delta.
7. Displaying a choice of a delta or cumulative delta chart in an additional indicator window.
Recommendations
1. For greater clarity, it is recommended to set the cluster period at least 3 chart timeframes.
2. The indicator uses all the data available in the terminal, therefore, for a more accurate analysis, it is recommended to work on brokers and instruments that provide real volumes and tick changes of the last transaction price and volume.
Parameters
1. Type - the data type of the cluster.
2. Style - cluster design style: A, B, C and D (see screenshots).
3. DVolProfile - whether to show the volume profile to the right of the clusters (only for D style).
4. Timeframe - the timeframe of the cluster period or the number of vertical clusters in one period.
5. DefaultRange - the number of clusters vertically in one period by default (used if Default is selected in the previous parameter).
6. PeriodsNumber - the number of calculated periods back in time, starting from the current time. If 0 is specified, it is calculated starting from the date specified below.
7. StartDate - calculation start date, if PeriodsNumber = 0.
8. ClusterPoints - cluster height in points.
9. FontSize - font size of the text in the cluster.
10. === Volume === - colors of volume clusters depending on the value.
11. === Delta === - colors of delta clusters depending on the value.
12. === Buy x Sell === - colors of buy and sell clusters depending on the value.
13. === Sell x Buy === - colors of clusters of imbalance of sales and purchases depending on the value.
14. === Volume Profile === - colors of the volume profile clusters depending on the value.
15. === Delta Profile === - colors of delta profile clusters depending on the value.
16. === Buy x Sell Profile === - colors of the buy and sell profile clusters depending on the value.
17. === Totals === - totals table colors.
18. === Sub Window === - selection of chart data in the additional window: delta or cumulative delta.
19. === Candles === - showing candles of the cluster periods.
20. BullishColor, BearishColor - the colors of the candlesticks of the cluster periods.

