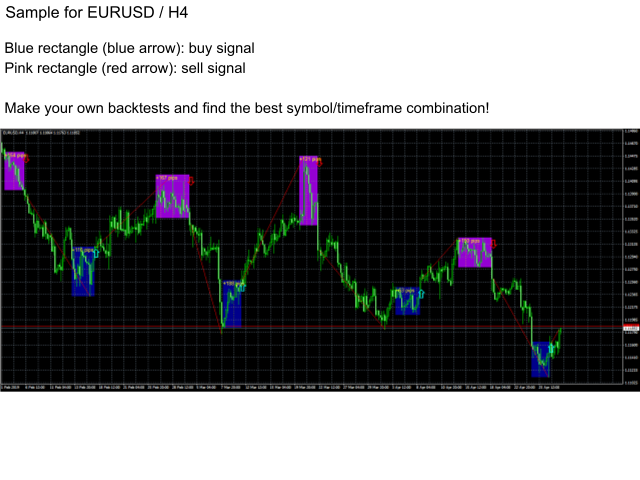
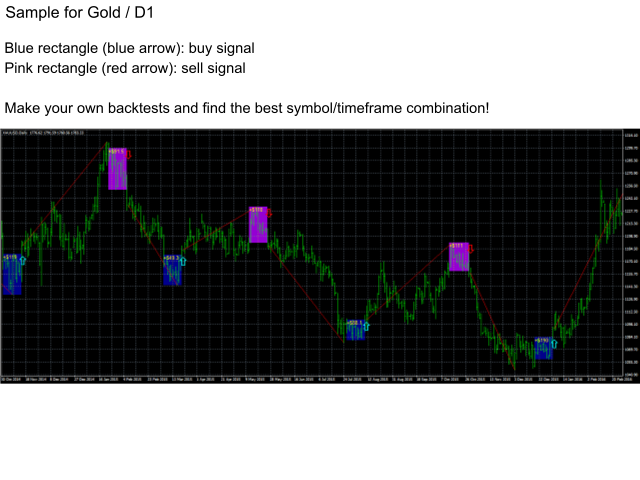
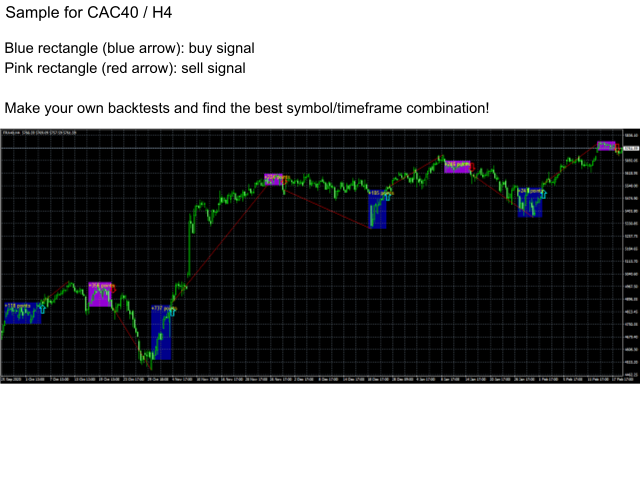
• 概要
  • レビュー
  • コメント (3)

Trend Change Alert

Never miss a trend change again!

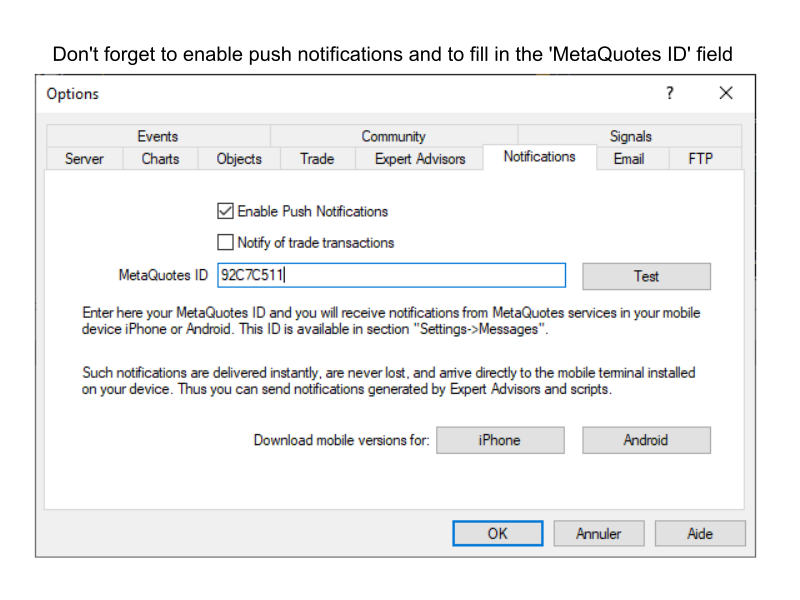
This indicator uses various calculation methods based on price action to detect changes in the direction of the trend. It can be used on high timeframes (from H1 to D1) and is most suitable for H4 and Daily timeframe. This indicator is compatible with all broker symbols (forex, indices, CFD, commodities, crypto…).

It is also possible to open the indicator on several charts to follow several symbols at the same time. In addition, you don't have to stand by your PC as you can be notified on your smartphone if a new trend is detected.

The Trend Change Alert is a no-repaint indicator and all calculations are performed in real time.


Requirements:

  • Broker: any (works correctly with all brokers)
  • Symbols: any
  • Timeframe: H1, H4 or D1

Parameters:

  • Buy/sell/profit colors: colors of the indicator 
  • Indicator alerts: terminal and/or smartphone notifs

You can find further information about this indicator by following this link. Feel free to send me a message with your ideas for improvement.


See my other products here.

おすすめのプロダクト
This simple indicator paints with a darker color on the volume bar when the quantity traded is above the average of select number of periods of the volume itself, highlighting the moments when there was a large volume of deals above the average. It is also possible to use a configuration of four colors where the color tone shows a candle volume strength. The indicator defaults to the simple average of 20 periods, but it is possible to change to other types of averages and periods. If you like
FREE
TrendPlus
Sivakumar Subbaiya
4.21 (14)
Trend Plus   Trendplus  Indicator   Time Frame: Suitable for any time frame.  Purpose: Trend Prediction. Blue and red candle indicate the buy and sell call respectively. Buy: When the blue candle is formed buy call is initiated. close the buy trades when the next red candle will formed.   Sell: When the Red candle is formed Sell call is initiated. close the Sell trades when the next blue candle will formed.   Happy trade!!
FREE
This indicator has been created for finding the probable reversal points of the symbol price. A small candlestick reversal pattern is used it its operation in conjunction with a filter of extremums. The indicator is not redrawn! If the extremum filter is disabled, the indicator shows all points that have a pattern. If the extremum filter is enabled, the condition works – if the history Previous bars 1 candles back contains higher candles and they are farther than the Previous bars 2 candle, such
FREE
HMA Trend
Pavel Zamoshnikov
4.62 (84)
A trend indicator based on the Hull Moving Average (HMA) with two periods. The Hull Moving Average is an improved variant of the moving average, which shows the moment of trend reversal quite accurately. It is often used as a signal filter. Combination of two types of Hull Moving Averages makes a better use of these advantages: HMA with a slow period identifies the trend, while HMA with a fast period determines the short-term movements and signals in the trend direction. Features The movement
FREE
Power Trend Free - the indicator shows the trend strength in the selected period. Input Parameters The indicator has three input parameters: Period - a positive number greater than one, it shows the number of candlesticks used for calculations. If you enter one or zero, there will be no error, but the indicator will not be drawn. Applied Price - the standard "Apply to:" set meaning data used for the indicator calculation: Close - Close prices; Open - Open prices; High - High prices; Low - Low
FREE
Индикатор Candle Body Histogram отображается в отдельном окне и показывает размер тела каждой свечи в виде гистограммы. В зависимости от того растёт свеча на графике или снижается, гистограмма меняет свой цвет. Свечи "доджи", у которых совпадают цены открытия и закрытия, так же отображаются на гистограмме отдельным цветом.  Поскольку индикатор строится от нулевого значения, он позволяет визуально сравнить тела свечей относительно друг друга. На гистограмме можно разместить уровни, чтобы отслежив
FREE
The indicator rely on The Toby strategy >> The mother candle which is bigger in range than the previous six candles. A vertical line shows the last Toby Candle with the targets shown up and down. The strategy is about the closing price out of the range of the toby candle to reach the 3 targets..The most probable to be hit is target1 so ensure reserving your profits and managing your stop lose.
FREE
This indicator will mirror the assets in use in another metatrader, being able to choose the timeframe and a template. This is the Metatrader 4 Client, it needs the Metatrader 4 or 5 Server versions: Metatrader 4 Mirror Chart Server: https://www.mql5.com/en/market/product/88644 Metatrader 5 Mirror Chart Server:   https://www.mql5.com/en/market/product/88652 Details of how it works in the video.
FREE
MACD indicator in MetaTrader 4/5 looks different than MACD does in most other charting software. That is because the MetaTrader 4/5 version of MACD displays the MACD line as a histogram when it is traditionally displayed as a line. Additionally, the MetaTrader 4/5 version computes the Signal line using an SMA, while according to MACD definition it is supposed to be an EMA. The MetaTrader 4/5 version also does not compute a true MACD Histogram (the difference between the MACD/Signal lines). This
FREE
OsMA Arrow
Pavel Shutovskiy
4.36 (11)
The indicator displays crossing zero level by Moving Average of Oscillator (OsMA) in the form of arrows. The indicator notifies about a signal by means of a pop-up Alert window, or sending notification to e-mail. Parameters Fast EMA Period - fast EMA. This is an exponential moving average from a price with a short period. Slow EMA Period - slow EMA. This is also an exponential moving average of a market price but with a longer period. Signal SMA Period - MACD SMA. This is a signal line which i
FREE
Wicks UpDown Target GJ Wicks UpDown Target GJ is specialized in GJ forex pairs. Choppy movement up and down on the opening range every day.  Trading breakouts on London session and New York session is recommended. Guideline Entry Strategy Idea: Step 1 - Breakout Forming (Warning! Trade on London Session and New York Session) Step 2 - Breakout Starting (Take Action on your trading plan) Step 3 - Partial Close your order & set breakeven (no-risk) Step 4 - Target complete Step 5 - Don't tr
FREE
This is a regression tree indicator for MT4/MT5. This indicator classificate nodes on the time period so that the deviation becomes smaller, and displays regression line and channel for each node. It's free! Attached CartDemo.ex4 and CartDemo.ex5 is a Demo version and has the following limitations: Method is RandomForest only Maximum number of bars is 200 Maximum number of trees is 2 Maximum tree depth is 2 Calculated waste lines are shown Not display correlation coefficients Fu
FREE
This indicator alerts you when/before new 1 or 5 minute bar candle formed. In other words,this indicator alerts you every 1/5 minutes. This indicator is especially useful for traders who trade when new bars formed. *This indicator don't work propery in strategy tester.Use this in live trading to check functionality. There is more powerful Pro version .In Pro version,you can choose more timeframe and so on. Input Parameters Alert_Or_Sound =Sound ----- Choose alert or sound or both to not
FREE
Are you tired of drawing trendlines every time you're analyzing charts? Or perhaps you would like more consistency in your technical analysis. Then this is for you. This indicator will draw trend lines automatically when dropped on a chart. How it works Works similar to standard deviation channel found on mt4 and mt5. It has 2 parameters: 1. Starting Bar 2. Number of bars for calculation The   starting bar   is the bar which drawing of the trend lines will begin, while the   number of bars for c
FREE
Heiken Ashi Button Heiken-Ashi , often spelled Heikin-Ashi, is a Japanese word that means "Average Bar." The Heiken-Ashi approach can be used in conjunction with candlestick charts to spot market trends and forecast future prices. It's useful for making candlestick charts easier to read and analysing patterns. Traders can use Heiken-Ashi charts to determine when to stay in trades while the trend continues and close trades when the trend reverses. The majority of earnings are made when markets a
FREE
SpectorMA
Sergii Krasnyi
5 (1)
このインディケータは、チャートのビジュアルを向上させるだけでなく、チャートに躍動感やダイナミックさを与えます。このインジケータは、1つまたは複数の移動平均(MA)インジケータを組み合わ せたもので、常に色が変化し、カラフルで興味深い外観を作り出します。 この製品はグラフィカルなソリューションであるため、テキストでその機能を説明することは困難です。 このインジケーターは、ビデオ編集用にチャートの美しい画像を作成したいブロガーや、チャートを生き生きとカラフルにしたいトレーダーに適しています。 MAラインのカラーパレットは、虹のように変化したり、ランダムに変化したりします(設定したパラメータによる)。MAインジケータは、「MA期間」パラメータのステップを維持することで、独立に並び、美しい画像を作成します。 また、このインジケーターにはMA期間を常に変更する機能があり、チャートに活気とダイナミズムの効果を作り出すことができます。 ご清聴ありがとうございました。 ご清聴ありがとうございました。
FREE
Stat Monitor is a good information indicator. Benefits of the indicator: The indicator provides useful information - the current spread, the cost of one lot of the symbol, trading leverage and the recommended lot size for trading. You can use the indicator on the MetaTrader 4 trading platform of any broker. The indicator provides useful information. Version of the Stat Monitor indicator for MetaTrader 5 I wish you all good luck in trading and stable profit!
FREE
Rainbow MT4 is a technical indicator based on Moving average with period 34 and very easy to use. When price crosses above MA and MA changes color to green, it’s a signal to buy. When price crosses below MA and MA changes color to red, it’s a signal to sell. The Expert advisor ( Rainbow EA MT4) based on Rainbow MT4 indicator, as you can see in the short video below is now available here .
FREE
精密な取引分析を指先で:次世代取引分析ソフトウェア 市場に出回っている一般的な取引分析ソフトウェアは、時間別または週別の損益率統計のみを提供することが多く、より正確な取引分析のニーズを満たしていません。しかし、実際の取引市場では、毎日が独自の状況を呈しています。月曜日は静かで、水曜日は3倍のオーバーナイト金利で活発になり、金曜日は重要なデータ発表で非常に活発になります。明らかに、毎日統計分析を行うことは科学的ではなく、週単位で分析する方が理にかなっています。しかし、週足チャートは各日の統計的な状況のみを示しており、時間ごとの変化を捉えることができません。さらに、特定の銘柄は、ロングポジションとショートポジションで大きな違いを示すため、個別の分析が必要ですが、これは現在の取引分析ソフトウェアには欠けています。 時間単位が粗すぎることに加えて、既存の取引分析ソフトウェアは、戦略のフィルタリングの点でも不足しています。銘柄名のみでフィルタリングを行うことは、1つの銘柄で複数の戦略が同時に実行されている可能性があるため、科学的ではありません。同様に、マジックナンバーのみを頼りにフィルタリ
FREE
PREVIOUS INDICATOR’S DATA MA CROSSOVER https://www.mql5.com/en/users/earobotkk/seller#products P/S: If you like this indicator, please rate it with 5 stars in the review section, this will increase its popularity so that other users will be benefited from using it. This indicator notifies and draws an arrow on the chart whenever    the MA line has crossed over its previous indicator’s data MA filtered by MA Trend.   It also displays total pips gained from all the entry set-ups. Setting ·   You
FREE
The indicator analyzes the volume scale and splits it into two components - seller volumes and buyer volumes, and also calculates the delta and cumulative delta. The indicator does not flicker or redraw, its calculation and plotting are performed fairly quickly, while using the data from the smaller (relative to the current) periods. The indicator operation modes can be switched using the Mode input variable: Buy - display only the buyer volumes. Sell - display only the seller volumes. BuySell -
FREE
NearONE
Vasiliy Anokhin
5 (2)
NearONE displays the average value of the price deviation in points for a specified period in a subwindow of a selected trading instrument. Inputs : DRAWs - number of bars to display the indicator; NearPeriod - indicator period. If NearPeriod is 0 , recommended periods are used for each chart timeframe. If NearPeriod = 0: M1 timeframe - period = 60 ; M5 timeframe - period = 48 ; M15 timeframe - period = 96 ; M30 timeframe - period = 192 ; H1 timeframe - period = 96 ; H4 timeframe - period
FREE
Identify Trend
Aleksey Ivanov
4.25 (32)
トレンドの識別インジケータを使用すると、非常に正確に、そして最も重要なこととして、わずかな遅延で、(1)真のトレンドの動きの開始、および(2)フラットを識別できます。このような指標は、スキャルパー戦略による取引と長期取引戦略の使用の両方に使用できます。インディケーター操作アルゴリズムは、最後のスクリーンショットで詳しく説明されています。                              指標の読みは視覚的で非常に単純で、コメントを必要としません。インディケータの青い線は上昇トレンドを表し、金色の線はフラット、そして赤い線は下降トレンドです。したがって、赤または金の線が青に置き換えられた場合はBuyのエントリポイント、青または金の線が赤に置き換えられた場合はSell   - のエントリポイントです。               このインディケータにはあらゆる種類の警告があります。(トレンド方向の)インジケーターの表示が最後の2つのバーに一致すると、アラートがアクティブになります。                価格の動きの方向が変化する可能性のある瞬間も
FREE
Trend arrow Indicator is an arrow Indicator used as an assistant tool for your trading strategy. The indicator analyzes the standard deviation of bar close for a given period and generates a buy or sell signals if the deviation increases. It good to combo with Martingale EA to follow Trend and Sellect Buy Only/Sell Only for EA work Semi-Automatic. You can use this  Indicator with any EAs in my Products.
FREE
This indicator displays RVI indicator signals. The main point of Relative Vigor Index Technical Indicator (RVI) is that on the bull market the closing price is, as a rule, higher, than the opening price. It is the other way round on the bear market. So the idea behind Relative Vigor Index is that the vigor, or energy, of the move is thus established by where the prices end up at the close. To normalize the index to the daily trading range, divide the change of price by the maximum range of price
FREE
VolumeBar
Dmitry Iglakov
3.71 (7)
This indicator displays each bar's volume (visible range) in points. The display parameters are customizable. The indicator was developed for personal use (chart analysis). Parameters: ColorL - color of text labels. Position - label position: 0 - below, 1 - above. FontSize - font size. ANGLE - text slope angle.
FREE
Basic Supply Demand
Mehran Sepah Mansoor
4.6 (5)
基本的な需給インジケータは、あなたの市場分析を強化し、あらゆるチャート上の重要な機会領域を特定するために設計された強力なツールです。直感的で使いやすいインターフェイスで、この無料のメタトレーダー用インディケータは、需給ゾーンを明確に表示し、より多くの情報に基づいた正確な取引判断を可能にします /  MT5無料版 この指標のダッシュボードスキャナー: ( Basic Supply Demand Dashboard ) 特徴 チャートの需給ゾーンを自動的にスキャンし、面倒な手動分析を不要にします。 直近の需給ゾーンまでの残り距離をグラフィカルに表示 供給ゾーンは特徴的な色で強調表示され、需要ゾーンは別の色で表示されるため、迅速かつ正確な解釈が可能。 このインディケータは、最も近い供給ゾーンまたは需要ゾーンとチャート上の現在価格との距離をpips単位で自動的に計算し、明確かつ定量的な指標を提供します。pips単位の距離はチャート上にはっきりと見やすく表示され、現在価 格との距離が大きい、または小さいエリアを素早く特定できます。 需給ゾーンの接近やブレイクを警告 どのタイムフレームで
FREE
Super Trend Ind
Alexander Chertnik
4.8 (46)
Super Trend Indicator uses two moving averages for calculating the trend direction.  Combination with other market signals and analysis is necessary and provides more stable results. Indicator can be easily customized by the user including change of colors, with and arrow sizes. FREE   Super Trend Expert Advisor >  https://www.mql5.com/en/market/product/81160?source=Site +Profile+Seller developed, tested and optimized   on "   VantageMarkets   "  platform. Recommended broker > Vantage
FREE
iMACD in iMA is indicator to change color in iMA if iMACD is upper of zero (up trend) or lower of zero (down trend). It is a useful tool to track when the upside and the downside iMACD on iMA. You can to get source code from here . Parameters MA_Periods — Period for iMA. MA_Method — Method for iMA. MACD_FastEMA — Fast EMA for MACD. MACD_SlowEMA — Slow EMA for MACD. MACD_SignalSMA — SMA signal for MACD. MACD_ApliedPrice — Price used for MACD. BarsCount — How many bars will show the line. Reve
FREE
MASi Three Screens is based on the trading strategy by Dr. Alexander Elder. This indicator is a collection of algorithms. Algorithms are based on the analysis of charts of several timeframes. You can apply any of the provided algorithms. List of versions of algorithms:     ThreeScreens v1.0 - A simple implementation, with analysis of the MACD line;     ThreeScreens v1.1 - A simple implementation, with analysis of the MACD histogram;     ThreeScreens v1.2 - Combines the first two algorithms
FREE
このプロダクトを購入した人は以下も購入しています
Gann Made Easy は、ミスター・ギャンの理論を使用した取引の最良の原則に基づいた、プロフェッショナルで使いやすい外国為替取引システムです。 W・D・ガン。このインジケーターは、ストップロスとテイクプロフィットレベルを含む正確な買いと売りのシグナルを提供します。 PUSH通知を利用して外出先でも取引可能です。 購入後はご連絡ください!私の取引のヒントと素晴らしいボーナスインジケーターを無料で共有します! おそらく、ギャンの取引手法についてはすでに何度も聞いたことがあるでしょう。通常、ギャンの理論は初心者のトレーダーだけでなく、すでにある程度の取引経験がある人にとっても非常に複雑なものです。なぜなら、ギャンの取引手法は理論的にはそれほど簡単に適用できるものではないからです。私はその知識を磨き、最良の原則を私の外国為替インジケーターに組み込むために数年を費やしました。 このインジケーターは非常に簡単に適用できます。必要なのは、それをチャートに添付し、簡単な取引推奨事項に従うだけです。このインジケーターは常に市場分析の仕事を行い、取引の機会を探します。適切なエントリーポイントを検出
Gold Stuff
Vasiliy Strukov
4.9 (269)
Gold Stuff は、金専用に設計されたトレンド指標であり、あらゆる金融商品にも使用できます。 インジケーターは再描画せず、遅れません。 推奨時間枠 H1. それインディケータでフルオートExpert Advisor EA Gold Stuffが動作します。 あなたは私のプロフィールでそれを見つけることができます. 設定と個人的なボーナスを得るために、購入後すぐに私に連絡してください! トレンド スキャナーの強力なサポートを利用して、無料のインジケーターを入手し、プライバシーを守ります。あーみー!   設定 矢印を描く - オンオフ。 チャートに矢印を描く。 アラート - 可聴アラートのオンオフ。 メール通知 - オンオフ。 電子メール通知。 プチ通知 - オンオフ。 プッシュ通知。 次に、色域を調整します。 Gold Stuff は、金専用に設計されたトレンド指標であり、あらゆる金融商品にも使用できます。 インジケーターは再描画せず、遅れません。 推奨時間枠 H1. それインディケータでフルオートExpert Advisor EA Gold Stuff
まず第一に、この取引インジケーターは再描画されず、再描画されず、遅延しないことを強調する価値があります。これにより、手動取引とロボット取引の両方に理想的なものになります。 ユーザーマニュアル:設定、入力、戦略。 アトミックアナリストは、価格の強さとモメンタムを利用して市場でより良いエッジを見つけるためのPA価格アクションインジケーターです。ノイズや誤ったシグナルを除去し、取引ポテンシャルを高めるための高度なフィルターを備えています。複雑なインジケーターの複数のレイヤーを使用して、アトミックアナリストはチャートをスキャンし、複雑な数学的計算をシンプルなシグナルと色に変換します。これにより、どのような初心者トレーダーでも理解して使用し、一貫した取引の決定を行うことができます。 「アトミックアナリスト」は、新規および経験豊富なトレーダー向けにカスタマイズされた包括的な取引ソリューションです。プレミアムインジケーターとトップノッチの機能を1つの取引戦略に組み合わせ、すべてのタイプのトレーダーにとって汎用性のある選択肢にします。 デイリートレーディングとスキャルピング戦略:高
Please contact me after purchase to immediately get your PDF strategy + documentation for Trend Pulse !  Official release price of $89  ( 3 /50 copies left). Next price is $199 . Introducing Trend Pulse , a unique and robust indicator capable of detecting bullish, bearish, and even ranging trends! Trend Pulse uses a special algorithm to filter out market noise with real precision. If the current symbol is moving sideways, Trend Pulse will send you a ranging signal, letting you know that it
An exclusive indicator that utilizes an innovative algorithm to swiftly and accurately determine the market trend. The indicator automatically calculates opening, closing, and profit levels, providing detailed trading statistics. With these features, you can choose the most appropriate trading instrument for the current market conditions. Additionally, you can easily integrate your own arrow indicators into Scalper Inside Pro to quickly evaluate their statistics and profitability. Scalper Inside
Trend Punch
Mohamed Hassan
4.91 (22)
This indicator is unstoppable when combined with our other indicator called  Support & Resistance . After purchase, send us a message and you will get it   for  FREE as a BONUS! Introducing Trend Punch , the revolutionary forex trend indicator that will transform the way you trade! Trend Punch is uniquely designed to provide precise buy and sell arrows during strong market trends, making your trading decisions clearer and more confident. Whether you're trading major currency pairs or exotic sym
現在26%オフ 初心者やエキスパートトレーダーに最適なソリューション! このインジケーターは、独自の機能と新しい計算式を取り入れた、ユニークで高品質、かつ手頃な価格のトレーディングツールです。たった1枚のチャートで28の為替ペアの通貨強度を読み取ることができます。新しいトレンドやスキャルピングチャンスの引き金となるポイントを正確に特定することができるので、あなたのトレードがどのように改善されるか想像してみてください。 ユーザーマニュアルはこちら  https://www.mql5.com/en/blogs/post/697384 これが最初の1本、オリジナルだ! 価値のないクローンを買わないでください。 特別な サブウィンドウの矢印で強い通貨の勢いを表示 GAPがあなたのトレードを導く! 基準通貨や気配値が売られすぎ・買われすぎのゾーン(外相フィボナッチレベル)にあるとき、個別チャートのメインウィンドウに警告表示。 通貨がレンジの外側から反落した場合、プルバック/リバーサルのアラート。 クロスパターンの特別なアラート 複数の時間枠を選択可能で、トレンドを素早く
現在31%オフ! 初心者やエキスパートトレーダーに最適なソリューション! このインジケータは、独自の機能と秘密の数式を組み込んだ、ユニークで高品質かつ手頃な価格のトレーディングツールです。たった1枚のチャートで28の通貨ペアのアラートを表示します。新しいトレンドやスキャルピングチャンスの引き金となるポイントを正確に把握することができるので、あなたのトレードがどのように改善されるか想像してみてください! 新しい基本的なアルゴリズムに基づいて構築されているため、潜在的な取引の特定と確認がより簡単になります。これは、通貨の強さや弱さが加速しているかどうかをグラフィカルに表示し、その加速のスピードを測定するためです。加速すると物事は明らかに速く進みますが、これはFX市場でも同じです。つまり、反対方向に加速している通貨をペアにすれば、利益を生む可能性のある取引を特定することができるのです。 通貨の勢いを示す縦の線と矢印は、あなたの取引の指針となるでしょう。 ダイナミックマーケットフィボナッチ23レベルはアラートトリガーとして使用され、市場の動きに適応します。もしインパルスが黄色
PZ Day Trading
PZ TRADING SLU
3.67 (3)
このインディケータは、価格アクション分析とドンチャンチャネルのみを使用して、ジグザグ方式で価格の反転を検出します。再描画やバックペインティングを一切行わずに、短期取引向けに特別に設計されています。それは彼らの操作のタイミングを増やすことを目指している賢明なトレーダーにとって素晴らしいツールです。 [ インストールガイド | 更新ガイド | トラブルシューティング | よくある質問 | すべての製品 ] 驚くほど簡単に取引できます すべての時間枠で価値を提供します 自己分析統計を実装します 電子メール/音声/視覚アラートを実装します 可変長のブレイクアウトと混雑ゾーンに基づいて、インディケータは価格アクションのみを使用して取引を選択し、市場が非常に高速に行っていることに反応します。 過去のシグナルの潜在的な利益が表示されます この指標は、独自の品質とパフォーマンスを分析します 負けブレイクアウトは強調表示され、説明されます インジケータは、非バックペインティングおよび非再ペイントです この指標は、日中のトレーダーが単一の価格反転を見逃さないようにするのに役立ちます。ただし、す
通貨強さウィザードは、取引を成功させるためのオールインワン ソリューションを提供する非常に強力な指標です。このインジケーターは、複数の時間枠のすべての通貨のデータを使用して、このまたはその外国為替ペアのパワーを計算します。このデータは、使いやすい通貨インデックスと通貨パワーラインの形式で表され、特定の通貨のパワーを確認するために使用できます。 必要なのは、取引したいチャートにインジケーターを接続することだけです。インジケーターは、取引する通貨の実際の強さを示します。このインジケーターは、トレンドに合わせて取引するときに有利に利用できる売買高の圧力の極値も示します。このインジケーターには、フィボナッチに基づく可能なターゲットも表示されます。 このインジケーターは、PUSH 通知を含むあらゆるタイプのアラートを提供します。 購入後ご連絡下さい。私の取引のヒントをあなたと共有し、素晴らしいボーナスインジケーターを無料で提供します! 幸せで有益な取引をお祈りします。
Enigmera
Ivan Stefanov
5 (4)
エニグメラ:市場の中核 https://www.enigmera.com はじめに このインディケータと取引システムは、金融市場に対する驚くべきアプローチです。ENIGMERAは、フラクタルサイクルを使用して、サポートとレジスタンスレベルを正確に計算します。本格的な蓄積局面を示し、方向性と目標を示します。 トレンド中でも調整中でも機能するシステムです。 どのように作動するのか? ENIGMERAは、支持線・抵抗線、目標線、乖離線の3つのラインで構成されています。このシステムは、過去のデータを現在と未来に外挿する典型的な市場指標とは異なり、現在の完全な画像を提供します。支持線上にある場合、それは本当の支持を意味し、抵抗線上にある場合、それは本当の抵抗を意味する。ある水準が破られた場合、それはトレンドの変化を意味する。再描画はしない。 市場は常に進化しているため、ENIGMERAはその評価ツールを適応させ、定期的に戦略を修正しています。  これにより、すべてのシナリオが徹底的に評価されることが保証されます。この市場指標の独自性は、その能力を見れば明らかです。  ENIGM
現在20%OFF! 初心者やエキスパートトレーダーのためのベストソリューション! このダッシュボードソフトウェアは、28の通貨ペアで動作しています。それは私達の主要な指標(高度な通貨の強さ28と高度な通貨インパルス)の2に基づいています。それは全体の外国為替市場の大きい概観を与えます。それは、すべての(9)時間枠で28の外国為替ペアのための高度な通貨の強さの値、通貨の動きの速度と信号を示しています。チャート上で1つのインディケータを使用して市場全体を観察し、トレンドやスキャルピングの機会をピンポイントで見つけることができたら、あなたのトレードがどのように改善されるか想像してみてください。 このインディケータには、強い通貨と弱い通貨の識別、潜在的な取引の識別と確認がより簡単になるような機能が搭載されています。このインディケータは、通貨の強さや弱さが増加しているか減少しているか、また、すべての時間枠でどのように機能しているかをグラフィカルに表示します。 新機能として、現在の市場環境の変化に適応するダイナミックなマーケットフィボナッチレベルが追加され、すでに当社のAdvan
Gold Channel is a volatility-based indicator, developed with a specific timing algorithm for the XAUUSD pair, which consists of finding possible corrections in the market. This indicator shows two outer lines, an inner line (retracement line) and an arrow sign, where the theory of the channel is to help identify overbought and oversold conditions in the market. The market price will generally fall between the boundaries of the channel. If prices touch or move outside the channel it is a tra
Order Block Hunter
Noha Mohamed Fathy Younes Badr
5 (1)
Order block hunter indicator is the best indicator for  hunt the order blocks that area where there has been a large concentration of limit orders waiting to be executed Order blocks are identified on a chart by observing previous price action and looking for areas where the price experienced significant movement or sudden changes in direction .This indicator does that for you by using very complicated codes and helps you to take the best areas To buy and sell because it make marks at the best a
mql5と Telegramの モーニング・ブリーフィングで、詳細とスクリーンショットを含む毎日のマーケット・アップデートをご覧 ください! FX Power MT4 NGは 、長年の人気を誇る通貨強度計FX Powerの次世代モデルです。 この次世代ストレングスメーターは何を提供するのでしょうか?初代FXパワーの魅力すべて プラス GOLD/XAUの強さ分析 より正確な計算結果 個別に設定可能な分析期間 カスタマイズ可能な計算上限値により、さらに優れたパフォーマンスを実現 もっと見たい人のための特別なマルチインスタンス設定 すべてのチャートでお好みの色を無限に設定可能 数え切れないほどの通知オプションにより、重要なことを見逃すことはありません。 Windows 11とmacOSのスタイルで角を丸くした新しいデザイン 魔法のように動くインジケーターパネル FXパワーの主な機能 すべての主要通貨の強さの完全な履歴 すべての時間枠における通貨の強さの履歴 すべてのブローカーとチャートで同一の計算結果 100%信頼できるリアルタイム計算 -> リペイントなし ドロップダウン・リストから
Scalper Vault は、スキャルピングを成功させるために必要なすべてを提供するプロフェッショナルなスキャルピング システムです。このインジケーターは、外国為替およびバイナリー オプションのトレーダーが使用できる完全な取引システムです。推奨される時間枠は M5 です。 システムは、トレンドの方向に正確な矢印シグナルを提供します。また、トップとボトムのシグナルとギャン マーケット レベルも提供します。 インジケーターは、プッシュ通知を含むすべてのタイプのアラートを提供します。 インジケータの購入後にご連絡ください。私の個人的な取引の推奨事項と素晴らしいボーナス指標を無料で共有します! 幸せで有益な取引をお祈りします!
まず第一に、この取引ツールはノンリペイント、ノンリドロー、ノンラグの指標であり、プロの取引に理想的ですことを強調する価値があります。 オンラインコース、ユーザーマニュアル、デモ。 スマートプライスアクションコンセプトインジケーターは、新米から経験豊富なトレーダーまで、非常 に強力なツールです。Inner Circle Trader AnalysisやSmart Money Concepts Trading Strategiesなど、20以上の有用な指標を1つに組み合わせています。このインジケーターはスマートマネーコンセプトに焦点を当て、大手機関の取引方法を提供し、彼らの動きを予測するのに役立ちます。 特に、流動性分析に優れており、機関がどのように取引しているかを理解しやすくしています。市場のトレンドを予測し、価格の動きを慎重に分析するのに優れています。機関の戦略とトレードを合わせることで、市場の動向についてより正確な予測ができます。このインジケーターは多目的であり、市場構造を分析し、重要な注文ブロックを特定し、さまざまなパターンを認識するのに優れています。 このインジケー
Advanced Supply Demand
Bernhard Schweigert
4.9 (314)
現在33%オフ 初心者にもエキスパートトレーダーにも最適なソリューション このインジケーターは独自の機能と新しい公式を多数内蔵しており、ユニークで高品質かつ手頃な取引ツールです。このアップデートでは、2つの時間枠ゾーンを表示できるようになります。より長いTFだけでなく、チャートTFとより長いTF(ネストゾーンを表示)の両方を表示できます。すべてのSupply Demandトレーダーの皆さんのお気に召すはずです。:) 重要情報の公開 Advanced Supply Demandの可能性を最大化するには、 https://www.mql5.com/ja/blogs/post/720245 にアクセスしてください。   エントリーまたはターゲットの正確なトリガーポイントを正確に特定できれば取引がどのように改善されるか想像してみてください。新しい基盤となるアルゴリズムに基づいて構築されているため、買い手と売り手の間の潜在的な不均衡をさらに簡単に特定できます。これは、最も強い需要と供給のゾーンと、過去のパフォーマンス(古いゾーンを表示)がグラフィカルに表現されるためです。これらの機能は、最適
- Real price is 80$ - 40% Discount ( It is 49$ now ) Contact me for instruction, any questions! Introduction The breakout and retest strategy is traded support and resistance levels. it involves price breaking through a previous level.  The break and retest strategy is designed to help traders do two main things, the first is to avoid false breakouts. Many false breakouts start with a candlestick that breaks out of a level but ends with an immediate candlestick that brings the price back into t
製品を購入する前に、以下の情報をお読みください。 Apollo Pips PLUS SP はユニークな製品です。これは、私の新しい「アポロ ピップス」インジケーターと、私のすべての取引インジケーターにアクセスできる「スーパー パック」ボーナスを手に入れたい人のためのものです。 Apollo Pips PLUS SP 製品を購入すると、実際には私の Apollo Pips インジケーターのまったく新しいバージョンを購入することになります。このバージョンのインジケーターには改良されたアルゴリズムと使いやすいパラメーターがあり、あらゆる市場およびあらゆる取引スタイルでインジケーターを使用する機会が得られます。 この製品の購入者は、私のスーパーボーナスとして、他のすべてのインジケーターにも無料でアクセスできます!私のすべての取引ツールにアクセスしたい場合は、この製品が最適です!:) しかし、これがすべてではありません!:) この製品のすべての購入者は、私の新しいインジケーターを無料で入手する資格もあります!:)新しい取引インジケーターを利用できるようになりました。私の特権のある「スーパー パッ
今、147ドル(いくつかの更新後に499ドルに増加します) - 無制限のアカウント(PCSまたはMac) RelicusRoad ユーザー マニュアル + トレーニング ビデオ + プライベート Discord グループへのアクセス + VIP ステータス 市場の新しい見方 RelicusRoad は、外国為替、先物、暗号通貨、株式、および指数の世界で最も強力な取引インジケーターであり、トレーダーに収益を維持するために必要なすべての情報とツールを提供します。初心者から上級者まで、すべてのトレーダーが成功するためのテクニカル分析と取引計画を提供します。これは、将来の市場を予測するのに十分な情報を提供する重要な取引指標です。意味をなさないチャート上のいくつかの異なる指標ではなく、完全な解決策を信じています.これは、信号、矢印 + 価格アクション情報を表示するオールインワンのインジケーターで、他に類を見ない非常に正確です。 強力な AI に基づいて、RelicusRoad は不足している情報とツールを提供して、あなたを教育し、トレーディングのプロ、成功したトレーダーにします。
カスタムMT4インジケーターで外国為替取引を成功させるための秘密を発見してください! 外国為替市場で成功を達成し、リスクを最小限に抑えながら一貫して利益を得る方法を疑問に思ったことはありますか? これがあなたが探している答えです! 取引へのアプローチに革命をもたらす独自のMT4インジケーターを導入できるようにします。 ユニークな汎用性 私たちのインジケータは、RenkoとRangeBarのろうそくのフォーメーションを好むユーザー向けに特別に設計されています。 これらのチャートタイプは多くの経験豊富なトレーダーに好まれていることを理解しています。そのため、私たちのインジケーターはそれらとシームレスに統合され、比類のない市場分析を提供します。 クリアトレンドシグナル 複雑な分析を忘れてください! 私たちのインジケーターは、鮮やかな色と明確なドット構造を利用して、市場の動向を明確に示しています。 赤と青の点は、価格の動きの方向性について疑いの余地がなく、取引の迅速な意思決定を可能にします。 HH/HL HL/LL戦略とのアライメント HH/HLおよびHL/LL構
Automated Trendlines
Georgios Kalomoiropoulos
5 (17)
トレンドラインは、外国為替取引におけるテクニカル分析の最も重要なツールです。残念ながら、ほとんどのトレーダーはそれらを正しく描画していません。自動トレンドラインインジケーターは、市場のトレンドの動きを視覚化するのに役立つ本格的なトレーダー向けのプロフェッショナルツールです。 トレンドラインには、強気トレンドラインと弱気トレンドラインの2種類があります。 上昇トレンドでは、外国為替トレンドラインは価格変動の最低スイングポイントを介して描画されます。 少なくとも2つの「最低安値」を接続すると、トレンドラインが作成されます。 下降トレンドでは、トレンドラインは価格変動の最も高いスイングポイントを介して描画されます。 少なくとも2つの「最高値」を接続すると、トレンドラインが作成されます。 トレンドラインが壊れたとき? 弱気のろうそくが強気のトレンドラインの下で閉じ、ろうそくの高さがトレンドラインの上にあるとき、強気のトレンドラインは壊れます。 強気のろうそくが弱気のトレンドラインの上で閉じ、ろうそくの安値がトレンドラインの下にあるとき、弱気のトレ
M1 Arrow
Oleg Rodin
4.73 (15)
市場の2つの基本原則に基づく日中戦略。 このアルゴリズムは、追加のフィルターを使用したボリュームと価格の波の分析に基づいています。インディケータのインテリジェントアルゴリズムは、2つの市場要因が1つに結合した場合にのみシグナルを出します。インディケータは、より高い時間枠のデータを使用して、M1チャート上の特定の範囲の波を計算します。そして波を確認するために、インジケーターはボリュームによる分析を使用します。 このインディケータはレディトレーディングシステムです。トレーダーが必要とするのは、信号に従うことだけです。また、インジケーターはあなた自身の取引システムの基礎になることができます。取引はミニッツチャートでのみ行われます。 インジケーターがMTFの原則を使用しているという事実にもかかわらず、インジケーターのアルゴリズムは可能な限り安定しています。 購入後、必ず私に書いてください!私の取引設定と推奨事項をあなたと共有します!
IX Powerは 、FX Powerの無敵の精度をついにFX以外のシンボルにも提供します。 お気に入りの指数、株式、コモディティ、ETF、さらには暗号通貨の短期、中期、長期のトレンドの強さを正確に判断します。 お使いの端末が提供する すべてを分析する ことができます。ぜひお試しいただき、取引 タイミングが大幅に改善 されることをご体験ください。 IXパワーの主な特徴 100%正確で再描画されない計算結果 - ターミナルで利用可能なすべての取引シンボルに対して 予め設定され、さらに個別に設定可能な強度分析期間のドロップダウン選択 Eメール、メッセージ、モバイル通知による無数の通知オプション EAリクエストのためのアクセス可能なバッファ カスタマイズ可能な計算制限により、さらに優れたパフォーマンスを実現 もっと見たい人のための特別なマルチインスタンス設定 すべてのチャートでお好みの色を無限に設定可能 Windows 11とmacOSのスタイルで角を丸くした新しいパネルデザイン サブ・ウィンドウとメイン・チャートの間をシームレスに移動する、魔法のように動く
Italo Trend Indicator
Italo Santana Gomes
4.79 (38)
BUY INDICATOR AND GET EA FOR FREE AS A BONUS + SOME OTHER GIFTS! ITALO TREND INDICATOR  is the best trend indicator on the market, the Indicator works on all time-frames and assets, indicator built after 7 years of experience on forex and many other markets. You know many trend indicators around the internet are not complete, does not help, and it's difficult to trade, but the Italo Trend Indicator is different , the Italo Trend Indicator shows the signal to buy or sell, to confirm the signal t
Break and Retest
Mohamed Hassan
4.12 (17)
This Indicator only places quality trades when the market is really in your favor with a clear break and retest. Patience is key with this price action strategy! If you want more alert signals per day, you increase the number next to the parameter called: Support & Resistance Sensitivity.  After many months of hard work and dedication, we are extremely proud to present you our  Break and Retest price action indicator created from scratch. One of the most complex indicators that we made with ove
Trend Screener
STE S.S.COMPANY
4.82 (93)
トレンドインジケーター、1つのツールに組み込まれたすべての重要なトレンド機能を備えたトレンドトレーディングとフィルタリングのための画期的なユニークなソリューション! これは、すべてのシンボル/商品(外国為替、商品、暗号通貨、インデックス、株式)で使用できる100%再描画されていないマルチタイムフレームおよびマルチ通貨インジケーターです。 トレンドスクリーナーは、チャート内のドットで矢印トレンドシグナルを提供するインジケーターに続く効率的なインジケーターです。 トレンド分析インジケーターで使用できる機能: 1.トレンドスキャナー。 2.最大利益分析を備えたトレンドライン。 3.トレンド通貨強度メーター。 4.アラート付きのトレンド反転ドット。 5.アラート付きの強いトレンドドット。 6.トレンド矢印 毎日の分析例、毎日のシグナルパフォーマンス...など、トレンドスクリーナーインジケーターを使用して、ここで見つけることができます: ここをクリックしてください 期間限定オファー:トレンドスクリーナーインジケーターは、50ドルと生涯でのみご利用いただけます。 (元の価格125 $) MQ
複数通貨と複数フレームの売買に関するアラート。 自動トレーリングストップとリスク報酬で利益を獲得! インジケーターが市場をスキャンして分析するため、何もする必要はありません。 1 つのチャートですべての通貨を取引しましょう!   購入後、コメントを残して私に連絡してください。トレードアシスタントEAをお送りします。 このインジケーターはいくつかのオシレーターと付属のフィルターを使用して、最良の確認されたエントリーポイントを見つけますので、それについて心配する必要はありません。 警告が表示され、監視することを選択したすべての時間枠と通貨のボタンが描画されます。 ボタンを押すだけでチャートに移動し、取引を開始できます。 このインジケーターは、すべての基本通貨と市場監視通貨の強さパネルも描画します (設定で調整可能)。これにより、すべてのペアの通貨と選択されたより高い時間枠が表示されます。 インジケーターウィンドウ: チャート通貨のトレンドフィルターとマルチタイムフレームトレンドパネルを備えた特別なMACDヒストグラム! すべての通貨と時間枠の取引アラートを提供し、
Reversal First Impulse levels (RFI)    INSTRUCTIONS        RUS       -       ENG              R ecommended to use with an indicator   -   TPSpro  TREND PRO -  Version MT5 A key element in trading is zones or levels from which decisions to buy or sell a trading instrument are made. Despite attempts by major players to conceal their presence in the market, they inevitably leave traces. Our task was to learn how to identify these traces and interpret them correctly. Main functions: Displaying activ
作者のその他のプロダクト
Multisymbol EA
Matthieu Jean Baptiste Wambergue
5 (1)
Special summer offer! $100 instead of $250 7 strategies for an EA As indicated by his name this EA trades on several symbols. It uses strategies that have worked well since 2020 on the following symbols: GBPUSD / AUDUSD / EURJPY / CADCHF / GBPNZD / NZDUSD / GBPCHF This EA is based on price action, indicators (moving averages, RSI, MACD and others) and always follows the trend, avoiding market noise. It also performs a complete orders management based on market movements. No martingale or any o
MACD Trading MT5
Matthieu Jean Baptiste Wambergue
Automate your MACD strategy! This EA alerts and/or places orders according to MACD strategies with additional filters. It means that you can use it by 2 different ways: Receive alerts based on your MACD strategy with filters on multiple symbols simultaneously in a single chart window; Choose the fully automated mode and let EA place orders based on your MACD strategy, filter choice and money management. This EA works with all broker symbols and contains multi-symbol modes (market monitoring,
MA crossing bot
Matthieu Jean Baptiste Wambergue
5 (7)
Special summer offer! $50 instead of $80 Get the MT5 version here ! Automate your moving averages strategy! This EA alerts and/or places orders on moving averages crossovers with additional filters. It works with all broker symbols and contains multi-symbol modes (market watch, major forex pairs or symbols in the list). The default settings are for the AUDJPY pair , but you can change the settings to suit your strategy. For backtests, use ‘only_symbol_on_the_chart' mode for the 'Symbols' pa
Range Breakout Bot
Matthieu Jean Baptiste Wambergue
Get the MT5 version here ! Automate your range breakout strategy! This EA alerts and/or places orders on range breakouts with additional filters. It works with all broker symbols and contains multi-symbol modes (market watch, major forex pairs or symbols in the list). The default settings are for the EURUSD pair. The EA can also be used only as an indicator to receive range and range breakout alerts. Warning: before using this EA, please read its documentation on this page . Functionaliti
MACD Trading
Matthieu Jean Baptiste Wambergue
Get the MT5 version here ! Automate your MACD strategy! This EA alerts and/or places orders according to MACD strategies with additional filters. It means that you can use it by 2 different ways: Receive alerts based on your MACD strategy with filters on multiple symbols simultaneously in a single chart window; Choose the fully automated mode and let EA place orders based on your MACD strategy, filter choice and money management. This EA works with all broker symbols and contains multi-symbol
MA crossing bot MT5
Matthieu Jean Baptiste Wambergue
5 (5)
Special summer offer! $50 instead of $80 Get the MT4 version here ! Automate your moving averages strategy! This is the MT5 version of my best seller 'MA Crossing bot' which is available here (you can click to read reviews). This EA alerts and/or places orders on moving averages crossovers with additional filters. It works with all broker symbols and contains multi-symbol modes (market watch, major forex pairs or symbols in the list). The default settings are for the AUDJPY pair , but you c
Range Breakout Bot MT5
Matthieu Jean Baptiste Wambergue
Get the MT4 version here ! Automate your range breakout strategy! This EA alerts and/or places orders on range breakouts with additional filters. It works with all broker symbols and contains multi-symbol modes (market watch, major forex pairs or symbols in the list). The default settings are for the EURUSD pair. The EA can also be used only as an indicator to receive range and range breakout alerts. Warning: before using this EA, please read its documentation on this page . Functionaliti
フィルタ:
レビューなし
レビューに返信