Market Screener for MT4
- ユーティリティ
- Sergey Batudayev
- バージョン: 1.28
- アクティベーション: 5
このスクリーナーを使用すると、選択した期間(時間枠)内に通常よりも買われ過ぎ(成長率)または売られ過ぎ(減少率)の資産を特定できます。
市場は法律によって支配されており、より安く購入し、より高価に販売しますが、自動スキャナーがないと、たとえば今週内に、通常よりも買われ過ぎまたは売られ過ぎの通貨/株を特定することは非常に困難です。現在の時間、または月。
数十または数百の機器が存在する可能性があり、すべてを手動で分析する時間がないことが物理的に可能な場合もあります。これらの問題は、Screenerを使用して簡単に解決できます。
スクリーナーができること
- スキャナーはどのTFでも使用できます
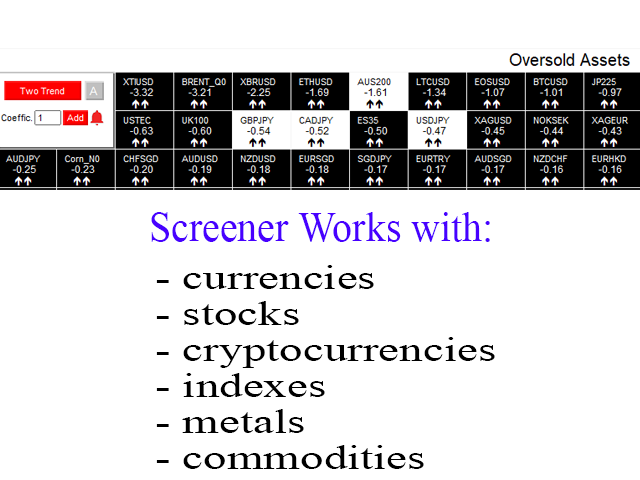
- スキャナーは、通貨、株式、暗号通貨、商品、インデックス、およびその他の機器で動作します
- 資産を特定するロジックは、市場の基本法則に基づいているため、普遍的です。
- スクリーナーの助けを借りて、あなたはさまざまな戦略に従って作業することができます、最も一般的なものの1つはポンプとダンプです
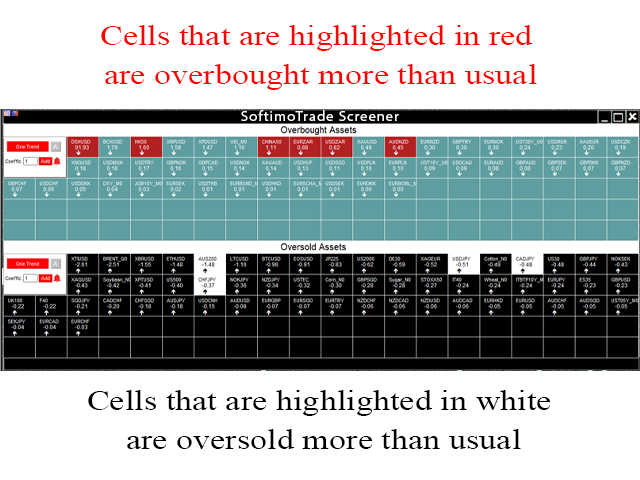
各商品の平均値を明らかにする-SoftimoTradeScreenerは、選択したTFの資産の買われ過ぎと売られ過ぎの状態を判断するだけでなく、選択した期間の価格変動の平均値も計算します。
さらに、現在の成長率または低下率が通常よりも高いすべての商品は赤色で表示されます。その後、選択した商品を個別に開いて、より詳細な分析に進むことができます。
スクリーナーを使用した戦略の変形
買われ過ぎ資産↓テーブルでは、現在の買われ過ぎ指数が通常よりも高い資産を探し、チャートに移動して資産をより詳細に分析し、興味深いエントリポイントが見つかった場合は、トレンドに沿って資産を売却します。
上向きの売られ過ぎ↑の場合、現在の売られ過ぎ指数が通常よりも高い資産を探し、チャートに移動して資産をより詳細に分析し、興味深いエントリポイントが見つかった場合は、トレンドに従って資産を購入します。
ストップロス/テイクプロフィットは、トレーディングシステムのフレームワーク内で設定されます。
より詳細な分析の一環として、レベルを検討し、選択した商品の傾向と基本的な状況を評価することなどをお勧めします。レベルと傾向を評価するには、iPumpインジケーターを使用することをお勧めします。
変数
==主な設定==
買われ過ぎテーブルの「A」ボタンを押すと、買われ過ぎの値が通常よりも高い商品のみがソートされて表示されます。これらのツールは、売り上げを見つけるのに役立ちます。
「A」ボタンのプロパティは、売られ過ぎの資産を持つテーブルと同様です。
クリックで開くテンプレートインジケーターの選択-クリックでツールを開くためのテンプレートの選択。各セルにはこのチャートを開くためのリンクがあります。iPumpインジケーターを使用して新しいテンプレートを作成し、iPumpインジケーターテンプレートに名前を付けることをお勧めします。リンクをクリックすると、インジケーターがチャートに自動的に読み込まれます。これが指示です-https://prnt.sc/sotrb7
==トレンド計算==
メイントレンドの時間枠-メイントレンドの時間枠。[1つのトレンド]ボタンを選択すると、商品はこのTFに従ってソートされます。
二次トレンド時間枠-二次トレンドの時間枠。[2つのトレンド]ボタンを選択すると、商品は二次トレンドとメイントレンドの一致に従ってソートされます。
==平均計算==
平均値のデフォルトの乗算係数-平均値のデフォルトの乗算係数。この設定の意味は、平均にこの設定で指定された数を乗算することです。これにより、現在買われ過ぎまたは売られ過ぎの資産を1.5 /で見つけることができます。 2など。時間基本的に、インデックス1よりも上昇/下降するすべての株式/通貨/暗号通貨はすでに検討の対象となっています。

Nice screener that sorts instruments by percentage changes rising and falling. Also clicking on the instruments opens the chart with templates.This provides are a better management of symbols and identify new opportunities with more ease.