• 概要
  • レビュー (1)
  • コメント (8)

NeuroScalperMT5

MT4 indicator version

https://www.mql5.com/en/market/product/72342


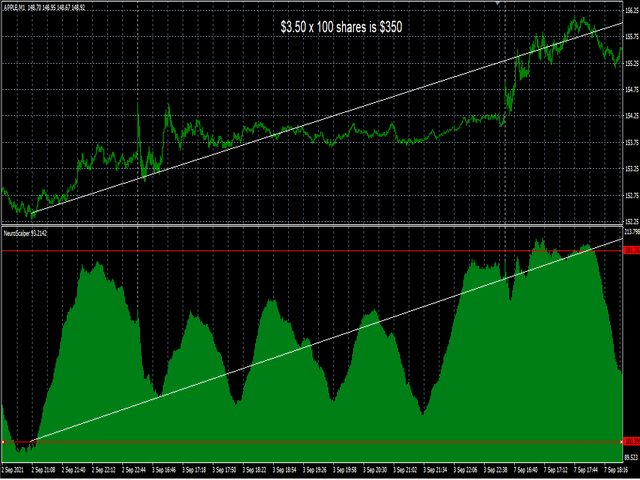
I personally use this indicator to scalp.  Accurate for accessing extremes and supports for buy positions primarily for 1 minute time frames.  Other time frames can be used but the levels are different. Its a better oscillator and compare with others to see the difference.  


Day trade using neuro network concepts.  This indicator uses elementary forms of neuro networks to generate signals to buy and sell. Use the indicator on 1 minute charts.  Indicator does not repaint.   Download and run on tester using 1 minute charts or other charts using different levels, analyze the trades to see for yourself. Many opportunities to scalp the markets.  Can be used on higher time frames but the levels should be changed according to your discretion.  Higher time frames have higher ranges.


Concept and things to consider with this model:

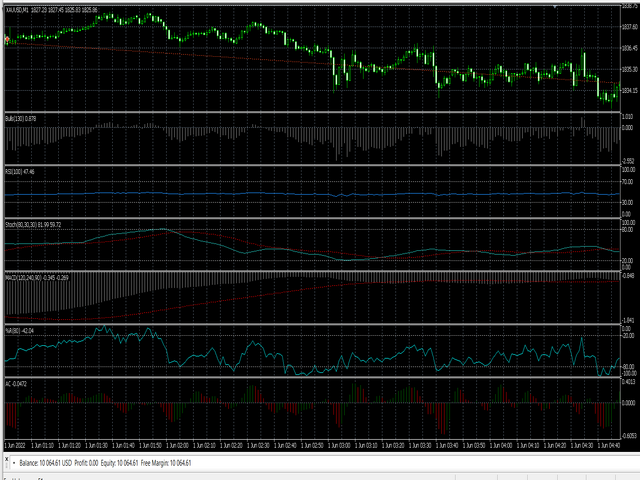
Multiple indicators are used, weights applied and 2 data points for the max an min.
This indicator is for trading uptrends mainly 
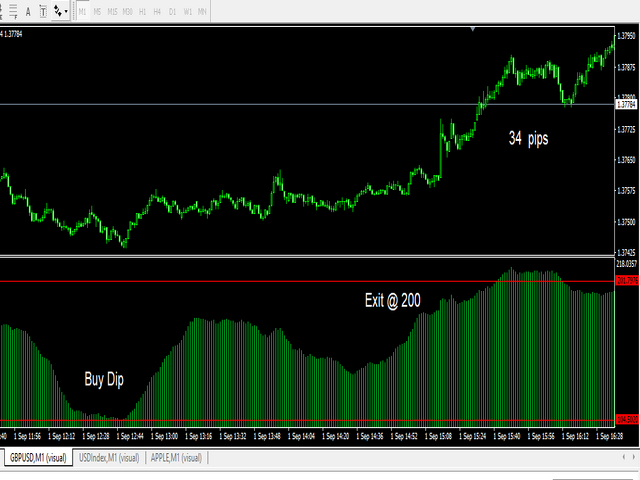
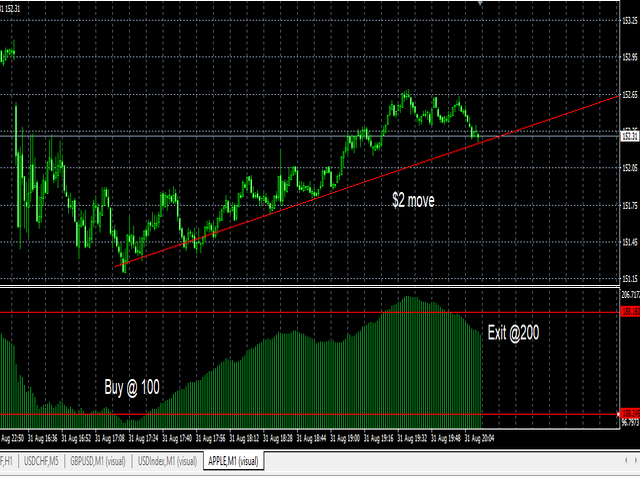
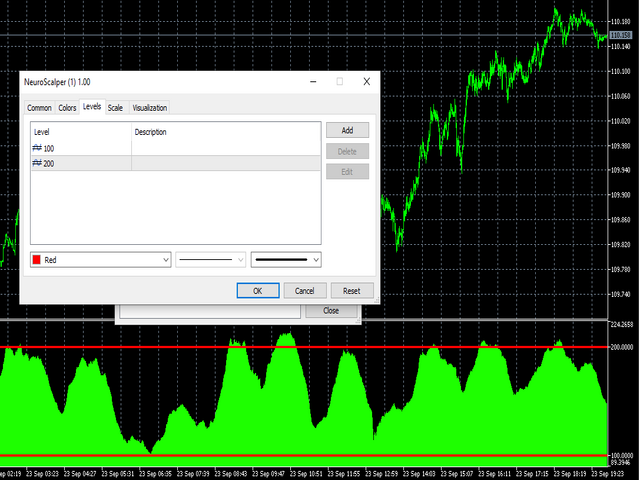
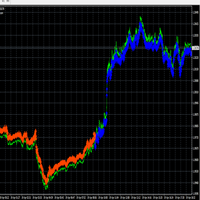
Add levels in settings(see picture) 100 and 200 for the oscillator, or other levels if using different time frames.
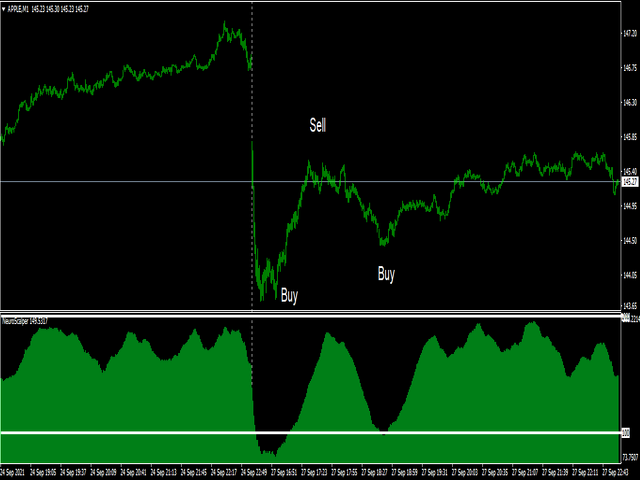
Buy when the price dips below lowest levels for the pair and time frame.  This is the cluster with good accuracy on 1 minutes.

    Rules:

    • Buy below 100 level and exit at 200.

    Download and run on tester using on the charts to see what levels are the best for buying.  Analyze the trades to see for yourself. Many opportunities to scalp the markets.


    おすすめのプロダクト
    Rainbow MT5
    Jamal El Alama
    4.33 (3)
    Description : Rainbow MT5 is a technical indicator based on Moving Average with period 34 and very easy to use. When price crosses above MA and MA changes color to green, then this is a signal to buy. When price crosses below MA and MA changes color to red, then this is a signal to sell. The Expert advisor ( Rainbow EA MT5 ) based on Rainbow MT5 indicator is now available here . MT4 version is available here .
    FREE
    Follow The Line MT5
    Oliver Gideon Amofa Appiah
    4.42 (31)
    This indicator obeys the popular maxim that: "THE TREND IS YOUR FRIEND" It paints a GREEN line for BUY and also paints a RED line for SELL. (you can change the colors). It gives alarms and alerts of all kinds. IT DOES NOT REPAINT and can be used for all currency pairs and timeframes. Yes, as easy and simple as that. Even a newbie can use it to make great and reliable trades. NB: For best results, get my other premium indicators for more powerful and reliable signals. Get them here: https://www.m
    FREE
    トレンドキャッチャー: アラートインジケーター付きのトレンドキャッチャーストラテジーは、市場トレンドやポテンシャルなエントリーポイントやエグジットポイントを特定するのに役立つ多目的な技術分析ツールです。動的なトレンドキャッチャーストラテジーを備えており、市場状況に適応してトレンドの方向を明確に視覚化します。トレーダーは、自身の好みやリスク許容度に合わせてパラメーターをカスタマイズできます。このインジケーターはトレンドの識別を支援し、ポテンシャルなリバーサルをシグナルし、トレイリングストップのメカニズムとして機能し、市場への迅速な対応のためのリアルタイムアラートを提供します。 特徴: - トレンドの識別:上昇トレンドと下降トレンドをシグナルします。 - トレンドのリバーサル:ローソク足の色が上昇から下降に変わった場合やその逆の場合に、ポテンシャルなリバーサルを警告します。 - リアルタイムアラート:新しいトレンドの識別に対するアラートを生成します。 推奨事項: - 通貨ペア:EURUSD、AUDUSD、XAUUSDなど... - タイムフレーム:H1。 - アカウン
    FREE
    Key level wedge MT5
    Presley Annais Tatenda Meck
    The   Key level wedge MT5   indicator automatically draws rising wedge pattern and falling wedge pattern for you on the chart. This pattern is really good when used as a confirmation entry at key support & resistance, supply & demand and reversal zones. Advantages  The   Key level wedge MT5   block DOES NOT RE-PAINT, giving you confidence when a signal appears and also helps when looking back.  The   Key level wedge MT5   includes an on/off button on the chart to easily keep the charts cle
    Pivot MT5
    Dmitrij Isaenko
    5 (1)
    The indicator draws daily support and resistance lines on the chart, as well as the Pivot level (reversal level). Adapted to work in MT5 The standard timeframe for calculating support and resistance levels is D1. You can choose other timeframes according to your strategy (for example, for M1-M15, the optimal timeframe for calculations is H1) The function for calculating support and resistance levels has been updated; in this calculation option, fibonacci levels are taken into account, res
    FREE
    Weis Waves
    Flavio Javier Jarabeck
    3.15 (26)
    The original author is David Weis, an expert in the Wyckoff Method. The Weis Wave is a modern adaptation of the 1930's Wyckoff Method, another expert in Tape Reading techniques and Chart Analysis. Weis Waves takes market volume and stacks it into waves according to price conditions giving the trader valuable insights about the market conditions. If you want to learn more about this subject you can find tons of videos in YouTube. Just look for "The Wickoff Method", "Weis Wave" and "Volume Spread
    FREE
    The Penta-O is a 6-point retracement harmonacci pattern which usually precedes big market movements. Penta-O patterns can expand and repaint quite a bit. To make things easier this indicator implements a twist: it waits for a donchian breakout in the right direction before signaling the trade. The end result is an otherwise repainting indicator with a very reliable trading signal. The donchian breakout period is entered as an input. [ Installation Guide | Update Guide | Troubleshooting | FAQ | A
    FREE
    BTFX Pivot Points
    Bradley Thomas Farrington
    BTFXピボットポイントは、毎日のサポートレベルとレジスタンスレベルを計算するインジケーターです。   この指標を使用することにより、ピボットレベルは目標とする明確な目標を示します。   抵抗レベルは、銀色のピボット線の上に紫色で表示されます。   サポートレベルはオレンジ色で表示され、銀色のピボットラインの下にあります。   このインジケーターは、BTFX夜明けインジケーターと一緒に使用すると非常にうまく機能します。   これらの指標の詳細については、添付のYouTubeビデオをご覧ください。   その他のお問い合わせは、メールまたはお電話にてお問い合わせください。   support@besttradesfx.co.uk   01827 842 418
    This is Gekko's Cutomized Cutomized Average Directional Index (ADX), a customized version of the famous ADX indicator. Use the regular ADX and take advantage two entry signals calculations and different ways of being alerted whenever there is potential entry or exit point. Inputs Period: Period for the ADX calculation; PlotSignalType: How will the indicator calculate entry (swing) signals: 1- ShowSwingsOnTrendLevel : Show Signals for Trend Confirmation Swings; 2- ShowSwingsOnTrendLevelDirectio
    Best SAR MT5
    Ashkan Hazegh Nikrou
    5 (1)
    説明 :  外国為替市場(PSAR)で専門的で人気のあるインジケーターの1つに基づいた新しい無料インジケーターをご紹介します。このインジケーターは元のパラボリックSARインジケーターの新しい変更です。プロSARインジケーターでは、ドットと価格チャートのクロスオーバーを見ることができます。クロスオーバーはシグナルではありませんが、動きの終わりの可能性について話します。新しい青いドットで購入を開始し、最初の青いドットの1 atr前にストップロスを配置し、最後にドットが価格チャートを横切るとすぐに終了できます。 売買シグナルを開く方法は? 最初の青い点によるオープンバイトレードと最初の赤いドットによるオープンセルトレード 正しいストップロスはどこにありますか? 安全なストップロスは最初のドットにある可能性があります(最初の青いドットの買いの場合と最初の赤い点の売りの場合) 正しいテイクプロフィットはどこにありますか? テイクプロフィットはストップロス距離とRRに基づいて調整できるので、私の提案は2 RRで、ストップロスの2倍です。 利益を上げているのにtpを達成でき
    FREE
    Are you tired of drawing trendlines every time you're analyzing charts? Or perhaps you would like more consistency in your technical analysis. Then this is for you. This indicator will draw trend lines automatically when dropped on a chart. How it works Works similar to standard deviation channel found on mt4 and mt5. It has 2 parameters: 1. Starting Bar 2. Number of bars for calculation The   starting bar   is the bar which drawing of the trend lines will begin, while the   number of bars for c
    FREE
    Donchian Channel is an indicator created by Richard Donchian. It is formed by taking the highest high and the lowest low of the last specified period in candles. The area between high and low is the channel for the chosen period. Its configuration is simple. It is possible to have the average between the upper and lower lines, plus you have alerts when price hits one side. If you have any questions or find any bugs, please contact me. Enjoy!
    FREE
    Value Chart Candlesticks
    Flavio Javier Jarabeck
    4.67 (9)
    The idea of a Value Chart indicator was presented in the very good book I read back in 2020 , " Dynamic Trading Indicators: Winning with Value Charts and Price Action Profile ", from the authors Mark Helweg and David Stendahl. The idea is simple and the result is pure genius: Present candlestick Price analysis in a detrended way! HOW TO READ THIS INDICATOR Look for Overbought and Oversold levels. Of course, you will need to test the settings a lot to find the "correct" one for your approach.
    FREE
    Donchian Pro
    Paulo Henrique Faquineli Garcia
    5 (2)
    The Donchian Channel Channels are among the most popular tools of technical analysis, as they visually convey to the analyst the limits within which most price movement tends to occur. Channel users know that valuable information can be obtained at any time, whether prices are in the central region of a band or close to one of the border lines. One of the best known techniques to explore these concepts is Bollinger Bands. However, John Bollinger was not the only one to research the applicatio
    FREE
    Free automatic Fibonacci is an indicator that automatically plots a Fibonacci retracement based on the number of bars you select on the BarsToScan setting in the indicator. The Fibonacci is automatically updated in real time as new highest and lowest values appears amongst the selected bars. You can select which level values to be displayed in the indicator settings. You can also select the color of the levels thus enabling the trader to be able to attach the indicator several times with differe
    FREE
    White Weis Volume This indicator shows the sum of the volume in each wave, bulish or bearish, as idealized by David Weis , but it brings an important addition , which is the marking of the bar with the highest volume of the wave (White Bar)! In coding the indicator, it was sought to optimize the code to require minimal processing during use and not to overload mt5. The indicator can be used for pre-trading analysis and study, where the trader analyzes possible points of support and resi
    Improved version of the free HMA Trend indicator (for MetaTrader 4) with statistical analysis. HMA Trend is a trend indicator based on the Hull Moving Average (HMA) with two periods. HMA with a slow period identifies the trend, while HMA with a fast period determines the short-term movements and signals in the trend direction. The main differences from the free version: Ability to predict the probability of a trend reversal using analysis of history data. Plotting statistical charts for analyz
    Bollinger Bands B
    Flavio Javier Jarabeck
    5 (3)
    John Bollinger created this indicator in 2010 as a way to read the original indicator (Bollinger Bands) in a more "technical" way, shown as an oscillator. The typical range of the Bollinger Bands %B is 0 - 0.5 - 1.0, where "0" represents the lower band, the "0.5" the middle band, and "1" the upper band. The line on the indicator represents the Closing prices. As simple as that. SETTINGS Bollinger Bands period of analysis Standard Deviation multiplier Shift Price type to be analyzed If you
    FREE
    Donchian Channel DC is the indicator of Donchian Channels, that plots maximum and minimum values of a specific period, besides mean value line. It´s possible to configure simple period for analysis and the indicator will plot all three values. You can trade with this indicator as trend or reversal, according to each strategy. Do not let to test others indicators as soon as others expert advisors.
    このインジケーターは、チャート上のすべての注文 (トランザクション/注文ラインにクローズ) に対して既に設定した TP および SL 値 (その通貨で) を表示し、すべての注文の利益と損失を見積もるのに大いに役立ちます。また、PIP 値も表示されます。表示されている形式は、「利益または損失の通貨値 / PIP 値」です。 TP 値は緑色で表示され、SL 値は赤色で表示されます。 ご質問や詳細については、fxlife.asia@hotmail.com で販売者にお気軽にお問い合わせください。 (そして、近日中にインジケータに追加される次の機能は、「自動または半自動の TP および SL 設定」であり、お客様は無料で更新バージョンを入手できます。よろしくお願いします。) (または、表示に何か機能を追加すべきだと思われる場合は、お気軽にお申し付けください)
    The Weis Waves RSJ Indicator sums up volumes in each wave. This is how we receive a bar chart of cumulative volumes of alternating waves. Namely the cumulative volume makes the Weis wave charts unique. It allows comparing the relation of the wave sequence characteristics, such as correspondence of the applied force (expressed in the volume) and received result (the price progress). If you still have questions, please contact me by direct message:  https://www.mql5.com/en/users/robsjunqueira/
    FREE
    Tabajara V5
    Flavio Javier Jarabeck
    4.88 (41)
    Metatrader 5 version of the famous Andre Machado's Tabajara indicator. If you don't know Andre Machado's Technical Analysis work you don't need this indicator... For those who need it and for those several friend traders who asked this porting from other platforms, here it is... FEATURES 8-period Moving Average 20-period Moving Average 50-period Moving Average 200-period Moving Average Colored candles according to the inflexion of the 20-period MA SETTINGS You can change the Period of all M
    FREE
    インディケータはチャート上にトレンドラインを描画します。このインジケーターには6つの入力があります。ユーザーは両方の行に代替ラベルを指定できます。インジケーターの複数のインスタンスが使用される場合、ラベルは異なっている必要があります。ユーザーは、線の幅と色、および使用する重要なピークを指定する深さを設定できます。たとえば、Depth = 10は、現在の山と谷を使用してトレンドラインを設定します。この山と谷は、左右に少なくとも10本のバーがあり、高/低がピークの高/低よりも小さい/大きいです。インジケーターは、以前の山と谷もペイントします。インジケーターには、価格がサポート/レジスタンスラインから事前に設定された距離にあるときにユーザーに通知するために使用できるアラート機能が追加されています。アラート距離はピップで設定されます。
    FREE
    The Half ma arrow indicator for the MetaTrader 5 trading terminal is a simple but effective tool that gives a signal about a change in the current trend. The Half ma indicator looks like a solid dynamic line that changes color at the points where the trend changes. At these points, the indicator draws arrows of the corresponding color and direction.The Half ma arrow indicator for the MT5 terminal is not an independent source of input signals. It will be most effective to use it as a trend filte
    Combining the best of Price Action , Directional Movement , and Divergence/Convergence analysis, Candle Color Trend is a easy and reliable way to identify trend direction. The indicator automatically paints the candles according to the assumption that an uptrend is defined by prices that form a series of higher highs and higher lows. In contrast, a downtrend is defined by prices that form a series of lower highs and lower lows. Additionally, ADX Wilder indicator is used to measure trend weakness
    FREE
    This z-score indicator shows the correct z-score of an asset, as it uses the normalized price data for calculation, which is the only correct way. Z-score is only applicable for normal distributed data, therefore not the actual price is considered, but the normalised returns, which were assumed to follow a normal distribution. Returns are mean reverting and assumed to follow a normal distribution, therefore z-score calculation of returns is more reliable than z-score on price, as price is NOT m
    Designed by Welles Wilder for daily commodity charts, the ADXW is now used in various markets by technical traders to assess the strength of a trend or even a trend for short- or long-term trades. The ADXW uses a positive (DI+) and negative (DI-) directional indicator in addition to its trend line (ADX). According to Wilder, a trend has strength when the ADX signal is above 25; the trend is weak (or the price has no trend) when the ADX is below 20. The absence of a trend does not mean that
    Important Lines
    Terence Gronowski
    4.88 (26)
    This indicator displays Pivot-Lines, preday high and low, preday close and the minimum and maximum of the previous hour. You just have to put this single indicator to the chart to have all these important lines, no need to setup many single indicators. Why certain lines are important Preday high and low : These are watched by traders who trade in a daily chart. Very often, if price climbs over or falls under a preday low/high there is an acceleration in buying/selling. It is a breakout out of
    FREE
    インディケータはチャート上にラウンドレベルを示します。 それらは、心理的、銀行的、または主要なプレーヤーレベルとも呼ばれます。 これらのレベルでは、強気と弱気の間に真の戦いがあり、多くの注文が蓄積され、ボラティリティの増加につながります。 インジケーターは、任意の楽器と時間枠に自動的に調整されます。 レベル80を突破してテストすると、購入します。レベル20を突破してテストすると、販売されます。ターゲットは00です。 注意。強力なサポートとレジスタンスレベルのため、価格は00レベルをわずかに下回る可能性があります。 入力パラメータ 。 Bars Count - 線の長さ 。 Show 00 Levels - 00レベルを表示するかしないか 。 Show 10, 90 Levels 。 Show 20, 80 Levels 。 Show 30, 70 Levels 。 Show 40, 60 Levels 。 Show 50 Levels 。 N Lines - チャートのレベル数を制限するパラメーター 。 Distance 00 Levels - レベル間の距離(自動または手動
    FREE
    True Day
    Aurthur Musendame
    5 (1)
    True Days is a tool designed specifically for the trader who wants to catch intraday volatility in price charts.  True day makes it easier for the trader to avoid trading in the dead zone - a period in time where markets are considered dead or non volatile. The trader can concentrate on finding opportunities only during periods of profound market movements. By default the indicator gives you a true day starting at 02:00 to 19:00 hours GMT+2. You can adjust according to your Time Zone. By deafult
    FREE
    このプロダクトを購入した人は以下も購入しています
    まず第一に、この取引インジケーターは再描画されず、再描画されず、遅延しないことを強調する価値があります。これにより、手動取引とロボット取引の両方に理想的なものになります。 ユーザーマニュアル:設定、入力、戦略。 アトミックアナリストは、価格の強さとモメンタムを利用して市場でより良いエッジを見つけるためのPA価格アクションインジケーターです。ノイズや誤ったシグナルを除去し、取引ポテンシャルを高めるための高度なフィルターを備えています。複雑なインジケーターの複数のレイヤーを使用して、アトミックアナリストはチャートをスキャンし、複雑な数学的計算をシンプルなシグナルと色に変換します。これにより、どのような初心者トレーダーでも理解して使用し、一貫した取引の決定を行うことができます。 「アトミックアナリスト」は、新規および経験豊富なトレーダー向けにカスタマイズされた包括的な取引ソリューションです。プレミアムインジケーターとトップノッチの機能を1つの取引戦略に組み合わせ、すべてのタイプのトレーダーにとって汎用性のある選択肢にします。 デイリートレーディングとスキャルピング戦略:高速で正確な
    まず第一に、このトレーディングシステムがノンリペイント、ノンリドロー、ノンラグのインジケーターであることを強調する価値がある。これにより、手動取引とロボット取引の両方に理想的なものになっています。 オンラインコース、マニュアル、プリセットのダウンロード。 「スマートトレンドトレーディングシステム MT5」は、新規および経験豊富なトレーダー向けにカスタマイズされた包括的なトレーディングソリューションです。10以上のプレミアムインジケーターを組み合わせ、7つ以上の堅実なトレーディング戦略を備えており、多様な市場状況に対応する多目的な選択肢となっています。 トレンドフォロー戦略:トレンドを効果的に乗り越えるための正確なエントリーとストップロス管理を提供します。 リバーサル戦略:潜在的なトレンドの反転を特定し、トレーダーがレンジ相場を活用できるようにします。 スキャルピング戦略:高速で正確なデイトレードおよび短期取引のために設計されています。 安定性:すべてのインジケーターはノンリペイント、ノンリドロー、ノンラグであり、信頼性の高いシグナルを保証します。 カスタマイズ:個々の取引の嗜好に合わせ
    ご紹介   クォンタム トレンド スナイパー インジケーターは 、トレンド反転を特定して取引する方法を変革する画期的な MQL5 インジケーターです。 13年以上の取引経験を持つ経験豊富なトレーダーのチームによって開発されました。     クォンタムトレンドスナイパーインジケーター   は、非常に高い精度でトレンドの反転を識別する革新的な方法で、あなたのトレーディングの旅を新たな高みに押し上げるように設計されています。 ***Quantum Trend Sniper Indicatorを購入すると、Quantum Breakout Indicatorを無料で入手できます!*** クォンタム ブレイクアウト インジケーターは、トレンドの反転を特定するとアラートを発し、矢印を示し、3 つのテイクプロフィットレベルを提案します。 初心者トレーダーにもプロのトレーダーにも適しています。 量子EAチャネル:       ここをクリック MT4のバージョン:       ここをクリック 推奨事項: 期間:すべての時間枠。最良の結果を得るには、M
    Reversal First Impulse levels (RFI)      INSTRUCTIONS        RUS       -       ENG              R ecommended to use with an indicator   -   TREND PRO -  Version MT4                 A key element in trading is zones or levels from which decisions to buy or sell a trading instrument are made. Despite attempts by major players to conceal their presence in the market, they inevitably leave traces. Our task was to learn how to identify these traces and interpret them correctly. Main functions:: Di
    まず第一に、この取引ツールはノンリペイント、ノンリドロー、ノンラグの指標であり、プロの取引に理想的ですことを強調する価値があります。 オンラインコース、ユーザーマニュアル、デモ。 スマートプライスアクションコンセプトインジケーターは、新米から経験豊富なトレーダーまで、非常 に強力なツールです。Inner Circle Trader AnalysisやSmart Money Concepts Trading Strategiesなど、20以上の有用な指標を1つに組み合わせています。このインジケーターはスマートマネーコンセプトに焦点を当て、大手機関の取引方法を提供し、彼らの動きを予測するのに役立ちます。 特に、流動性分析に優れており、機関がどのように取引しているかを理解しやすくしています。市場のトレンドを予測し、価格の動きを慎重に分析するのに優れています。機関の戦略とトレードを合わせることで、市場の動向についてより正確な予測ができます。このインジケーターは多目的であり、市場構造を分析し、重要な注文ブロックを特定し、さまざまなパターンを認識するのに優れています。 このインジ
    FX Volume MT5
    Daniel Stein
    4.94 (17)
    mql5と Telegramの モーニング・ブリーフィングで、詳細とスクリーンショットを含む毎日のマーケット・アップデートをご覧 ください! FX Volumeは、ブローカーの視点から市場のセンチメントをリアルに洞察する、最初で唯一の出来高インジケーターです。 ブローカーのような機関投資家が外国為替市場でどのようなポジションをとっているか、COTレポートよりもはるかに速く、素晴らしい洞察を提供します。 この情報をチャート上で直接見ることは、あなたの取引にとって真のゲームチェンジャーであり、画期的なソリューションです。 以下のようなユニークなマーケットデータ洞察から利益を得てください。 比率は 、通貨のロングポジションとショートポジションの比率をパーセントで表示します。 比率の変化は 、選択した期間内のロング比率とその変化率を表示します。 Volumes Totalは 、通貨の取引量(ロングとショート)の合計をロット単位で表示します。 Volumes Long :全通貨のロングポジションの取引量を表示します。 Volumes(ショート )は、全通貨のショートポジションの取引量を表示
    Gold Stuff mt5
    Vasiliy Strukov
    4.89 (179)
    Gold Stuff mt5 は、金専用に設計されたトレンド指標であり、あらゆる金融商品にも使用できます。 インジケーターは再描画せず、遅れません。 推奨時間枠 H1. 設定と個人的なボーナスを得るために、購入後すぐに私に連絡してください!  トレンド スキャナーの強力なサポートを利用して、無料のインジケーターを入手し、プライバシーを守ります。あーみー!   設定 矢印を描く - オンオフ。 チャートに矢印を描く。 アラート - 可聴アラートのオンオフ。 メール通知 - オンオフ。 電子メール通知。 プチ通知 - オンオフ。 プッシュ通知。 次に、色域を調整します。 Gold Stuff mt5 は、金専用に設計されたトレンド指標であり、あらゆる金融商品にも使用できます。 インジケーターは再描画せず、遅れません。 推奨時間枠 H1. 設定と個人的なボーナスを得るために、購入後すぐに私に連絡してください!   設定 矢印を描く - オンオフ。 チャートに矢印を描く。 アラート - 可聴アラートのオンオフ。 メール通知 - オンオフ。 電子メール通知。 プチ通
    トレンド スクリーナー インジケーターでトレンド取引の力を解き放ちます。ファジー ロジックと複数通貨システムを活用した究極のトレンド取引ソリューションです。 ファジー ロジックを活用した革新的なトレンド インジケーターである Trend Screener を使用して、トレンド取引を向上させます。 これは、13 を超えるプレミアム ツールと機能、および 3 つの取引戦略を組み合わせた強力なトレンド追跡インジケーターであり、Metatrader をトレンド アナライザーにする多用途の選択肢となります。 期間限定オファー : トレンド スクリーナー インジケーターは、わずか 50 ドルで生涯ご利用いただけます。 (元の価格 125$ ) (オファー延長) Trend Screener の 100% 非再描画精度の揺るぎない精度を体験して、取引の決定が過去の価格変動の影響を受けないようにしてください。 マルチタイムフレームおよびマルチ通貨機能の多用途性を解放し、比類のない自信を持って外国為替、商品、暗号通貨、インデックスの世界を取引できるようにします。 Trend Screener の包括的な
    Step into the realm of Forex trading with confidence and precision using XQ, a cutting-edge Forex indicator designed to elevate your trading game to unprecedented heights. Whether you're a seasoned trader or just stepping into the world of currency exchange, XQ Forex Indicator empowers you with the insights and signals needed to make informed trading decisions. The signal conditions are a combination of three indicators, and XQ Forex Indicator only display  medium and long-term trends . The ind
    これはMT5のインジケーターで、再描画なしで取引に参入するための正確なシグナルを提供します。 外国為替、暗号通貨、金属、株式、インデックスなど、あらゆる金融資産に適用できます。かなり正確な見積もりを提供し、取引を開始して終了するのに最適な時期を教えてくれます。1つのシグナルを処理しただけでインジケーターの元が取れた例の 動画 (6:22)をご覧ください。Entry PointsPro インジケーターの助けを借りたほとんどのトレーダーの最初の1週間の結果が改善しています。 Telegramグループ に登録してください。Entry Points Proインジケーターのメリットは次の通りです。 再描画のないエントリーシグナル 再描画されるインジケーターでは一度表示されたシグナルが削除されて大きな金銭的損失につながることがありますが、これと異なり、表示されて確認されたシグナルは消えることがありません。 エラーなしの取引開始 インジケーターアルゴリズムによって取引を開始する(資産を売買する)理想的な瞬間を見つけることができます。それを使用するすべてのトレーダーの成功率が向上します。
    ICT, SMC, SMART MONEY CONCEPTS, SMART MONEY, Smart Money Concept, Support and Resistance, Trend Analysis, Price Action, Market Structure, Order Blocks, BOS/CHoCH,   Breaker Blocks ,  Momentum Shift,   Supply&Demand Zone/Order Blocks , Strong Imbalance,   HH/LL/HL/LH,    Fair Value Gap, FVG,  Premium  &   Discount   Zones, Fibonacci Retracement, OTE, Buy Side Liquidity, Sell Side Liquidity, BSL/SSL Taken, Equal Highs & Lows, MTF Dashboard, Multiple Time Frame, BigBar, HTF OB, HTF Market Structure
    mql5と Telegramの モーニング・ブリーフィングで、詳細とスクリーンショットを含む毎日のマーケット・アップデートをご覧 ください! FX Power MT5 NGは 、長年の人気を誇る通貨強度計FX Powerの次世代モデルです。 この次世代ストレングスメーターは何を提供するのでしょうか?初代FXパワーの魅力すべて プラス GOLD/XAUの強さ分析 より正確な計算結果 個別に設定可能な分析期間 カスタマイズ可能な計算上限値により、さらに優れたパフォーマンスを実現 もっと見たい人のための特別なマルチインスタンス設定 すべてのチャートでお好みの色を無限に設定可能 数え切れないほどの通知オプションにより、重要なことを見逃すことはありません。 Windows 11とmacOSのスタイルで角を丸くした新しいデザイン 魔法のように動くインジケーターパネル FXパワーの主な機能 すべての主要通貨の強さの完全な履歴 すべての時間枠における通貨の強さの履歴 すべてのブローカーとチャートで同一の計算結果 100%信頼できるリアルタイム計算 -> リペイントなし ドロップダウン・リストから
    ブレーカートレーダーになり、価格が反転すると市場構造からの利益が変化します。 注文ブロックブレーカーインジケーターは、トレンドまたは価格の動きが枯渇に近づいており、逆転の準備ができていることを識別します。通常、反転または大規模なプルバックが発生しようとしているときに発生する市場構造の変化について警告します。 この指標は、ブレイクアウトと価格の勢いを識別する独自の計算を使用します。使い果たされる可能性のあるポイントの近くで新しい高値が形成されるたびに、インディケーターはその高値の作成を担当する最後の注文ブロックを描きます。次に、移動する価格とともに注文ブロックを追跡します。その後、価格が反対方向にシフトし、その注文ブロックを突破すると、新しい市場構造を作成し、トレンドまたは大きな後退の可能性のある反転の開始を警告します。 注文ブロックは、高値/安値が作成される前の最後の反対色のろうそくであり、価格がこれらの重要な領域を下抜けすると、トレンドの短期的ま​​たは長期的な反転の兆候です。 特徴 重要な枯渇点での市場構造の変化を警告します 価格が使い果たされるレベルに近づくと、
    note: this indicator is for METATRADER4, if you want the version for METATRADER5 this is the link:  https://www.mql5.com/it/market/product/108106 TRENDMAESTRO ver 2.4 TRENDMAESTRO recognizes a new TREND in the bud, he never makes mistakes. The certainty of identifying a new TREND is priceless. DESCRIPTION TRENDMAESTRO identifies a new TREND in the bud, this indicator examines the volatility, volumes and momentum to identify the moment in which there is an explosion of one or more of these data a
    ご紹介     Quantum Breakout PRO は 、ブレイクアウト ゾーンの取引方法を変革する画期的な MQL5 インジケーターです。 13年以上の取引経験を持つ経験豊富なトレーダーのチームによって開発されました。     クォンタム ブレイクアウト プロ   は、革新的でダイナミックなブレイクアウト ゾーン戦略により、あなたのトレーディングの旅を新たな高みに押し上げるように設計されています。 クォンタム ブレイクアウト インジケーターは、5 つの利益ターゲット ゾーンを備えたブレイクアウト ゾーン上のシグナル矢印と、ブレイクアウト ボックスに基づいたストップロスの提案を提供します。 初心者トレーダーにもプロのトレーダーにも適しています。 量子EAチャネル:       ここをクリック 重要!購入後、インストールマニュアルを受け取るためにプライベートメッセージを送ってください。 推奨事項: 時間枠: M15 通貨ペア: GBPJPY、EURJPY、USDJPY、NZDUSD、XAUUSD アカウントの種類: ECN、Raw、またはス
    AW Trend Predictor MT5
    AW Trading Software Limited
    4.78 (58)
    1 つのシステムでのトレンド レベルとブレイクダウン レベルの組み合わせ。高度なインジケーター アルゴリズムは、市場のノイズをフィルター処理し、トレンド、エントリー ポイント、および可能なエグジット レベルを決定します。インジケーターシグナルは統計モジュールに記録されるため、最適なツールを選択してシグナル履歴の有効性を示すことができます。この指標は、テイクプロフィットとストップロスのマークを計算します。 マニュアルと説明書 ->   ここ / MT4 バージョン ->   ここ インジケーターで取引する方法: Trend Predictor での取引は、たった 3 つの簡単なステップです。 ステップ 1 - ポジションを開く 70% 以上の成功率で買いシグナルが受信されました ステップ 2 - ストップロスの決定 逆信号でトランクを選択 ステップ 3 - テイクプロフィット戦略の定義 戦略 1: TP1 に到達したらポジション全体をクローズする 戦略 2: TP1 に達した時点でポジションの 50% をクローズし、TP2 に達した時点で残りの 50% をクローズします。 戦略 3:
    TPSpro TRENDPRO  - is a trend indicator that automatically analyzes the market and provides information about the trend and each of its changes, as well as giving signals for entering trades without redrawing! The indicator uses each candle, analyzing them separately. referring to different impulses - up or down impulse. Exact entry points into transactions for currencies, crypto, metals, stocks, indices!  -  Version MT4               DETAILED DESCRIPTION               R ecommended to use with
    Bill Williams Advanced is designed for automatic chart analysis using Bill Williams' "Profitunity" system. The indicator analyzes four timeframes at once. Manual (Be sure to read before purchasing) Advantages 1. Automatically analyzes the chart using the "Profitunity" system of Bill Williams. The found signals are placed in a table in the corner of the screen. 2. Equipped with a trend filter based on the Alligator indicator. Most of the system signals are recommended to be used only accordi
    Quantum平均足PRO のご紹介 市場のトレンドに対する明確な洞察を提供するように設計された平均足キャンドルは、ノイズを除去し、誤ったシグナルを排除する能力で知られています。混乱を招く価格変動に別れを告げ、よりスムーズで信頼性の高いチャート表現を導入しましょう。 Quantum Heiken Ashi PRO を真にユニークなものにしているのは、従来のローソク足データを読みやすい色のバーに変換する革新的なフォーミュラです。赤と緑のバーはそれぞれ弱気トレンドと強気トレンドをエレガントに強調し、潜在的なエントリーポイントとエグジットポイントを驚くほど正確に見つけることができます。 量子EAチャネル:       ここをクリック MT4のバージョン:       ここをクリック この注目すべき指標には、いくつかの重要な利点があります。 明確性の向上: 価格変動を平滑化することで、平均足バーは市場トレンドをより明確に表現し、有利な取引機会を特定しやすくします。 ノイズの削減: 誤ったシグナルを引き起こすことが多い不安定な価格変動に別れを告げます。 Quantum Heik
    クリスマスセール!40% OFF!1月1日に価格が$250に値上がり! GoldenGate Entriesをご紹介します:最先端のトレーディングソリューション! GoldenGate Entries(GGE)を使用して取引する革新的なアプローチを発見しましょう。GGEは、取引体験を向上させるために設計された先進的なインジケーターで、ユーザーに正確性と自信を持たせるための包括的な機能を提供します。 通貨ペア:Any(FX - 商品 - 株式 - 株式 - クリプト) タイムフレーム:15分からH1 主な特徴: 買いと売りの矢印の指示:常に情報を受け取るために、買いと売りの矢印の指示をポップアップアラートとともに受け取ります。 GoldenGate_Algo:GoldenGate_Algoを使用して市場の状況を把握し、市場が「売り過ぎ」または「買い過ぎ」かどうかを評価する強力なツールです。 現在のトレンド分析:視聴中のタイムフレームで現在のトレンドにアクセスして、取引を市場の主流方向に合わせることができます。 組み込みのピボットポイント:組み込まれた
    TPA True Price Action indicator reveals the true price action of the market makers through 100% non-repainting signals strictly at the close of a candle! TPA shows entries and re-entries, every time the bulls are definitely stronger than the bears and vice versa. Not to confuse with red/green candles. The shift of power gets confirmed at the earliest stage and is ONE exit strategy of several. There are available now two free parts of the TPA User Guide for our customers. The first "The Basics"
    ** All Symbols x All Timeframes scan just by pressing scanner button ** ***Contact me after purchase to send you instructions and add you in "123 scanner group" for sharing or seeing experiences with other users. After 17 years of experience in the markets and programming, Winner indicator is ready. I would like to share with you! Introduction The 123 Pattern Scanner indicator with a special enhanced algorithm is a very repetitive common pattern finder with a high success rate . Interestingly,
    Auto Order Block with break of structure based on ICT and Smart Money Concepts (SMC) Futures Break of Structure ( BoS )             Order block ( OB )            Higher time frame Order block / Point of Interest ( POI )    shown on current chart           Fair value Gap ( FVG ) / Imbalance   -  MTF      ( Multi Time Frame )    HH/LL/HL/LH  -  MTF      ( Multi Time Frame )  Choch  MTF      ( Multi Time Frame )  Volume Imbalance     ,  MTF          vIMB Gap’s Power of 3 Equal High
    Was: $249  Now: $99   Market Profile defines a number of day types that can help the trader to determine market behaviour. A key feature is the Value Area, representing the range of price action where 70% of trading took place. Understanding the Value Area can give traders valuable insight into market direction and establish the higher odds trade. It is an excellent addition to any system you may be using. Inspired by Jim Dalton’s book “Mind Over Markets”, this indicator is designed to suit the
    The indicator very accurately determines the levels of the possible end of the trend and profit fixing. The method of determining levels is based on the ideas of W.D.Gann, using an algorithm developed by his follower Kirill Borovsky. Extremely high reliability of reaching levels (according to K. Borovsky  - 80-90%) Indispensable for any trading strategy – every trader needs to determine the exit point from the market! Precisely determines targets on any timeframes and any instruments (forex, met
    Easy By Sell is a market indicator for opening and closing positions. It becomes easy to track market entries with alerts. It indicates trend reversal points when a price reaches extreme values ​​and the most favorable time to enter the market. it is as effective as a Fibonacci to find a level but it uses different tools such as an algorithm based on ATR indicators and Stochastic Oscillator. You can modify these two parameters as you wish to adapt the settings to the desired period. My othe
    まず最初に、このトレーディングシステムがリペイントされず、再描画されず、遅延しないことを強調する価値があります。これにより、プロのトレーディングに最適な状態になります。 オンラインコース、ユーザーマニュアル、デモ。 「スマートサポートアンドレジスタンストレーディングシステム」は、新規および経験豊富なトレーダー向けにカスタマイズされた高度なインジケーターです。この包括的なシステムは、7以上の戦略、10のインジケーター、およびデイトレード戦略、スイングトレード戦略、サポートおよびレジスタンス戦略、ローソク足パターン戦略、VWAP戦略、マルチタイムフレームトレンド戦略など、さまざまなトレーディングアプローチを組み合わせています。これは、矢印信号、エントリーポイント、出口ポイント、トレードアラート、より高い時間枠のトレンド分析、リアルタイムのトレードモニタリング、そして洞察力のあるトレンドとボリュームキャンドルの着色を提供します。自動的なサポートとレジスタンスの検出により、さまざまな市況下でトレーダーが的確な決定を下すのを支援する多面的なインジケーターとなっています。 スマートサポートア
    Gartley Hunter Multi - An indicator for searching for harmonic patterns simultaneously on dozens of trading instruments and on all possible timeframes. Manual (Be sure to read before purchasing) | Version for MT4 Advantages 1. Patterns: Gartley, Butterfly, Shark, Crab. Bat, Alternate Bat, Deep Crab, Cypher 2. Simultaneous search for patterns on dozens of trading instruments and on all possible timeframes 3. Search for patterns of all possible sizes. From the smallest to the largest 4. A
    IX Powerは 、FX Powerの無敵の精度をついにFX以外のシンボルにも提供します。 お気に入りの指数、株式、コモディティ、ETF、さらには暗号通貨の短期、中期、長期のトレンドの強さを正確に判断します。 お使いの端末が提供する すべてを分析する ことができます。ぜひお試しいただき、取引 タイミングが大幅に改善 されることをご体験ください。 IXパワーの主な特徴 100%正確で再描画されない計算結果 - ターミナルで利用可能なすべての取引シンボルに対して 予め設定され、さらに個別に設定可能な強度分析期間のドロップダウン選択 Eメール、メッセージ、モバイル通知による無数の通知オプション EAリクエストのためのアクセス可能なバッファ カスタマイズ可能な計算制限により、さらに優れたパフォーマンスを実現 もっと見たい人のための特別なマルチインスタンス設定 すべてのチャートでお好みの色を無限に設定可能 Windows 11とmacOSのスタイルで角を丸くした新しいパネルデザイン サブ・ウィンドウとメイン・チャートの間をシームレスに移動する、魔法のように動くイン
    **   All Symbols   x   All Timeframes   scan just by pressing scanner button ** *** Contact me after the purchase to send you instructions and add you in "Trend Reversal group" for sharing or seeing experiences with other users. Introduction: Trendlines are the most famous technical analysis in trading . Trendlines continually form on the charts of markets across all the different timeframes providing huge opportunities for traders to jump in and profit on the action. In the other hand,  The tre
    作者のその他のプロダクト
    MarketMakerMT5
    Thomas Bradley Butler
    需要と供給の取引を自動化します。市場を作る。 このEAは、誰もが販売および模倣する人気のある需要と供給の指標に触発されて作成されました。 EAは取引とヘッジを続け、市場を作ります。非ヘッジ口座でも取引できます。リスクを評価し、時間枠、ロットサイズ、ヘッジ機能を使用する必要があります。一度に複数のペアをオンとオフで合計約1か月間取引しました。 システムの概念: EAは需要と供給のレベルを交換します。レベルが変わるので、EAは新しいレベルを交換し続けます。より低いロットの多くのペアに分散することは、システムの機能です。安定したゲインを維持しながら、大きなドローダウンを回避する必要があります。 SLは使用できますが、これをオプションにするために説明したヘッジされた側面。私が多くのペアで小ロットで得ているドローダウンは4%であり、これはSLなしです。より大きなロットは6%を示しています。したがって、小さいサイズは控えめで、大きいサイズはより積極的です。これらは、残高と比較して取引されるロットを低く保つ理由です。貿易は発展する余地が必要です。 特徴: 取引数 固定ロット ボ
    HFTHackerMT5
    Thomas Bradley Butler
    5 (1)
    シグナル: 私のプロフィールの HFT ハッカー リンク *テストして使用する前に EA を最適化してください。 最適化した場合のみ購入してください。 これは、最適化する方法を知っており、自分のメリットで利益を上げたいと考えているトレーダー向けです。 リスクパラメータを設定するのはあなたです。 選択してもうまくいかないトレードにストップを加えた高い勝率。 長生きのためのリスクを軽減します。 これはすべてのアカウントで機能し、リスク管理ツールです。すべてのコメント、説明、ブログを読んでください。 最良の結果を得る仕組み: https://www.mql5.com/en/blogs/post/754836 MT4バージョン: https://www.mql5.com/en/market/product/73834 マイクロ秒単位が重要な高頻度取引 (HFT) の賑やかな世界に、HFT ハッカーとしてのみ知られる謎の人物が住んでいました。 電光石火の反射神経と、市場の複雑なアルゴリズムを操る驚異的な能力を備えた HFT ハッカーは、トレーダーの間で伝説的な存在でした。 伝説に
    株式(CFD)のみのデイトレード。 取引には手間がかかります。 すべてのエントリと終了を通知するショートカットやインジケータはありません。 利益は心の状態から来ます。 指標は、お金の管理と成功の心理学と組み合わせて使用されるツールです。 ボリュームプロファイルの不均衡を見つけます。 取引価格のボリュームの不均衡。 多くの不均衡は、クローズとオープンおよびニュースで発生します。 株の買い手と売り手を参照してください。 5分から1時間使用して、誰が価格を管理できるかを確認し、価格の不均衡を見つけます。 より大きな在庫は15分以上です。 カラーボリュームバーの上にマウスを置くと、過去のバーの数が表示されます。 現在のバーの音量は上隅に書かれています。 ボリュームの不均衡を見つけて、しばらくの間価格がどの方向に進むかを確認します。 最良の結果を得るために支配的な傾向に従ってください トレンドが発生した場合は、トレンドをトレードするようにしてください。 トレーリングストップを使用し、大量の反転の不均衡に注意してください。
    Crypto Net
    Thomas Bradley Butler
    Crypto Netは、1時間の時間枠でBTCUSDを取引するためのものです。 それは戦略を進化させるために遺伝的進化を使用します。 このEAトレードトレンドは、ATRと一目の嘘の指標に続いています。 これは構築され、モンテカルロやウォークフォワードを含む一連の堅牢なテストに合格しました。 入力: 最小リスクであるアカウントの割合。 最大ロット数 取引を停止する時間 他に何も変更されていません。 フォワードのみのトレード。 バックテストはありません。 ブローカーの時間は、戦略が組み込まれたものとは異なります。 Crypto Netは、1時間の時間枠でBTCUSDを取引するためのものです。 それは戦略を進化させるために遺伝的進化を使用します。 このEAトレードトレンドは、ATRと一目の嘘の指標に続いています。 これは構築され、モンテカルロやウォークフォワードを含む一連の堅牢なテストに合格しました。 入力: 最小リスクであるアカウントの割合。 最大ロット数 取引を停止する時間 他に何も変更されていません。
    Bitcoin M5
    Thomas Bradley Butler
    OPTIMIZE EA BEFORE TEST AND USE. Bitcoin M5 is for trading BTC/USD on 5 min charts.  SL and TP should Start with 50000.  OPTIMIZE BEFORE USE The trading strategy uses Bollinger Bands and Envelopes indicators to trade from.  Trading to catch some breakout points of where the price breaches the bands and then exiting when the price crosses the envelopes.  Every trade uses a fixed lot amount and has a SL and TP.  The EA does not use martingale or hedging in the logic.
    OPTMIZE EA BEFORE BACKTEST AND USE. Pin Bar Scalper scalps pin bars and momentum on 5 minute charts on the EUR/USD.  Optimize the parameters to get the best  out of the EA.  Pin bars are popular candlesticks that show that the price has been taken over by the bulls or bears. The inputs are based around the size of the pin bars in %, which are 3 different ones.  Wicks and body are the calculations within the parameter.  Test file in comments for example only.  Trade the dates _
    ForexReversal
    Thomas Bradley Butler
    4 (1)
    忍耐はストレスのないスキャルピングの鍵です。 200の移動平均を通過するのを確認したら、矢印をトレードし、移動平均フィルターを使用せずに、最後のスイングポイントから拡大またはトレンドを作成します。 1分間の時間枠に最適で、日中の動きの勢いを捉えます。 トレーリングストップを使用して、簡単に20ピップを取るか、より大きなトレンドのために長く滞在します。 この指標からの本当に大きな取引の写真の例を見てください。 1分の時間枠が最適です。 ズームアウトしてトレンドを確認します。 矢印は再描画または再計算されません。 1分の時間枠に添付して取引を調査し、それが戦略に使用できるかどうかを確認します。 私 ルール: 購入のための青 販売のための赤 横向きの期間を避けてください 大量の取引と勢いの取引 ストップロスを使用する
    NeuroScalper
    Thomas Bradley Butler
    5 (2)
    アップデート!矢印が100レベルと200レベルに追加されました。 このインディケータは極値にアクセスするために正確であり、主に1分間の買いポジションをサポートします。他の時間枠を使用することもできますが、レベルは異なります。これは優れた発振器であり、他の発振器と比較して違いを確認します。 ニューロネットワークの概念を使用したデイトレード。このインジケーターは、基本的な形式のニューロネットワークを使用して売買するシグナルを生成します。 1分足チャートのインジケーターを使用します。インジケーターは再描画されません。 1分間のチャートまたはさまざまなレベルを使用する他のチャートを使用してテスターでダウンロードして実行し、取引を分析して自分で確認します。市場を頭皮にする多くの機会。より高い時間枠で使用できますが、レベルはあなたの裁量に応じて変更する必要があります。時間枠が長いほど、範囲が広くなります。 このモデルで考慮すべき概念と事項: 複数のインジケーターが使用され、重みが適用され、最大値と最小値に2つのデータポイントがあります。この指標は主に上昇トレンドを取引するための
    スマート ボリューム トラッカーと組み合わせる: https://www.mql5.com/en/market/product/116650 フットプリントチャートと組み合わせる: https://www.mql5.com/en/market/product/94153 ゾーン内の取引と組み合わせる: https://www.mql5.com/en/market/product/110194 ボリュームデイトレーダーと組み合わせる: h https://www.mql5.com/en/market/product/72498 オーダーブックと組み合わせる: https://www.mql5.com/en/market/product/102247 レベル 2 取引は、MetaTrader チャート上で現在の買値と売値を視覚化するのに役立つ指標です。 これは、市場での売買活動のスナップショットを簡単に取得するようなもので、どこで圧力が高まっているかを理解することができます。 それが示すもの ビッド値とアスク値: インジケーターには、ビッド (買い) ボリュームと
    GoldBuyBackScalper
    Thomas Bradley Butler
    4 (1)
    このインジケーターはXAU / USD、1分足チャートのみを対象としています。 すべてのペアには、独自の特性と価格変動があります。 このインジケーターでV字型の反転をトレードします。 頭皮はトレーリングストップを使用して購入し、ニュースはより極端で突然の売りを引き起こす可能性があるため、ニュースを避けます。 バックテストで1分の時間枠にアタッチし、反転購入を確認します。 インジケーターが再描画または再計算されることはありません。 活動時間中のみの取引 このインジケーターはXAU / USD、1分足チャートのみを対象としています。 すべてのペアには、独自の特性と価格変動があります。 このインジケーターでV字型の反転をトレードします。 頭皮はトレーリングストップを使用して購入し、ニュースはより極端で突然の売りを引き起こす可能性があるため、ニュースを避けます。 バックテストで1分の時間枠にアタッチし、反転購入を確認します。 インジケーターが再描画または再計算されることはありません。 活動時間中のみの取引
    This is based on short term strength or weakness and not on moving averages.  Moving averages are used for filter only. Trade supply and demand with arrows. Supply and demand breakouts and strength of the buyers or sellers .  Don't trade buy arrow to sell arrow.  Trade the strength with trendlines or moving averages and use stops.  The arrow can have some strong moves.  Trade on all time frames.  Try it out in the back tester. The pips can be made with this indicator, follow the arrows and mak
    Master scalping with this indicator.  Trade on any time frame for scalps on buy or sells.  Follow trends using a 200 moving average and stops and targets.  Use with your own system.  This indicator can give pips if following it correctly.  Stick to rules and pick up pips daily.  Use as entries in a trend, scalp for a few pips or exit on opposite signal.  Best to follow higher time frame trends. Indicator doesn't repaint or recalculate. Rules: Don't trade overnight, only trade during active sessi
    This indicator is good for small time frames like 1 and 5 minutes and made for day trading. The indicator never repaints or recalculates. The indicator works is for trading swing points in day trading, following bulls or bears.  Its a simple to use, non cluttered indicator with a high success rate.  This indicator works well to capture ranges.  All indicators come with limitations and no indicator or system is always accurate. Use money management for long term trading success.   Place in backte
    DTKGold
    Thomas Bradley Butler
    This is the DayTradeKing for gold on a 1 minute time frame.  It is a different calculation for the range. Use a 200 period moving average as a filter.  Always use stops and avoid news, wait for more conformation.  This looks to capture intraday ranges. Put it in the back tester on 1 minute to see the price action and how it works. Trade with trend Use filter Use stops Alerts are added for pop ups and sound. 
    Trade trends with the Super Scalper Use on all time frames and assets it is  designed for scalping trends. Works good on small time frames for day trading.  The arrows are easy to follow.  This is a simple no repaint/no recalculate arrow indicator to follow trends with.  Use in conjunction with your own system or use moving averages.  Always use stops just below or above the last swing point or your own money management system The indicator comes with push notifications, sound alerts and email
    This indicator is a simple stripped down version of any advanced support and resistance indicator.  All the support and resistance indicators work from a number of bars that have developed over time. Get rid of clutter and confusing levels.  Find levels according to a number of bars. Look at days, session, numbers of hours, periods of consolidation.  Watch levels develop and use as breakout points, or areas of buyers and sellers.  Features and things to consider This indicator is for a frame of
    https://www.mql5.com/en/market/product/57345 このEAは、外国為替反転インジケーターに基づいています。 システムを手動で取引したい場合は、インジケーターをダウンロードして試してみてください。 EAはトレンドに従い、それに応じてポジションをオープンします。 結果は、より低いドローダウンで安定したゲインを示していますが、バックテスター、オプティマイザー、および時間枠でそれを試して、何が機能するかを確認してください。 示されているすべての結果は架空のものです。 注:これはマーチンゲールやグリッドではありません。 インジケーターにはヘッジ機能があります このEAには以下の機能があり、リスクに応じて変更してください。 EAは自由証拠金に従って追加し、パラメーターに従って売買します。 入力を通じてリスクを管理します。 inp5は売りです inp7は購入です ストップロットを修正 固定テイクプロフィット   フリーマージンの%
    HFTHacker
    Thomas Bradley Butler
    シグナル: 私のプロフィールの HFT ハッカー リンク *テストして使用する前に EA を最適化してください。 最適化した場合のみ購入してください。 これは、最適化する方法を知っており、自分のメリットで利益を上げたいと考えているトレーダー向けです。 リスクパラメータを設定するのはあなたです。 選択してもうまくいかないトレードにストップを加えた高い勝率。 長生きのためのリスクを軽減します。 これはすべてのアカウントで機能し、リスク管理ツールです。すべてのコメント、説明、ブログを読んでください。 最良の結果を得る仕組み: https://www.mql5.com/en/blogs/post/754836 MT4バージョン: https://www.mql5.com/en/market/product/73834 マイクロ秒単位が重要な高頻度取引 (HFT) の賑やかな世界に、HFT ハッカーとしてのみ知られる謎の人物が住んでいました。 電光石火の反射神経と、市場の複雑なアルゴリズムを操る驚異的な能力を備えた HFT ハッカーは、トレーダーの間で伝説的な存在でした。 伝説
    MarketMaker
    Thomas Bradley Butler
    需要と供給の取引を自動化します。市場を作る。 このEAは、誰もが販売および模倣する人気のある需要と供給の指標に触発されて作成されました。 EAは取引とヘッジを続け、市場を作ります。非ヘッジ口座でも取引できます。リスクを評価し、時間枠、ロットサイズ、ヘッジ機能を使用する必要があります。一度に複数のペアをオンとオフで合計約1か月間取引しました。 システムの概念: EAは需要と供給のレベルを交換します。レベルが変わるので、EAは新しいレベルを交換し続けます。より低いロットの多くのペアに分散することは、システムの機能です。安定したゲインを維持しながら、大きなドローダウンを回避する必要があります。 SLは使用できますが、これをオプションにするために説明したヘッジされた側面。私が多くのペアで小ロットで得ているドローダウンは4%であり、これはSLなしです。より大きなロットは6%を示しています。したがって、小さいサイズは控えめで、大きいサイズはより積極的です。これらは、残高と比較して取引されるロットを低く保つ理由です。貿易は発展する余地が必要です。 特徴: 取引数
    Top Trader
    Thomas Bradley Butler
    Top Trader Indicator This is an arrow reversal indicator. This is with deviations and arrows.  Trade a blue arrow for buy and trade a red arrow for sell.  Change the time period and the deviations of the bands.  This is similar to others but these arrows don't repaint.  Load in back tester and study which periods and deviations work the best.  It works on all time frames.  15 min to 1 hr would give good results for take profits.  Try according to your own risk management.
    Quant Bot
    Thomas Bradley Butler
    Quant Botは、EUR / USDの1時間の時間枠でのトレンド取引用です。 セットファイルはありませんが、他のペアを使用する場合は、最適化が必要になる場合があります。 ボットについて: 遺伝子生成を使用し、ATRを使用して取引します。 カーブフィットを防ぐためにウォークフォワード期間が使用されました EAはすべての取引でストップを使用します。 お金の管理は、バランスの%でスケールアップします バックセット期間は2003年から2020年までであり、前進は2020年から2022年まででした(写真を参照)。 Quant Botは、EUR / USDの1時間の時間枠でのトレンド取引用です。 セットファイルはありませんが、他のペアを使用する場合は、最適化が必要になる場合があります。 ボットについて: 遺伝子生成を使用し、ATRを使用して取引します。 カーブフィットを防ぐためにウォークフォワード期間が使用されました EAはすべての取引でストップを使用します。 お金の管理は、バランスの%でスケールアップします バックセット期間は2003年から2020年までであり、前進は2
    XAU / USDの場合 これは、ランダムな世代とトレンドフォロートレーディングを使用する安定したトレーディングシステムです。 エキスパートは品質データでバックテストされ、モンテカルロシミュレーションとともに最適化期間を完了して、XAU / USDの1時間の時間枠でのオーバーフィットを回避しました。 ストップロスとテイクプロフィットが使用されます。 EAには複数の構成があり、取引するロット数を把握する以外に行うことはありません。 特徴: バランス化合物の利益のパーセントを使用します XAU / USDの場合 これは、ランダムな世代とトレンドフォロートレーディングを使用する安定したトレーディングシステムです。 エキスパートは品質データでバックテストされ、モンテカルロシミュレーションとともに最適化期間を完了して、XAU / USDの1時間の時間枠でのオーバーフィットを回避しました。 ストップロスとテイクプロフィットが使用されます。 EAには複数の構成があり、取引するロット数を把握する以外に行うことはありません。 特徴: バランス化合物の利益のパ
    PropTrader
    Thomas Bradley Butler
    *使用前にEAを最適化してください* EUR/USD向けに最適化された外国為替取引戦略 Expert Advisor (EA) を使用して 1 ~ 2 年以内に多額の富を達成するというのは非現実的な主張です。 バックテストと実際の取引は、EUR/USD 通貨ペアに焦点を当てています。 この戦略について: これは私たちの戦略の最初の反復を表しており、さらなる進歩の可能性があります。 100% 品質のデータを使用して厳密にテストされており、MT4 エラーはありません。 この戦略は、トレンドフォローの論理原則に基づいて機能します。 トレンドが強気の場合、EA が開始してトレーリング ストップを展開します。逆の場合も同様です。 本質的には、これは単純なトレンド追跡アプローチです。 主な利点と考慮事項: 簡単なセットアップ: デフォルト設定をそのまま使用し、好みに応じてロットサイズを変更するだけです。 リスク管理: この戦略ではマーチンゲールやヘッジは使用されません。 リスク軽減: 各取引には、アベレージ トゥルー レンジ (ATR) によって決定されるトレーリング ス
    Down Under
    Thomas Bradley Butler
    ダウンアンダーは1時間の時間枠でAUD/USDペアを取引します。 このEAはATRとOHLCをトレードします。 この時間枠でこのペア用にフォーマットされます。 複利は分で使用されます。 ロットサイズと最大。 ロットサイズ。 残高のパーセンテージは、勝ちトレードで合成されます。 バランスが変動すると、ロットサイズも変動します。 設定: mmリスク% mmロット 最大ロット 他に変更するものはありません。 これには、マーチンゲールまたはヘッジ機能はありません。 変更する他の機能は、取引している場合、AUD/USDのCFDのみです。 ブローカープラットフォームでこれを小数点以下で変更します。 リスク免責事項 先物、オプション、通貨取引はすべて大きな潜在的な見返りがありますが、大きな潜在的なリスクもあります。 これらの市場に投資するには、リスクを認識し、喜んで受け入れる必要があります。
    Cable Trader
    Thomas Bradley Butler
    GBP/USD 1hr.  このEAは勢いとセッションを交換します。 これには固定ロットコンポーネントがあり、開発中にTPを変更し続けます。 設定: ロットサイズ 他に変更するものはありません。 これには、マーチンゲールまたはヘッジ機能はありません。 変更する他の機能は、取引している場合、GBP/USDのCFDのみです。 ブローカープラットフォームでこれを小数点以下で変更します。 リスク免責事項 先物、オプション、通貨取引はすべて大きな潜在的な見返りがありますが、大きな潜在的なリスクもあります。 これらの市場に投資するには、リスクを認識し、喜んで受け入れる必要があります。 リスク免責事項 先物、オプション、通貨取引はすべて大きな潜在的な見返りがありますが、大きな潜在的なリスクもあります。 これらの市場に投資するには、リスクを認識し、喜んで受け入れる必要があります。
    Euclidean
    Thomas Bradley Butler
    ユークリッドは、私が8年前に思いついたユニークな取引アルゴリズムです。 このEAはこのシステムの一部です。 閉鎖系として機能します。 EAは、トレンドをキャッチするために角度の程度が正しいときに購入を開始します。 ストップロスは角度から10%です。 とても簡単です。 入力: ロット1マイクロロットの残高の%($ 1,000) ボリューム上位ロット=ロットの最大量 利益レベルを取る=デフォルトは50ピップス 方法と考慮事項: ストップロスが組み込まれており、10%の角度で価格に応じて取引されます。 テイクプロフィットは50ピップスに設定されていますが、希望する金額にすることができます。 1分から5分のような短い時間枠で取引します。 バックテスターでこれをテストする際のエラーはありませんでした。 プラットフォームやブローカーが異なればデータも異なるため、テストするデータのダウンロードを確認してください。 外国為替取引のリスク免責事項 証拠金で外国為替を取引することはリスクが高く、すべての投資家に適しているとは限りません。 過去のパフォーマンスは将来の結果を示す
    Pip Scalper
    Thomas Bradley Butler
    みんなのための指標 Pip Scalperは、スキャルピングトレンド用です。 この指標を使用して、トレンドに長くとどまります。 すべての時間枠とアセットで機能します。 このツールで毎日のピップを拾います。 200の移動平均を使用して取引をフィルタリングします。 より短い時間枠をお勧めします。 デイトレードに使用します。 使用方法と使用方法: Pips Scalperは、長期的なトレンド取引に基づいています。 青で購入 赤で売る フィルターとして200移動平均を使用し、アクティブな期間中に取引します。 Pip Scalperは、スキャルピングトレンド用です。 この指標を使用して、トレンドに長くとどまります。 すべての時間枠とアセットで機能します。 このツールで毎日のピップを拾います。 200の移動平均を使用して取引をフィルタリングします。 より短い時間枠をお勧めします。 デイトレードに使用します。 使用方法と使用方法: Pips Scalperは、長期的なトレンド取引に基づいています。 青で購入 赤で売る フィルターとして200移動平均を使用し、アク
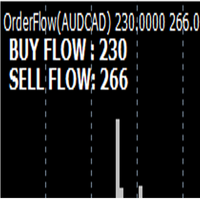
    Just a simplified way of observing the volume.  It shows the buy flow against the sell flow.  See the volume coming in and trade with the money.  Visualize the trend rising or falling and trade according to the imbalance in volume.  Use for scalping and trend trading.  Trade by volume coming in. FOOTPRINT CHART:  https://www.mql5.com/en/market/product/94153 Order Book:  https://www.mql5.com/en/market/product/102247 EA Based:  https://www.mql5.com/en/market/product/82585 Note: Works in real
    Evolved Trends
    Thomas Bradley Butler
    テスト前に最適化し、最適な入力を見つけるために使用します こんにちは、トレーダーの皆さん! MT4 プラットフォーム用の最先端の Expert Advisor が必要ですか? 進化したトレンド以外に目を向ける必要はありません。 機械学習テクノロジーで作成されたこの強力な取引アルゴリズムは、1 時間の時間枠での GBP/USD の取引に焦点を当てています。 ただし、最適化のために他のアセットや時間枠を自由に試してみてください。 自分のリスク許容度に合わせて入力をカスタマイズするだけです。 ATR に基づくストップ機能と、利益を確定し、損失をカットする機能を備えた Evolved Trends は、あらゆる取引システムに最適な資金管理を保証します。 さらに、独自のリスク スケーリング機能がアカウント残高に基づいて調整されます。 Evolved Trends でトレーディング ゲームを次のレベルに引き上げましょう!
    Trade any Forex combine out there.  Many prop firms offer challenge or instant funding combines.  The biggest problem is controlling the loss.  With this indicator you can get a visual system that can limit loss and teach discipline.  This uses the MACD and the strategy is scalping.  You can determine the risk and reward.  Visually follow small trends for scalps.  Trade during active sessions.  It's just a simple system to instill discipline while limiting loss and scalping pips with the paramet
    フィルタ:
    Konstantin Remezov
    1139
    Konstantin Remezov 2022.02.03 19:56 
     

    ユーザーは評価に対して何もコメントを残しませんでした

    レビューに返信