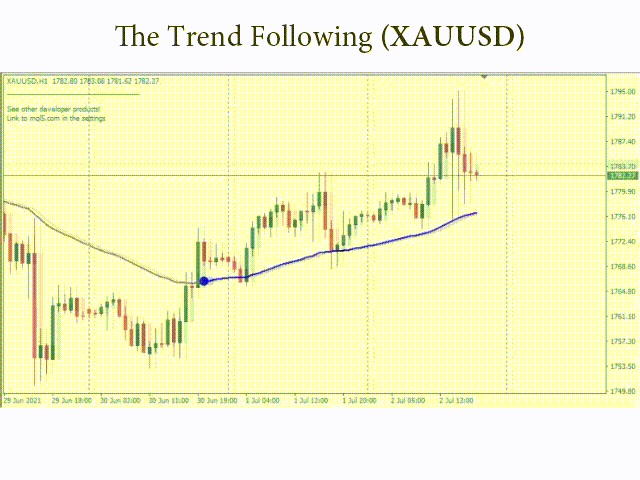
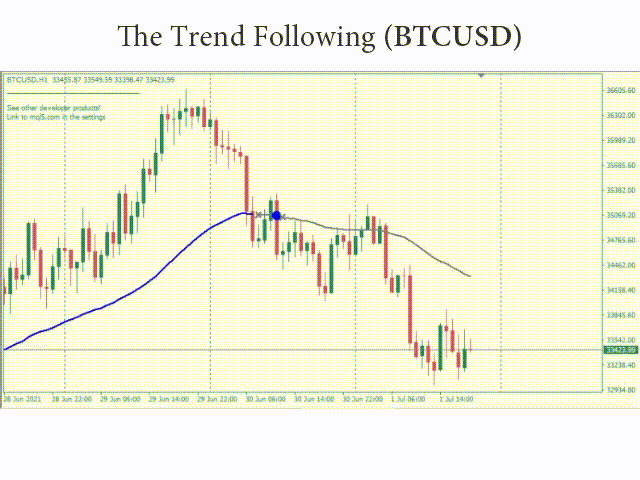
The Trend Following
- インディケータ
- Anton Iudakov
- バージョン: 1.0
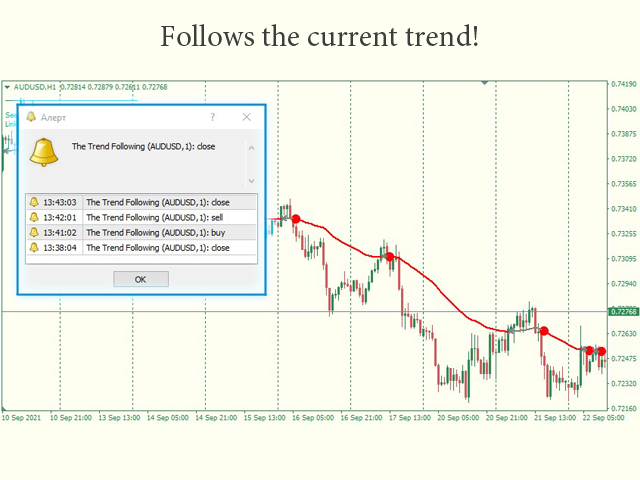
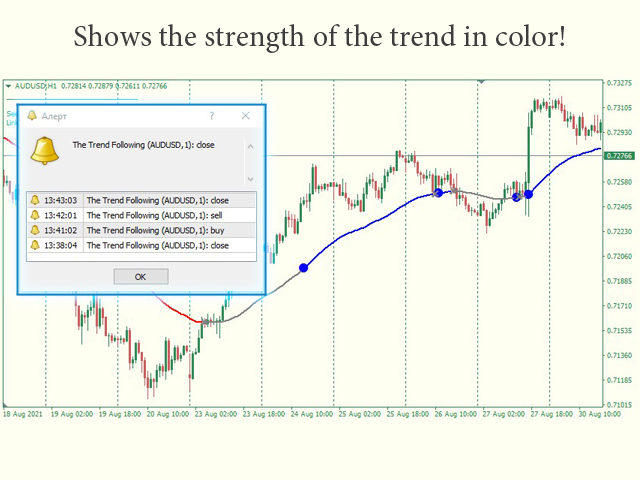
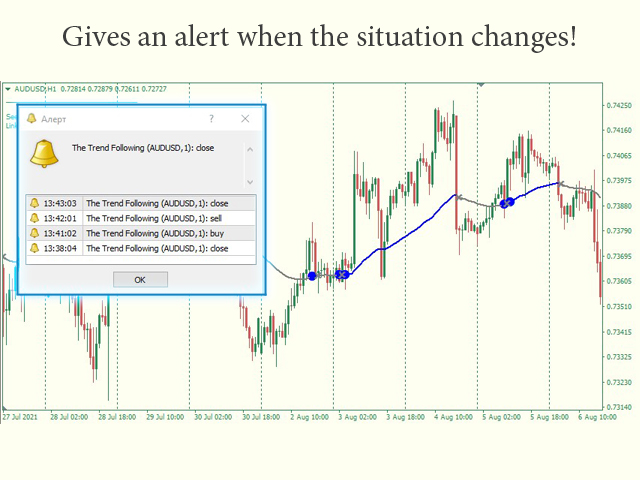
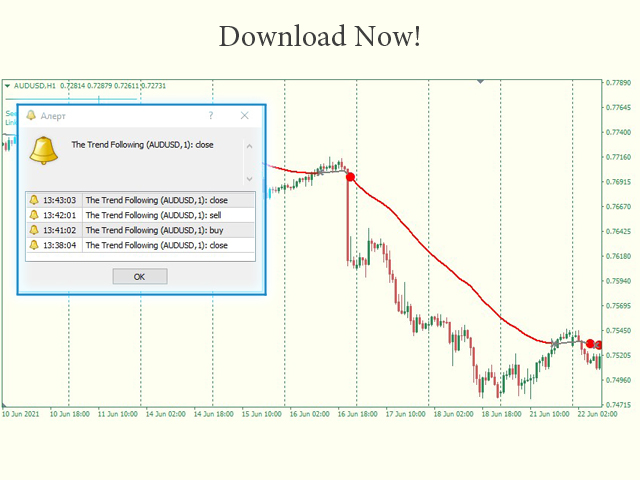
Monitors the current trend, gives signals for an uptrend, downtrend and weakening of the current trend.
Colors the situation on the market with the appropriate color.
Tool - any.
Timeframe - any.
Advantages
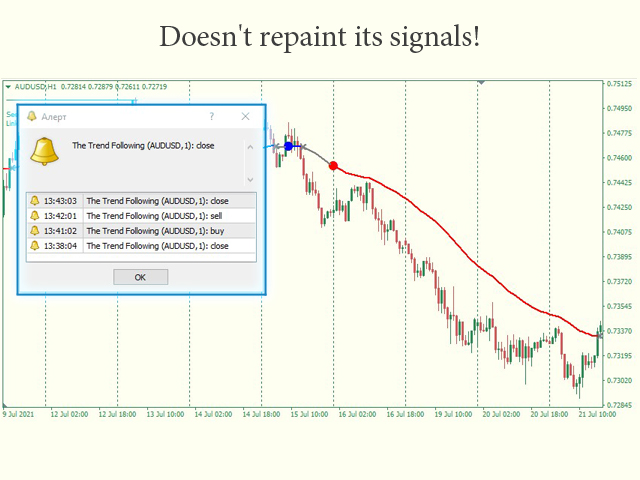
- The indicator does not repaint its signals.
- There are alert signals.
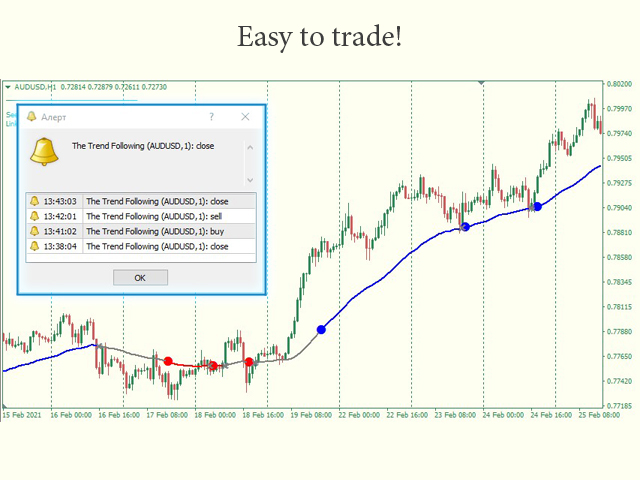
- Easy to use.
- Flexible settings.
- Suitable for trading any financial instruments.
Settings
| Name | Description |
|---|---|
| Fast parameter | The value of the fast parameter in the indicator (Should be less than the slow one). |
| Slow parameter | The value of the slow parameter in the indicator (Should be greater than the fast one). |
| Indicator period | Indicator period. |
| Alerts | Alert permission. |
Also see other products of this author:
https://www.mql5.com/ru/users/tonybeat/seller
Subscribe to my telegram channel, where we discuss intraday trading, ideas, indicators, etc., a link in my profile contacts.


ユーザーは評価に対して何もコメントを残しませんでした