Bullcrack
- インディケータ
- Emmanuel Urua Abel
- バージョン: 1.1
- アクティベーション: 5
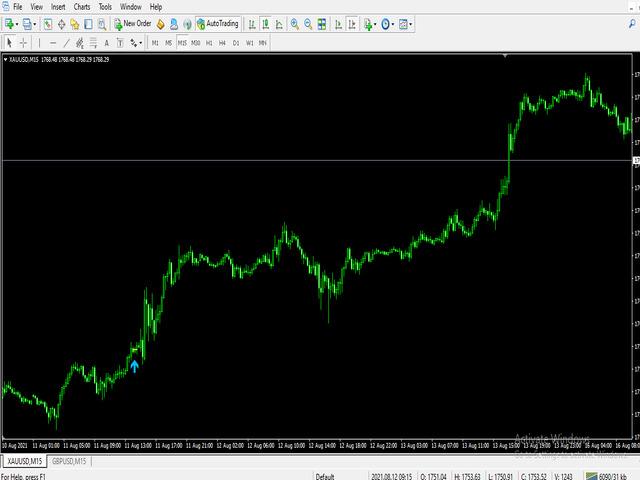
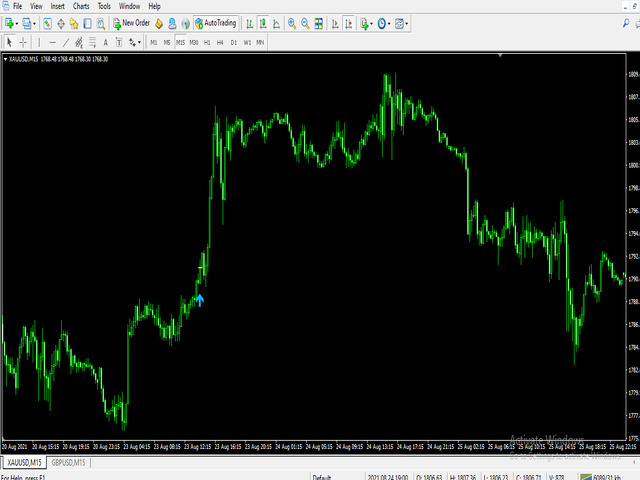
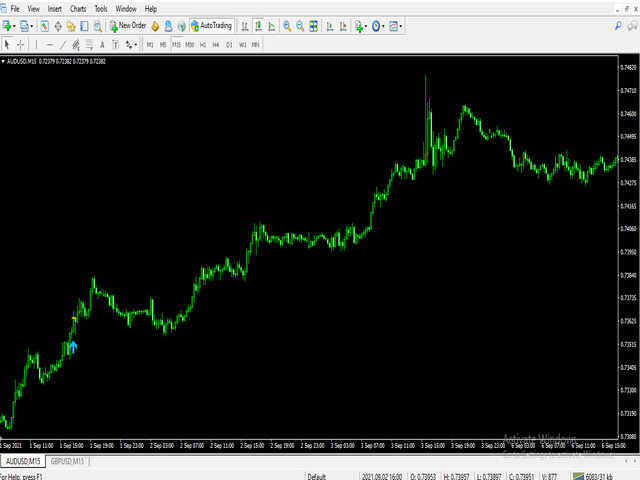
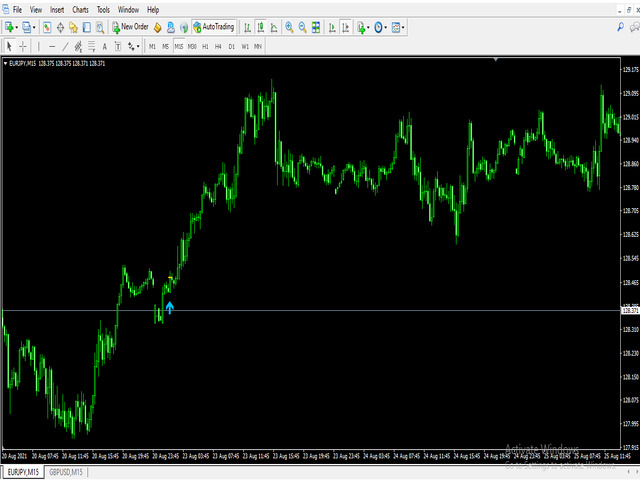
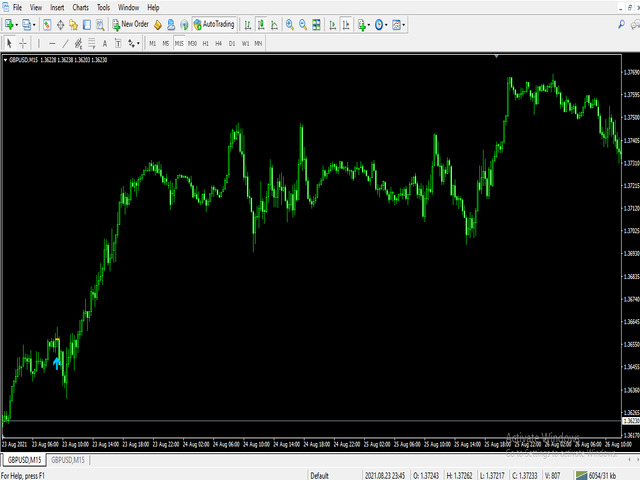
BULLCRACK MT4
*Non-Repainting Indicator/Analyzer
Pick trades when it 20-30 confirmed a bull trend.
No need to filter trades as every single signal has gone through multiple levels of confirmations.
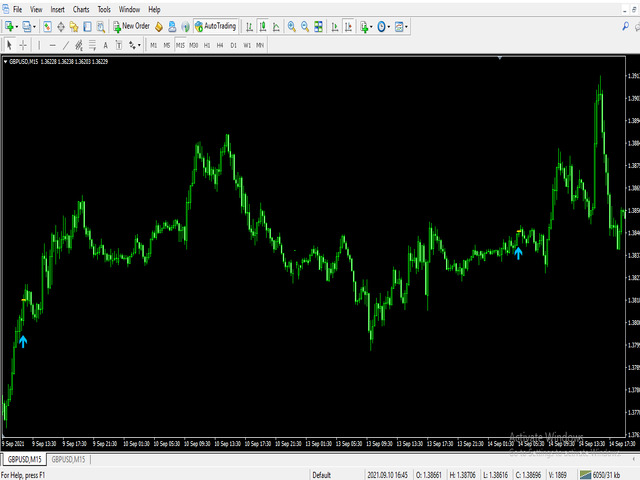
Strictly on buy trades .
STRICKTLY FOR THE 15MINS TIMEFRAME!!
Trades any pairs .
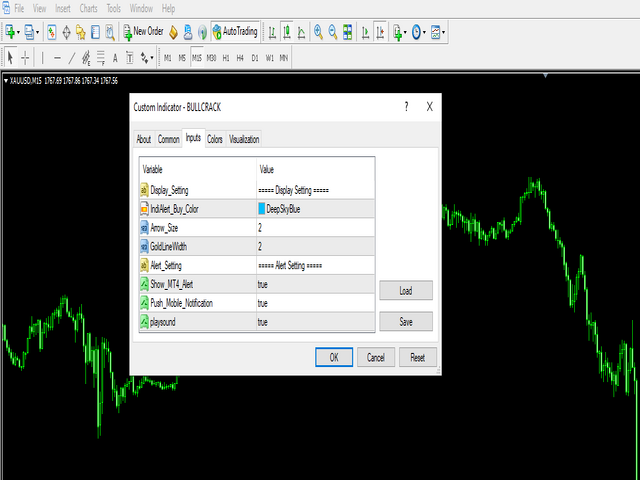
*Push notifications to phone or computer
* For Scalping
* For Swing Trading
*Arrow Appears at The "Close Of The Candle"
*popup alerts*
No much trades cause no random trades!
**very perfect for Expert and New Traders! Just seat back and take Alerts with proper risk management ....
Explore multiple pairs if you want more trades.
DM is open for support.