Breaking Pro MT5
- インディケータ
- Tais Miranda Hoffmann
- バージョン: 1.30
- アップデート済み: 7 2月 2022
- アクティベーション: 5
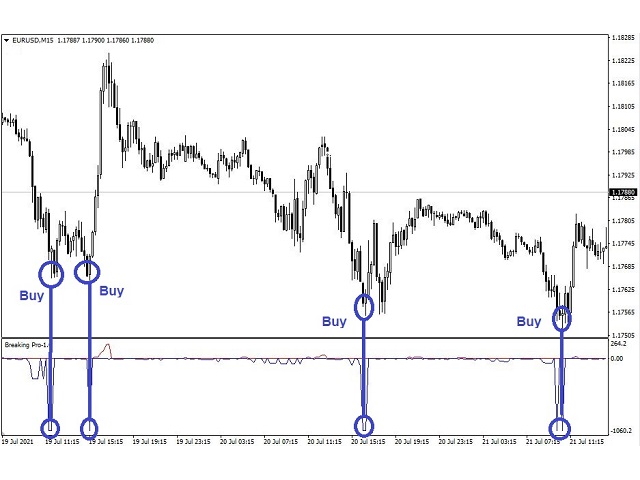
A indicator to show saturation in buying or selling
With fast and complex mathematical calculations
Easily find saturation points for buying or selling
Can be used in all symbols and time frames with many signals
Can be combined with different indicators and different time frames
With simple settings and simple working methods
- Can be used on all symbols
- Can be used in all time frames
- Can be used in all markets (Forex, stock, etc.)
- Large number of signals
- Same performance on all time frames
- With fast support
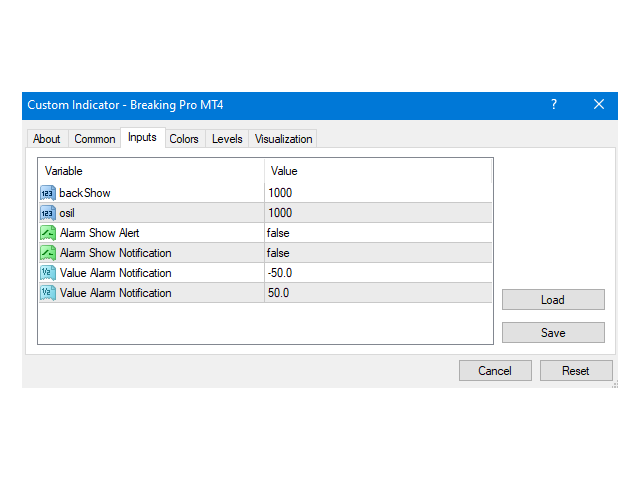
Back Show: The number of candles that this indicator calculates. You can increase this number as much as you need this indicator. Note that this number is not infinite like other indicators.
Because in that case, the complex calculations of this indicator would take time
osil: Number of candles calculated:
Determine the number of candlesticks that should participate in mathematical calculations. After running the indicator, you will get acquainted with these settings and you will understand.
The higher the value of these settings, the lower the number of signals, but The higher this number, the higher the win rate of signals
In my opinion, the best settings are the default settings
Unfortunately, I can not reveal the details of how this indicator is calculated
Alarm Show Alert: Enable these settings if you want to receive a warning in MetaTrader when receiving a signal
Alarm Show Notification: Enable these settings if you want to receive a warning in your phone when receiving a signal
Value Alarm Notification: Specify the number at which you receive the signal. (Select the lower range)
The larger the number, the stronger your signal
Value Alarm Notification: Specify the number at which you receive the signal. (Select the upper range)
The larger the number, the stronger your signal
Tell me if you need more settings
If you have any questions, I will be happy to answer
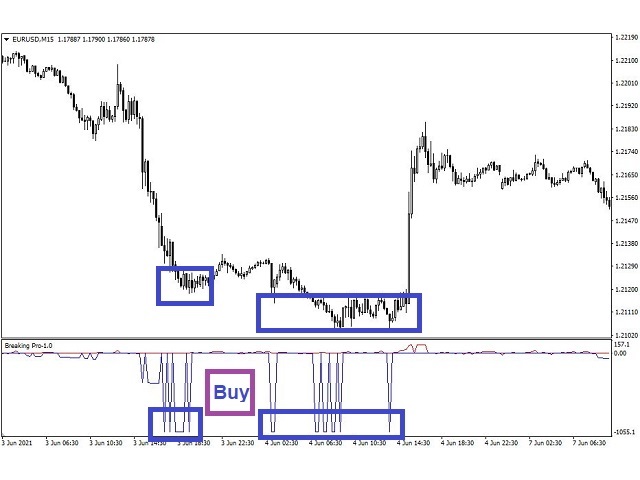
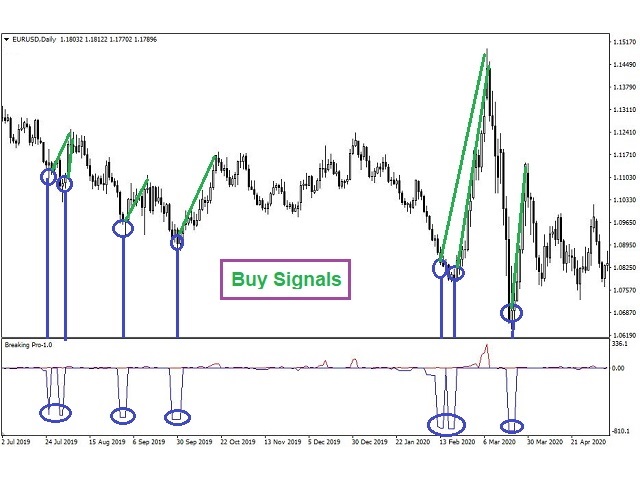
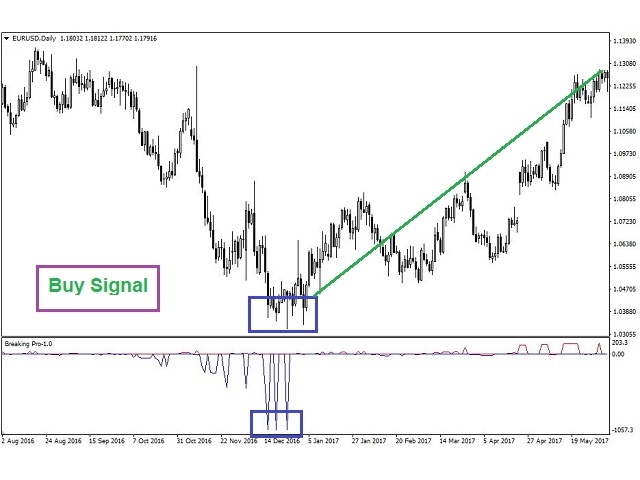
This indicator is based on mathematical calculations. The number of candles you see in the settings is calculated. Determine the saturated points.
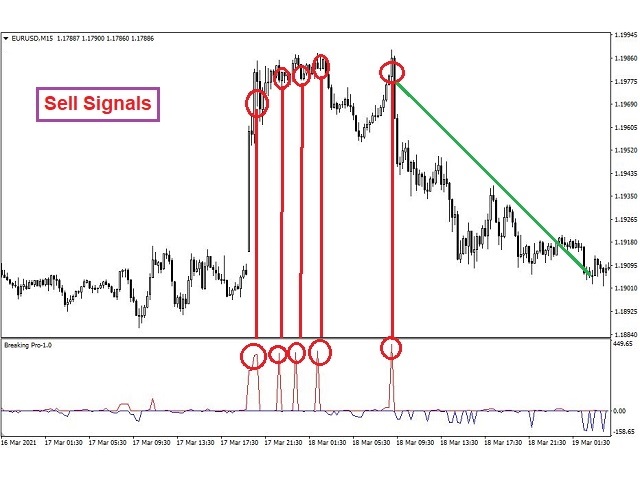
If the Buy rate is too high, it tells us that we have a Sell signal And conversely
When Sell are high, the blue chart becomes very large.
This is the best time to signal a buy.
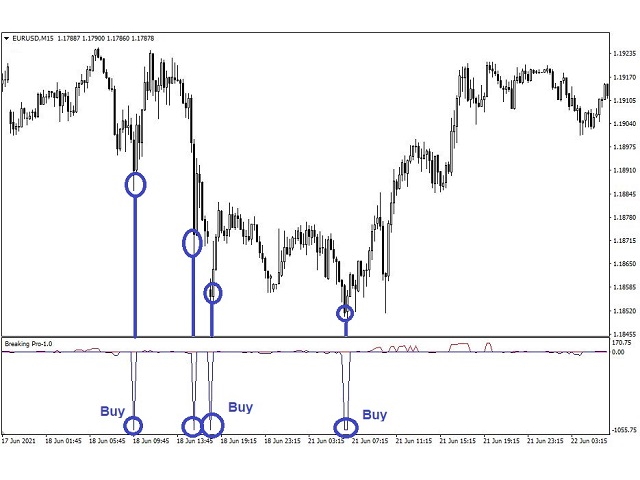
When buy are high, the red chart becomes very large.
This is the best time to signal a Sell.
To increase the win rate, it is better to use several time frames at the same time. Or even from several currency pairs. Or a few indicators.


great