Mommentum Channel
- インディケータ
- Noiros Tech
- バージョン: 1.0
YOU CAN NOW DOWNLOAD FREE VERSIONS OF OUR PAID INDICATORS . IT'S OUR WAY OF GIVING BACK TO THE COMMUNITY !
Momentum channel is a simple momentum based system yet with a great degree of accuracy in detecting turning points. The market momentum are defined by Average True Range Channels . When price breaks these channels most times , it is an indication of a shift in market momentum and thus a possible new trend formation.
The system can be traded on any time frame and symbol and can also be used to trade commodities and stocks.
INPUT MENU
- ATR_Period : Average True Range Momentum Period
- ATRMultip : First Momentum multiplier
- ATRMultip1 : Second Momentum multiplier
- Enable_PopUp_Alert : Enable / Disable Notifications
We Are Social
Join our Telegram Channel To get free daily signals and faster support on our products .
Also get daily trading tips , news and advice . Kindly Follow Us : Click Here
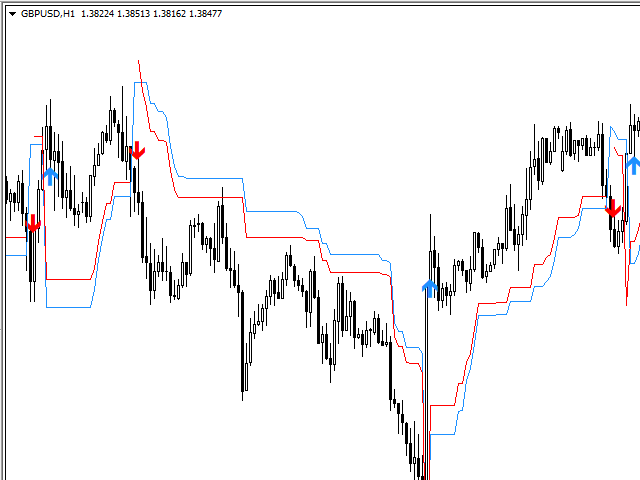
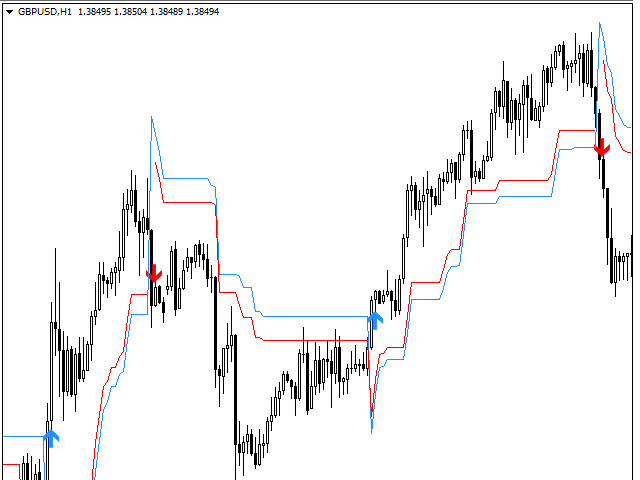
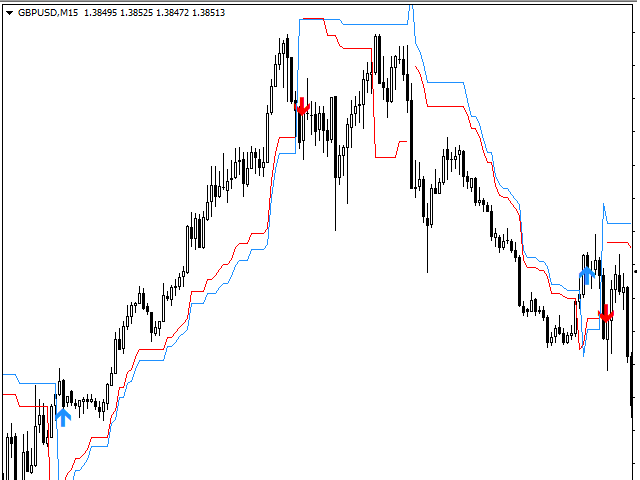


Signal is adjustable within the settings, there's no judgement with this. Trends prevail and shown with this indicator; crucial!