Flag MT5
- インディケータ
- Dmitry Fedoseev
- バージョン: 1.5
- アップデート済み: 5 10月 2021
- アクティベーション: 5
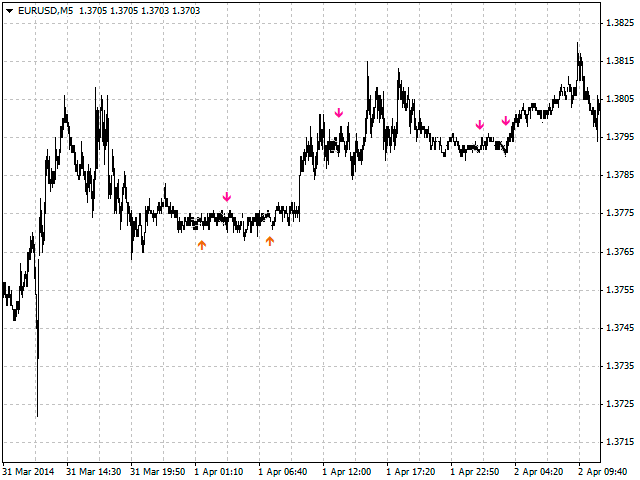
An indicator of patterns #21, #22, #23 ("Flag") from Encyclopedia of Chart Patterns by Thomas N. Bulkowski.
Parameters:
- Alerts - show alert when an arrow appears
- Push - send a push notification when an arrow appears (requires configuration in the terminal)
- PeriodBars - period in bars
- K - an additional parameter that influences the accuracy of pattern shape recognition. The influence of the parameter will be visible if not all of the pattern variants are enabled (not all three parameters Expanding, Tapered, Parallel)
- InclInDir - an arrow directed toward the flag slope or in the opposite direction
- Expanding - expanding flag
- Tapered - tapered flag
- Parallel - parallel flag
- ArrowType - a symbol from 1 to 17
- ArrowVShift - vertical shift of arrows in pixels
- ShowFlag - show patterns as lines
- Color - color of lines.
Note. An arrow appears on a forming bar and can disappear as the bar changes.
It cannot be guaranteed that the indicator recognizes the patterns exactly as implied by the author.
Recommended optimization parameters: PeriodBars, K and different combinations of InclInDir, Expanding, Tapered, Parallel.