Universal Reversal
- インディケータ
- Matthias Effler
- バージョン: 1.1
- アップデート済み: 20 12月 2021
- アクティベーション: 5
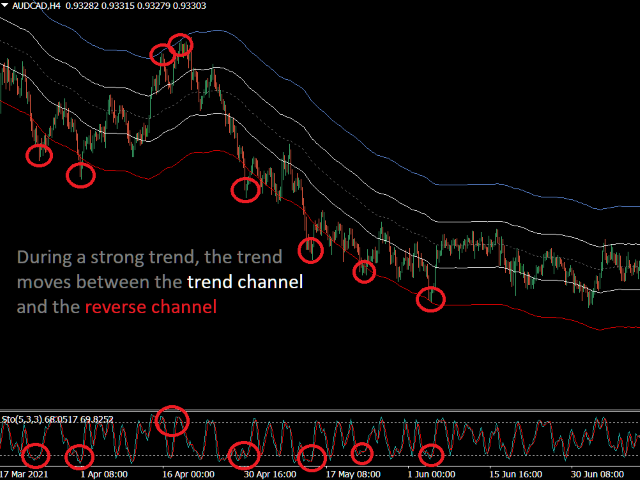
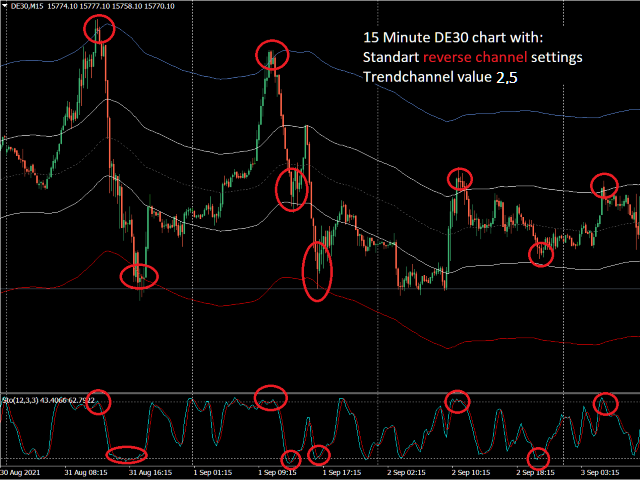
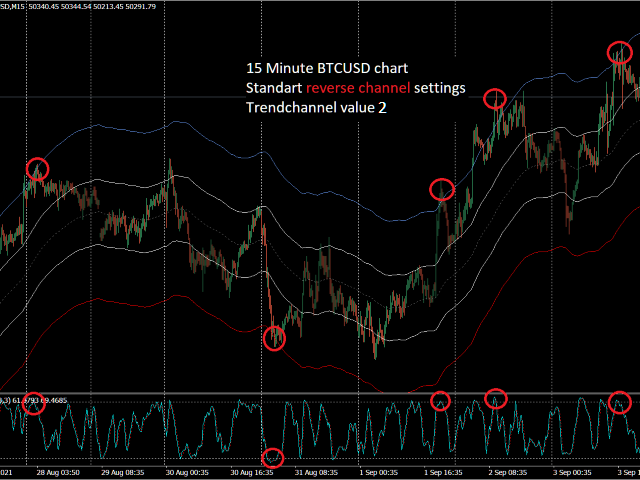
These channels can be used for reversal / trending strategies. Ideally with the help of the stochastic indicator or another preferred indicator. A combination of two indicators provides a solid foundation for trading.
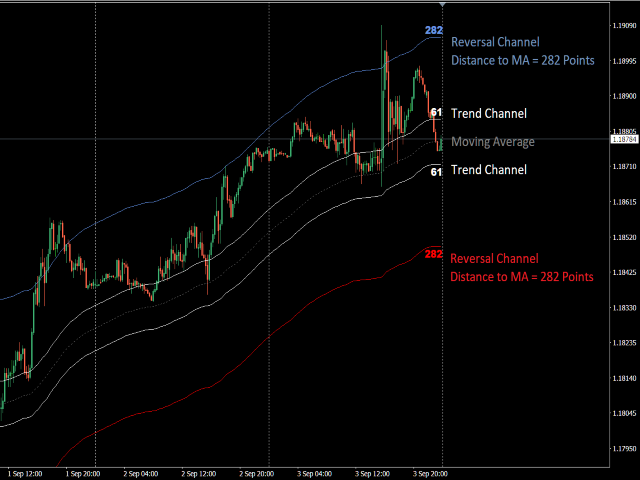
Reverse Channel
The following values are recommended:
| Currency | Average Value | Check history bars | MA Period | Divide Lines |
|---|---|---|---|---|
Forex (EUR/USD...) | 6 - 10 | 1000 | 100 | 2,5 - 3 |
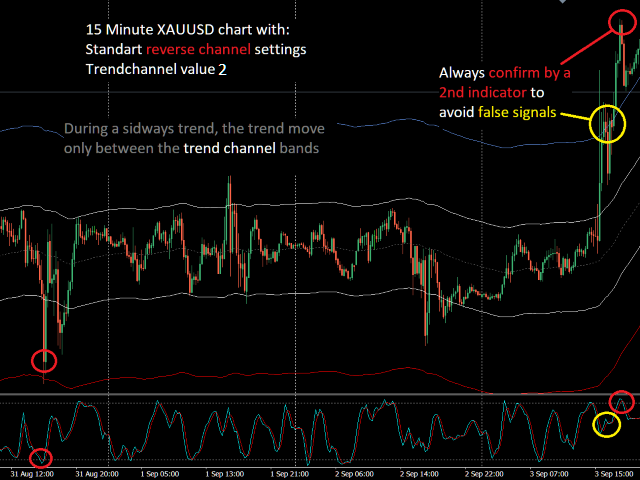
Metal (XAU/USD...) | 2 - 5 | 1000 | 100 | 2 - 2,5 |
Crypto (BTC/USD...) | 2 - 5 | 1000 | 100 | 2 |
Average Value
This value defines the number of reversal points. The higher this number, the narrower the reverse channel. Depending on what is being traded, this value should be increased or decreased.
Check history bars
The number of historical candles that will be used to draw the Reversal Channel.
Divide Lines
The user entered the factor by which the value of the outer channel is divided. The trend channel is drawn on the basis of this.
Individual channel
If an individual channel is preferred, the value can be entered in section 2. The value "0" automatically determines the channel on the basis of the historical candles and the reversal points. All other values generate an individual channel.
The reversal / trend channel can be shown / hidden with the parameters specified in section 3.