Pair Direction
- インディケータ
- Mr Nukool Chanchingchit
- バージョン: 1.1
- アップデート済み: 5 9月 2021
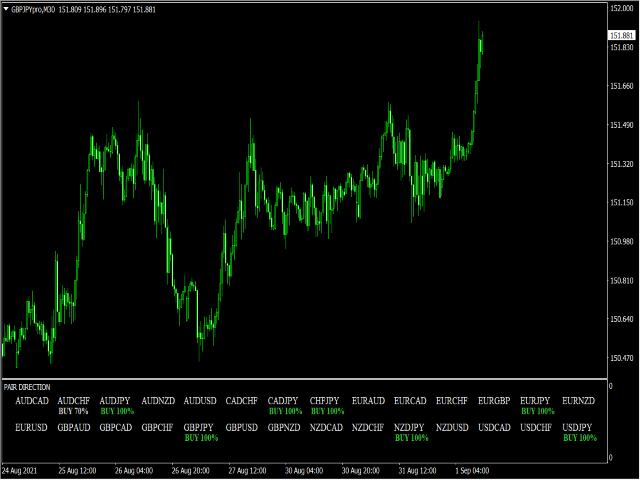
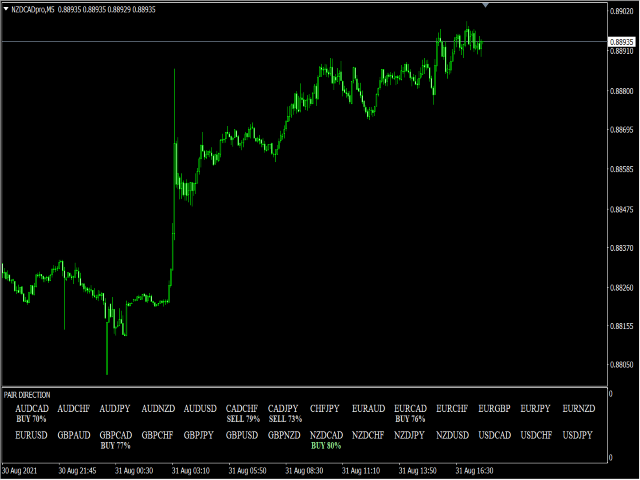
What is a tool ?
This indicator use for forecast direction of the 28 pairs, Calculates from multiple pairs and timeframes and present by percentage as 70-79% , 80-89% , 90-100% is a little, medium and strong trend.
How to use
Place the indicator on any pair and any timeframe.
Pair : Any
Timeframe : Any
Input Parameter
-
No
On white theme the letters and numbers don't showed ,but all ol