Retracement Feeder MT5
- インディケータ
- Innovicient Limited
- バージョン: 1.5
- アップデート済み: 29 7月 2022
- アクティベーション: 20
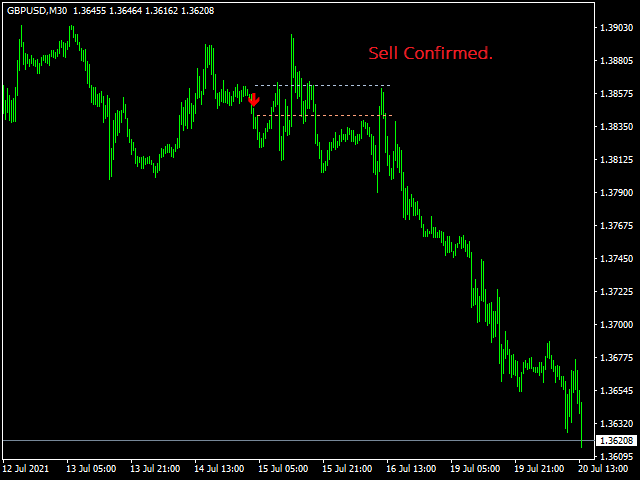
The Retracement Feeder checks for retracement opportunities after the first move has occurred.
Basically it scans for the second wave of trend.
- Works with any financial instrument,
- It does not repaint/change color or cancel arrows,
- Easy to set and use.
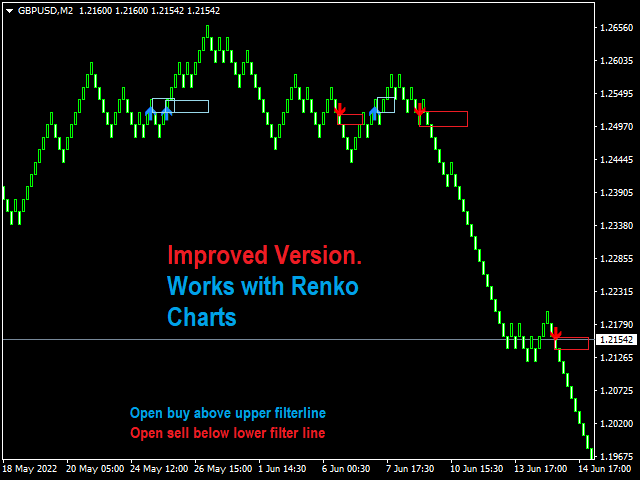
- Works great with Renko Charts
MT4 version: https://www.mql5.com/en/market/product/67443
How it works
- The indicator is based on RSI and Stochastics.
- The algorithm used in the Retracement Feeder allows the Stochastic and RSI to minimize the turns and twists thereby reducing false oversold and overbought signals.
- It scans for a buy retracement when the asset is oversold and for sells when overbought.
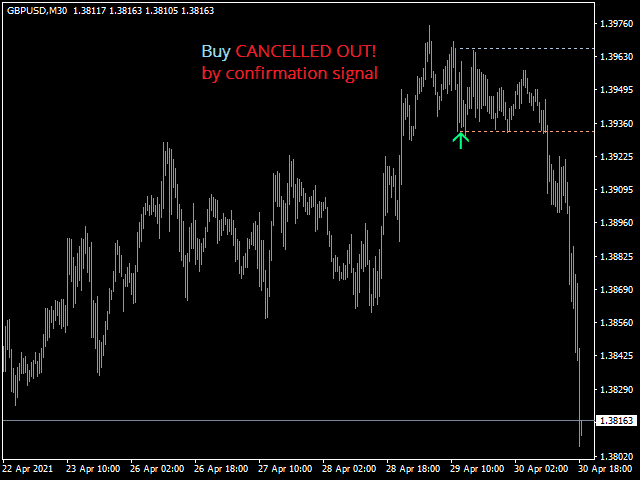
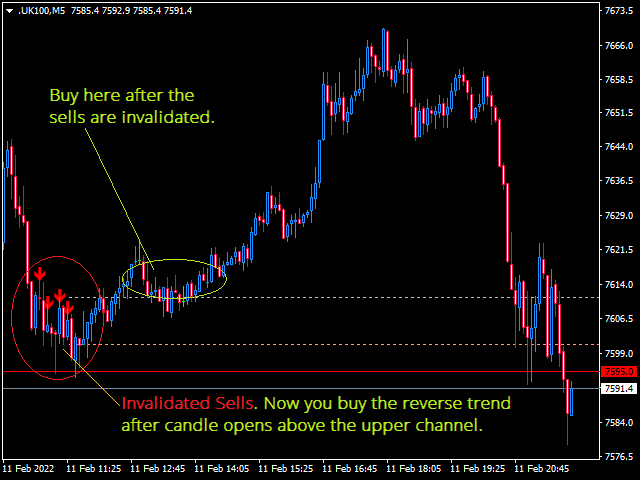
- Place a buy entry if a candle opens above the upper trendline irrespective of the arrow that forms. If a sell arrow forms but the following candles open above the trendline open buy since the reverse signal has been initiated. Same rule applies to sells.
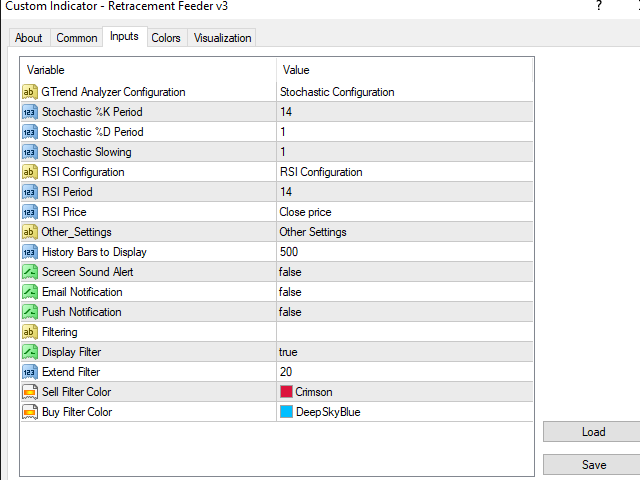
Settings
The indicator is straightforward to set up
- Stochastic %K Period [This is the Stochastic period. The tests have been conducted with a value of 100]
- Stochastic %D Period [This is the %D period. The tests have been conducted with a value of 1 ]
- Stochastic Slowing [This is the Stochastic slowing. The tests have been conducted with a value of 1 ]
- RSI Period[The value can be adjusted if needed]
- RSI Price [You can tinker this, but close has been used to test efficiency]
- Enable Alerts [email, screen, and metatrader notifications alerts]
- History Bars to Display [This is the number of arrows you want to display on your mt4]