• 概要
  • レビュー
  • コメント

Emergency

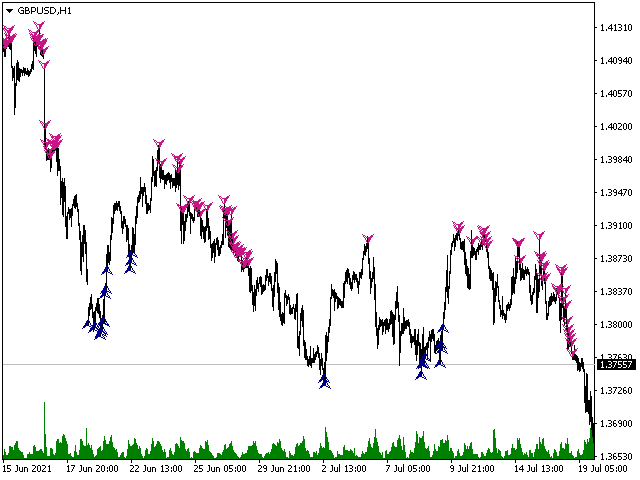
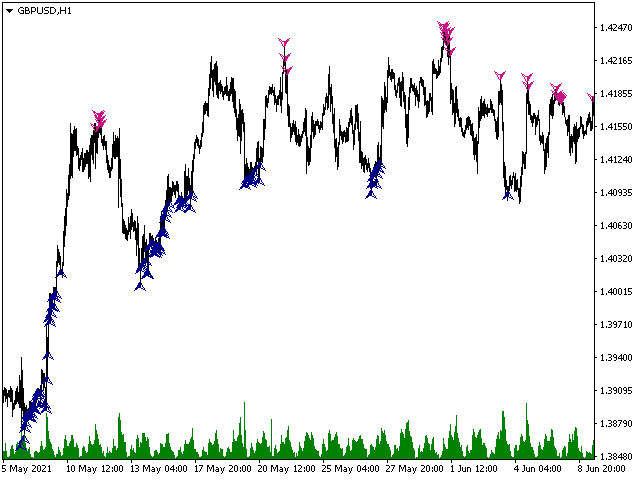
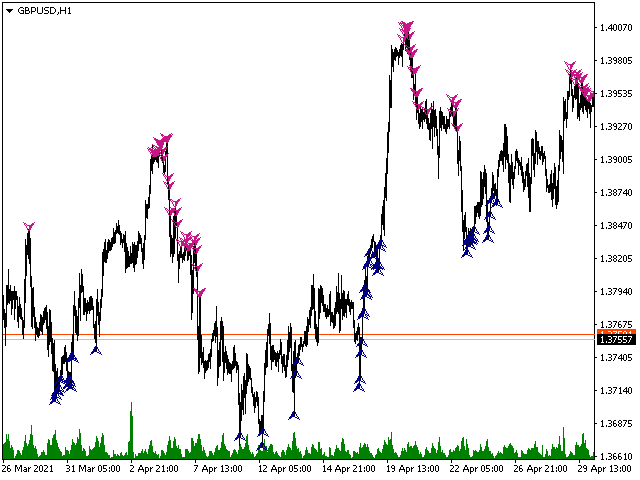
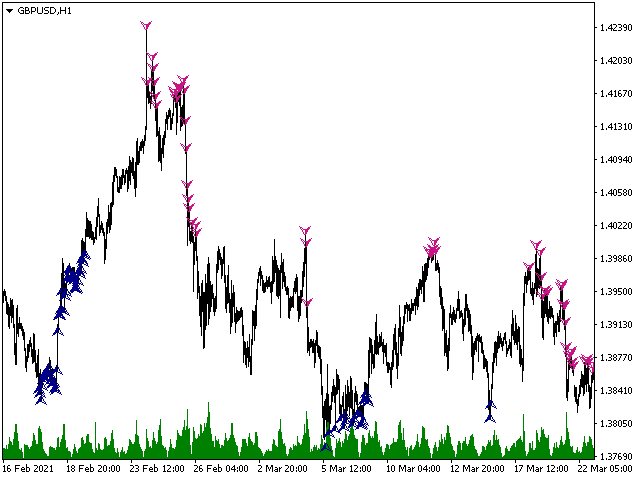
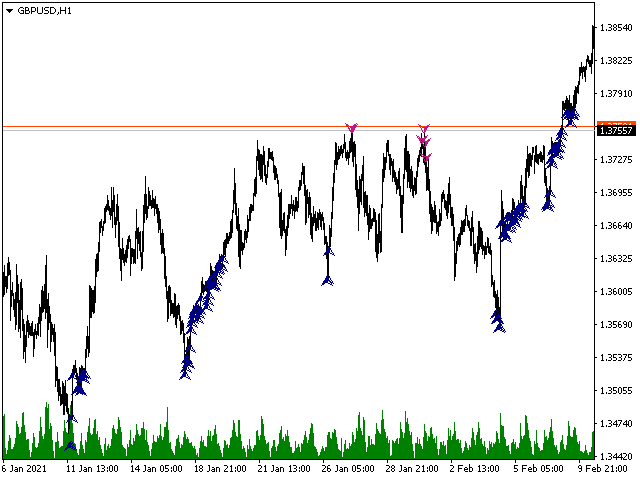
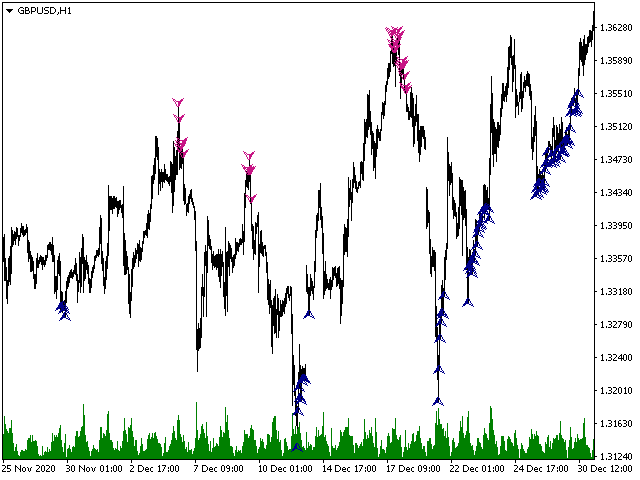
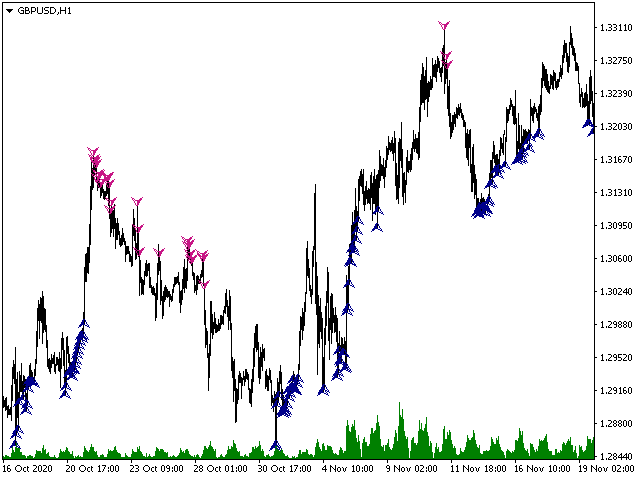
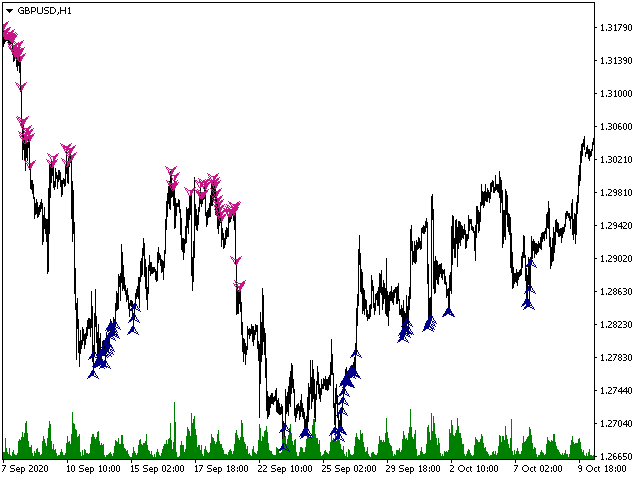
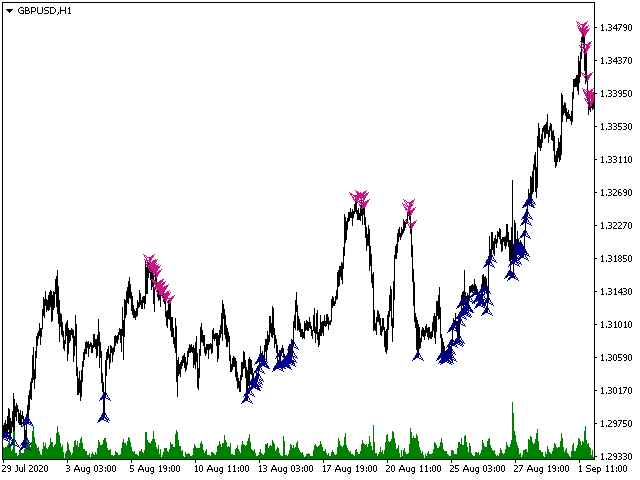
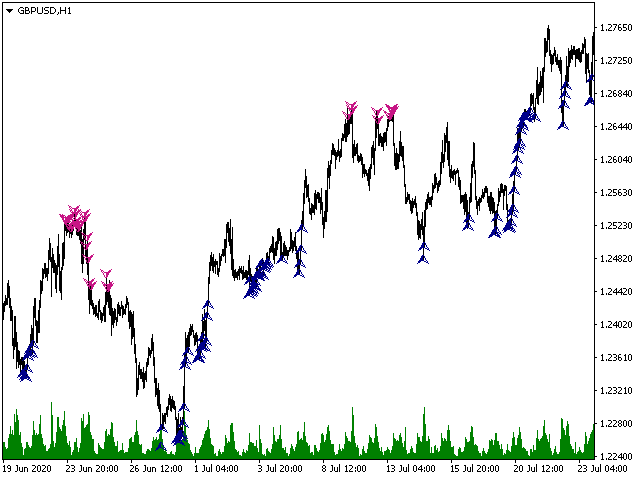
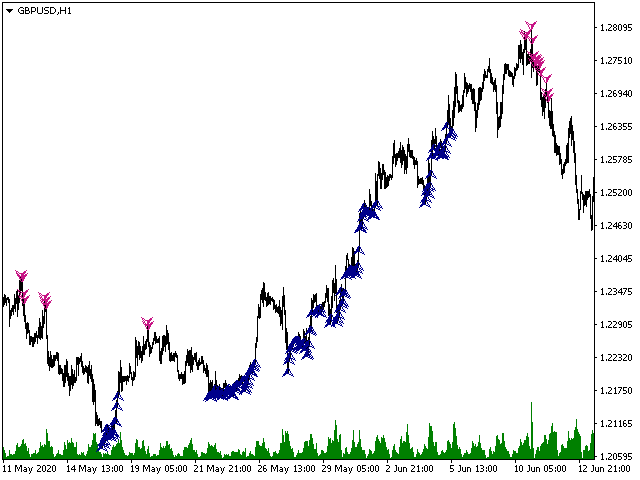
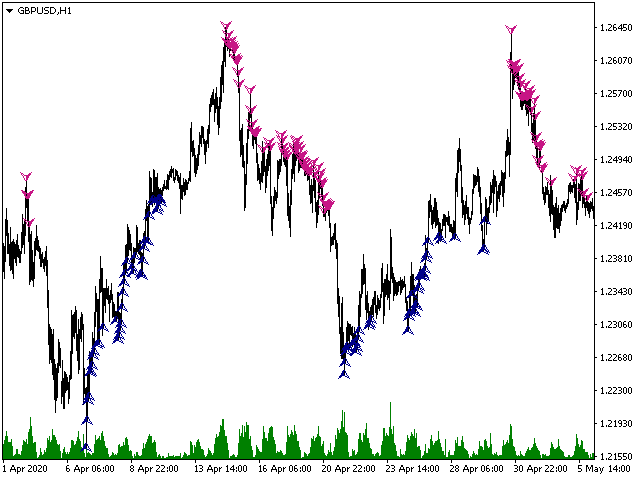
Emergency trend technical indicator is used to analyze price movements in the Forex market. It is included in the so-called arrow indicators. And it is very practical in that it forms arrows in places where buy signals appear, or, conversely, sell signals.

Naturally, do not forget that any indicator is just an assistant, not a magical tool, by the will of which you will become fabulously rich.

Unfortunately, many novice traders forget about this, they see a potential grail in each indicator, which is not worth doing at all. No indicator will ever tell where the price will go, we cannot know this.

In general, the whole point of trading comes down to probability, somewhere it is more, and somewhere it is less. Use the indicator as you see fit.
おすすめのプロダクト
The intelligent algorithm of the Godfather indicator accurately determines the trend, filters out market noise and generates entry and exit levels. The indicator will help in finding entry points when analyzing the price chart. The program first receives a "snapshot" of the graph, then analyzes it. The results are reported to the trader in the form of signals. The main purpose of this indicator is to determine the moments of entries and exits from transactions, so the indicator displays only th
HeikenashiSmoothing
Rodolfo Leonardo De Morais
Heiken ashi Smoothing in separate window MTF The color of the Heiken-Ashi candles depend on their shadows. The advantage of the Heiken-Ashi chart is that the trend is determined very simply, the upward-facing sails are blue, and the downward-tendency sails are red. For profitable trading it is necessary to use it with the standard candles (make analyzes) and with the other indicators. Indicator Parameters TimeFrame - Graphic time being 0 = Current graph time, 1 = M1, 5 = M5, 15 = M15, 30 = M30
Mystic Arrow
Svyatoslav Kucher
5 (3)
Mystic Arrow - уникальный авторский индикатор, отображающий сигналы в направлении основной тенденции, и против нее. Благодаря разнообразию настроек и фильтров индикатор можно настроить под свой стиль торговли. Mystic Arrow  подходит для любого таймфрейма, валютной пары. Сигналы индикатора не пропадают ни при каких условиях. Отличительной особенностью является возможность настроить сигналы индикатора отдельно для тенденции и против нее. Имеет в качестве отключаемого фильтра показания ценового кан
Trading with the Transition to quality indicator is as simple as possible, if a blue arrow appears on the chart pointing up, a buy deal is opened. In the same case, if you see a red arrow pointing down, open a sell order. That is, everything is as simple as possible, positions are closed according to the reverse scheme, that is, as soon as a signal is received to open an order in the opposite direction from your position. For example, you opened a long position (sell), close it when a red arr
Introduction This indicator detects volume spread patterns for buy and sell opportunity. The patterns include demand and supply patterns. You might use each pattern for trading. However, these patterns are best used to detect the demand zone (=accumulation area) and supply zone (=distribution area). Demand pattern indicates generally potential buying opportunity. Supply pattern indicates generally potential selling opportunity. These are the underlying patterns rather than direct price action. T
Trend Sys, an indicator designed to detect trends in price movement and allows you to quickly determine the direction of the trend. The best way to trade Trend Sys is to enter the market when Trend Sys peaks and goes the other way. This is a sign of a trend reversal. I hope you enjoy this indicator and leave your comments to make it even better. Good luck and happy trading.
Over Arrow  - уникальный авторский индикатор, имеющий возможность отображения сигналов в направлении основной тенденции, или против нее. Over Arrow  подходит для любого таймфрейма, валютной пары, но лучше всего использовать его на средних временных периодах, таких как М30, Н1, Н4. Сигналы индикатора не пропадают ни при каких условиях. Отличительной особенностью является наличие фильтра тенденции, при активации которого, сигналы будут появляться только в направлении основного движения. Параметр
Aura Eclipse MT4
Stanislav Tomilov
5 (4)
Aura Eclipse  is a fully automated EA designed to trade  currencies during evening and night hours .  It is based on machine learning deep neural network analysis and smart scalping  algorithms. The first multi-currency scalper uses deep machine learning mechanism - Keras. Its a deep learning API written in Python, running on top of the machine learning platform   Tensor Flow . It was developed with a focus on enabling fast experimentation.  Keras provides industry-strength performance and scala
外国為替矢印インジケーターは、通貨市場でスキャルピングを成功させるために不可欠なツールです。 これにより、トレーダーはいつ売買ポジションを開く価値があるかを簡単に判断できるため、チャート分析に時間を費やすことなく利益を上げることができます。 一種の信号機であるインジケータの赤と青の矢印は、トレンドの方向を簡単に判断できる視覚的なツールです。 赤い矢印はショート ポジションを開く、つまり通貨ペアを売る可能性を示し、青い矢印はロング ポジションを開く、つまり通貨ペアを買う可能性を示します。 しかし、重要なのは矢印の色だけではありません。 インジケーターには、トレーダーがいつポジションに出入りするかをより正確に判断するのに役立つ他のパラメーターもあります。 たとえば、矢印ごとに、インジケーターは価格レベルを表示でき、到達するとポジションを開く必要があります。 移動平均、ボラティリティ、時間間隔など、他のパラメータも設定できます。 - これらすべてが、トレーダーが市場の動きをより正確に予測するのに役立ちます。 外国為替矢印インジケーターは、トレンド、横方向の動き、ボラティリティの高低など、さ
**Binary Smart Systemのご紹介:究極のトレードパートナー** Binary Smart Systemは単なるインジケーターではありません。様々な市場で的確なシグナルを提供し、洗練されたアルゴリズムと豊富なテクニカルインジケーターの集合をベースにした、トレーダーを的確さとタイムリーなシグナルで装備するための厳選されたトレードツールです。 **インジケーターコンポーネント:** 1. **移動平均パーセンテージ(MAP):** このコンポーネントは複数の移動平均の加重平均を計算し、トレンドの特定の強力な基盤を形成します。MAPは市場の状況に動的に適応し、現在のトレンド方向に対する洞察を提供します。 2. **商品チャネル指数(CCI):** 平均価格からの偏差を分析することで、CCIは買われすぎと売られすぎの状態を評価します。Binary Smart SystemのCCI統合は、ポテンシャルな反転ポイントを特定する包括的なアプローチを保証します。 3. **移動平均収束拡散法(MACD):** シンプルなクロスオーバーを超えるMACDコンポーネント
Super Cross Strong Signal is an indicator that generates trade arrows. It generates trade arrows with its own algorithm. These arrows give buying and selling signals. The indicator certainly does not repaint. Can be used in all pairs. Sends a signal to the user with the alert feature. Trade rules Enter the signal when the buy signal arrives. In order to exit from the transaction, an opposite signal must be received. It is absolutely necessary to close the operation when an opposite signal is r
This is  a dashboard indicator that displays the Average Level of each selected currency pairs that filters and gives us a signal for overbought (>=90%) or if price at extreme peak above 90, and/or oversold (<=10%) or if price at extreme peak below 10. The calculation is using Relative Strength Index default periods (2 & 9) applied to three different higher time frames H4,D1,&W1. This won't change or altered even if you change symbol or switch to lower time frames or even in monthly and y
This is a professional Trend Sim indicator. The intelligent algorithm of the Trend Sim indicator accurately detects the trend, filters out market noise and generates input signals and exit levels. Functions with advanced statistical calculation rules improve the overall performance of this indicator. The indicator displays signals in a simple and accessible form in the form of arrows (when to buy and when to sell). Knowing the entry point of each of the currencies is very important for every
PTW NON REPAINT TRADING SYSTEM + HISTOGRAM Non-Repainting ,   Non-Redrawing   and   Non-Lagging  Trading System. Does the following: - Gives Accurate Entry and Exit Points - Scalping, Day and Swing Trading  - 95% Accuracy  - Targets, where to take profits. - Shows Trends, Support and resistance levels - Works on All Brokers - Works on All Currencies, CFDs and Stocks - It does not place trades for you, it only shows you what trades to place. - It works on All Timeframes - It is for Trend or ra
The Burst MT4 Hurry and Buy Before Price Doubles Tomorrow! *Non-Repainting Indicator "The Burst" is an indicator that shows precise Buy and Sell Trades. A great arsenal to add to any chart. It's Best to Use The D1,H4 or H1 chart "The Burst" is designed to alert BUY and SELLS. So Of course, For the best take The Arrows In a Uptrend or Downtrend Only For Confirmation *Non-Repainting *For Desktop MT4 Only *Great For Scalping *Great For Intraday *Great For Swing Trading *Arrow Appears at  The "Clo
Impulse fractals indicator - is counter-trend oriented complex market fractal pattern.  Market creates bull/bear impulse, trend starts, fractals on impulsed wave are an agressive pullback signals. Buy arrow is plotted when market is bearish and it's impulse showed up-side fractal, and sell arrow is plotted when market is bullish and it's impulse showed dn-side fractal. Main indicator's adjustable inputs : impulsePeriod - main period of impulse histogram  filterPeriod  - smoothes impulse accordi
Cloud Stair is an Indicator has 2 Cloud (Up Trend and Down Trend). Cloud will turn Red when trend go down. Cloud will turn Blue when trend go up. You can use this indicator as a Support and Resistance level. Trend very strong when there are no opposite side. Open Buy position when the indicator show blue cloud and no red cloud. Open Sell position when the indicator show red cloud and no blue cloud.
The intelligent algorithm of the Calc Flagman indicator determines the trend well, filters out market noise and generates entry and exit levels. The indicator shows potential market reversal points. Works on all currency pairs and on all timeframes. Ready trading system. Uses only one parameter for settings. Simple, visual and effective trend detection. The indicator does not redraw and does not lag. You can set up message alerts as sound or email.
このインジケーターは、実際の取引に最適なウェーブ自動分析インジケーターです。 バンドの標準化された定義は、もはや異なる人々の波ではなく、人為的な干渉の描画が排除されます。これは、アプローチの厳密な分析において重要な役割を果たします。           現在購入割引!   =》 Increase the choice of international style mode, (red fall green rise style) インデックスの内容: 1.1。       基本波: まず、価格変動過程で基本変動の変曲点を見つけましたが、もちろん、彼の注文はそれほど強くないので、次の計算の基礎になります。 2.2。       二次帯域 :基本波に基づいて、アルゴリズム分析を通じてより明白な二次帯域が得られ、二次帯域は波解析の基礎を提供します 3.3。       波: より明確な傾向とより明確で直感的な方向性があります。波が続くかどうかを分析するには、二次波帯の形状を調べ、二次波の組成を分析して、その後の予測を取得する必要があります。波。 4.4。       チャネ
Premium support and resistance - the best combination of different indicators allowed us to create the best product on the market! And that's Premium support and resistance! A convenient and flexible tool that will help you in trading! Shows where the price will go from the support and resistance levels! The arrows Blue buy Red sell will help you with this! Alert is already built into the indicator for your convenience! Alert in order not to miss the "Own" signal! It is already co
This indicator gives signals about a trend change, shows successful signals. High probability of a successful trend, it can be used with an optimal risk to profit ratio. The indicator does not redraw and does not lag, it can be used both for pipsing in small periods and for long-term trading. The indicator algorithm works using open prices, and you can work with a zero bar. It works on all currency pairs and on all timeframes.
Introduction to Fractal Pattern Scanner Fractal Indicator refers to the technical indicator that makes use of the fractal geometry found in the financial market. Fractal Pattern Scanner is the advanced Fractal Indicator that brings the latest trading technology after the extensive research and development work in the fractal geometry in the financial market. The most important feature in Fractal Pattern Scanner is the ability to measure the turning point probability as well as the trend probabi
Using the Arrow Effect forex indicator algorithm, you can quickly understand what kind of trend is currently developing in the market. The Elephant indicator accompanies long trends, can be used without restrictions on instruments or timeframes. With this indicator, you can try to predict future values. But the main use of the indicator is to generate buy and sell signals. The indicator tracks the market trend, ignoring sharp market fluctuations and noises around the average price. The indicator
Reliable Tool for the Financial Market This tool delivers high-performance results in trading on financial markets. Advantages: Fast and Accurate Signals: The arrow signals of this tool are easily and accurately analyzed, providing quality signals that you can rely on. No Repainting: This tool does not have any repainting, ensuring reliable trading signals. Quality Guarantee: If any signal repainting is detected, which we cannot correct, we will refund your money without commission. Recommendat
Algorithmic Signals indicator   is not an indicator but a strategy that generates entry/exit signals. The entry arrows are formed after multiple conditions are met. The indicator is using an   Adaptive Algorithm   which automatically adjust to the symbol and time frame (see the screenshots below) . Signals can be used for scalping or even trend trading. Main features:- Non repainting signals Entry signals Exit signals Alert for price reaching 1 x ATR(14) (could be utilized for initial take prof
Arrows appear after Reversal-Pattern and when the confirmation-candle reaches its value, it won't disappear (no repaint). but with fix settings no additional settings necessary Entry : immediately after arrow Stop loss : a few pips above the high of the arrow - candle / below the low of the arrow - candle Take Profit : at least the next candle / move to break even after candle closed / trail the SL works on : Major Forex-pairs / M15 and higher time-frames The Value of the  confirmation-candle =>
Niubility Trend  Niubility Trend displays the trend direction for all time frames in real time. You'll see at a glance at which direction the trends are running, how long they last and how powerful they are. All this makes it an easy-to-use trend trading system for beginners, advanced and professional traders. Features Easy to trade Customizable colors and sizes It is non-repainting and non-backpainting It is fantastic as a trailing stop method It implements alerts of all kinds
スキャルピング矢印は再描画されません -チャート上に価格反転ポイントを示し、そのシグナルを再描画しないインジケーター。また、インジケーターは電子メールとプッシュを介してトレーダーにシグナルを送信します。このインジケーターの信号の精度は、M5タイムフレームで約92〜94%、H1タイムフレームで95%以上です。したがって、この指標により、トレーダーは正確に取引を開始し、さらなる価格変動を予測することができます。チャート上の価格反転ポイントは、すべてのトレーダーに対してシンプルでわかりやすい矢印を使用して示されています。絶え間なく動的な市場の変化を考えると、この指標は過去の相場データを収集し、数学モデルを使用して学習することができます。 インジケーターはシグナルを再描画しません。 インジケーターは、M1からD1までの時間枠で機能します 重要! このインジケーターを購入すると、リンク https://www.mql5.com/ru/market/product/69755で最高の自動ボットの1つをギフトとして受け取ることができます 。 。 スキャルピング矢印がインジケーターを再描画しないこと
Anand is a forex trend arrow indicator for identifying potential entry points. I like it, first of all, because it has a simple mechanism of work, adaptation to all time periods and trading tactics. It indicates a short-term and long-term trend. operations. The simplest way to use the indicator is to open a trade in the direction of an existing trend. The indicator allows you to study the real and historical market trends in more detail! Determining the market trend is an important task for t
The basis of the indicator is based on my trading strategy, according to which I trade daily. I automated my system so that it would learn on the market independently. The indicator will not show transactions on the history of the chart, since all calculations of the trading system are in real time. Differences from other indicators: Real time calculations Dynamic Take Profits Dynamic Signals Trend Signals Ideal for beginners Any Currency Pair Any TimeFrame Suitable for scalping To
このプロダクトを購入した人は以下も購入しています
Reversal First Impulse levels (RFI)    INSTRUCTIONS        RUS       -       ENG              R ecommended to use with an indicator   -   TREND PRO -  Version MT5 A key element in trading is zones or levels from which decisions to buy or sell a trading instrument are made. Despite attempts by major players to conceal their presence in the market, they inevitably leave traces. Our task was to learn how to identify these traces and interpret them correctly. Main functions: Displaying active zones
まず第一に、この取引インジケーターは再描画されず、再描画されず、遅延しないことを強調する価値があります。これにより、手動取引とロボット取引の両方に理想的なものになります。 ユーザーマニュアル:設定、入力、戦略。 アトミックアナリストは、価格の強さとモメンタムを利用して市場でより良いエッジを見つけるためのPA価格アクションインジケーターです。ノイズや誤ったシグナルを除去し、取引ポテンシャルを高めるための高度なフィルターを備えています。複雑なインジケーターの複数のレイヤーを使用して、アトミックアナリストはチャートをスキャンし、複雑な数学的計算をシンプルなシグナルと色に変換します。これにより、どのような初心者トレーダーでも理解して使用し、一貫した取引の決定を行うことができます。 「アトミックアナリスト」は、新規および経験豊富なトレーダー向けにカスタマイズされた包括的な取引ソリューションです。プレミアムインジケーターとトップノッチの機能を1つの取引戦略に組み合わせ、すべてのタイプのトレーダーにとって汎用性のある選択肢にします。 デイリートレーディングとスキャルピング戦略:高
Enigmera
Ivan Stefanov
5 (3)
エニグメラ:市場の中核 https://www.enigmera.com はじめに このインディケータと取引システムは、金融市場に対する驚くべきアプローチです。ENIGMERAは、フラクタルサイクルを使用して、サポートとレジスタンスレベルを正確に計算します。本格的な蓄積局面を示し、方向性と目標を示します。 トレンド中でも調整中でも機能するシステムです。 どのように作動するのか? ENIGMERAは、支持線・抵抗線、目標線、乖離線の3つのラインで構成されています。このシステムは、過去のデータを現在と未来に外挿する典型的な市場指標とは異なり、現在の完全な画像を提供します。支持線上にある場合、それは本当の支持を意味し、抵抗線上にある場合、それは本当の抵抗を意味する。ある水準が破られた場合、それはトレンドの変化を意味する。再描画はしない。 市場は常に進化しているため、ENIGMERAはその評価ツールを適応させ、定期的に戦略を修正しています。  これにより、すべてのシナリオが徹底的に評価されることが保証されます。この市場指標の独自性は、その能力を見れば明らかです。  ENIGM
現在20%OFF! 初心者やエキスパートトレーダーのためのベストソリューション! このダッシュボードソフトウェアは、28の通貨ペアで動作しています。それは私達の主要な指標(高度な通貨の強さ28と高度な通貨インパルス)の2に基づいています。それは全体の外国為替市場の大きい概観を与えます。それは、すべての(9)時間枠で28の外国為替ペアのための高度な通貨の強さの値、通貨の動きの速度と信号を示しています。チャート上で1つのインディケータを使用して市場全体を観察し、トレンドやスキャルピングの機会をピンポイントで見つけることができたら、あなたのトレードがどのように改善されるか想像してみてください。 このインディケータには、強い通貨と弱い通貨の識別、潜在的な取引の識別と確認がより簡単になるような機能が搭載されています。このインディケータは、通貨の強さや弱さが増加しているか減少しているか、また、すべての時間枠でどのように機能しているかをグラフィカルに表示します。 新機能として、現在の市場環境の変化に適応するダイナミックなマーケットフィボナッチレベルが追加され、すでに当社のAdvan
Indicator : RealValueIndicator Description : RealValueIndicator is a powerful tool designed specifically for trading on the EURUSD pair. This indicator analyzes all EUR and USD pairs, calculates their real currency strength values, and displays them as a single realistic value to give you a head start on price. This indicator will tell you moves before they happen if you use it right. RealValueIndicator allows you to get a quick and accurate overview of the EURUSD currency pair tops and bottoms,
Trend Screener
STE S.S.COMPANY
4.83 (88)
トレンドインジケーター、1つのツールに組み込まれたすべての重要なトレンド機能を備えたトレンドトレーディングとフィルタリングのための画期的なユニークなソリューション! これは、すべてのシンボル/商品(外国為替、商品、暗号通貨、インデックス、株式)で使用できる100%再描画されていないマルチタイムフレームおよびマルチ通貨インジケーターです。 トレンドスクリーナーは、チャート内のドットで矢印トレンドシグナルを提供するインジケーターに続く効率的なインジケーターです。 トレンド分析インジケーターで使用できる機能: 1.トレンドスキャナー。 2.最大利益分析を備えたトレンドライン。 3.トレンド通貨強度メーター。 4.アラート付きのトレンド反転ドット。 5.アラート付きの強いトレンドドット。 6.トレンド矢印 毎日の分析例、毎日のシグナルパフォーマンス...など、トレンドスクリーナーインジケーターを使用して、ここで見つけることができます: ここをクリックしてください 期間限定オファー:トレンドスクリーナーインジケーターは、50ドルと生涯でのみご利用いただけます。 (元の価格125 $) MQ
Gold Channel is a volatility-based indicator, developed with a specific timing algorithm for the XAUUSD pair, which consists of finding possible corrections in the market. This indicator shows two outer lines, an inner line (retracement line) and an arrow sign, where the theory of the channel is to help identify overbought and oversold conditions in the market. The market price will generally fall between the boundaries of the channel. If prices touch or move outside the channel it is a tra
ECM Elite Channel is a volatility-based indicator, developed with a specific time algorithm, which consists of finding possible corrections in the market. This indicator shows two outer lines, an inner line (retracement line) and an arrow sign, where the channel theory is to help identify overbought and oversold conditions in the market. The market price will generally fall between the boundaries of the channel. If prices touch or move outside the channel, it's a trading opportunity. The
Gann Signal is a very simple indicator at first glance, but hidden inside is many years of experience in studying W.D.Ganna methods. The indicator gives accurate BUY/SELL signals, without redrawing. The indicator is very easy to use. All you need to do is attach it to your chart and follow its recommendations. The indicator constantly analyzes the market for entry opportunities. When such an opportunity appears, the indicator gives a signal in the form of an arrow. I repeat, all signals are NOT
Please send me Direct message on MQL5 CHAT after purchasing the Indicator for Training and Installation Support There are some additional files that is important to use with the Indicator . So be sure to contact me after purchasing the Indicator So that I can add you for training and support . If you find any difficulty with installation then send me Direct message here So that I can connect with you via Anydesk or Teamview for the product installation. " Smart Order Block Indicator " to find
Introduction to X3 Chart Pattern Scanner X3 Cherart Pattern Scanner is the non-repainting and non-lagging indicator detecting X3 chart patterns including Harmonic pattern, Elliott Wave pattern, X3 patterns, and Japanese Candlestick patterns. Historical patterns match with signal patterns. Hence, you can readily develop the solid trading strategy in your chart. More importantly, this superb pattern scanner can detect the optimal pattern of its kind. In addition, you can switch on and off individu
TrendMaestro
Stefano Frisetti
5 (3)
note: this indicator is for METATRADER4, if you want the version for METATRADER5 this is the link:  https://www.mql5.com/it/market/product/108106 TRENDMAESTRO ver 2.4 TRENDMAESTRO recognizes a new TREND in the bud, he never makes mistakes. The certainty of identifying a new TREND is priceless. DESCRIPTION TRENDMAESTRO identifies a new TREND in the bud, this indicator examines the volatility, volumes and momentum to identify the moment in which there is an explosion of one or more of these data a
もちろんです。以下は、提供いただいたテキストの日本語への翻訳です: MT4用の天文学指標をご紹介します:究極の天体トレーディングコンパニオン トレーディング体験を天空の高みに高める準備はできていますか?私たちの革命的なMT4用の天文学指標をご紹介します。この革新的なツールは、複雑なアルゴリズムの力を借りて、類まれなる天文学的洞察と精密な計算を提供します。 あなたの指先で宇宙の情報を: 宝のような天文学的データが明らかになる包括的なパネルをご覧ください。惑星の地理的/太陽中心座標、太陽と地球の距離、星の大きさ、伸び、星座、黄道座標および赤道座標、さらには水平座標まで、それぞれが綿密に計算され美しく表示されています。指標によって生成される垂直線は時間値に対応し、トレーディングの旅に宇宙の視点を提供します。 惑星のラインと関係: グラフを飾る惑星のラインの魔法を体験し、スケールと角度をカスタマイズできます。直感的なコントロールパネルを介して各惑星のラインの表示を簡単に切り替えることができます。指定された時刻範囲内での合会、六分会、四分会、三分会、対会、逆行の指標で天体の関係の芸術を発見してく
収益性の高い取引機会を簡単に特定するのに役立つ強力な外国為替取引インジケーターをお探しですか?ビースト スーパー シグナル以外に探す必要はありません。 この使いやすいトレンドベースのインジケーターは、市場の状況を継続的に監視し、新しいトレンドを検索したり、既存のトレンドに飛びついたりします。ビースト スーパー シグナルは、すべての内部戦略が一致し、互いに 100% 合流したときに売買シグナルを発するため、追加の確認は不要です。シグナル矢印アラートを受け取ったら、単に売買します。 購入後、プライベート VIP グループに追加されるようにメッセージを送ってください! (完全な製品購入のみ)。 購入後、最新の最適化されたセット ファイルについてメッセージを送ってください。 MT5バージョンは こちらから入手できます。 Beast Super Signal EA は こちらから 入手できます。 コメント セクションをチェックして、最新の結果を確認してください。 ビースト スーパー シグナルは、1:1、1:2、または 1:3 のリスクと報酬の比率に基づいて、エントリ
Volatility Trend System - a trading system that gives signals for entries. The volatility system gives linear and point signals in the direction of the trend, as well as signals to exit it, without redrawing and delays. The trend indicator monitors the direction of the medium-term trend, shows the direction and its change. The signal indicator is based on changes in volatility and shows market entries. The indicator is equipped with several types of alerts. Can be applied to various trading
NAM Order Blocks
NAM TECH GROUP, CORP.
5 (1)
MT4マルチタイムフレームオーダーブロック検出インジケーター。 特徴 -チャートコントロールパネルで完全にカスタマイズ可能で、完全な相互作用を提供します。 -必要な場所でコントロールパネルを表示および非表示にします。 -複数の時間枠でOBを検出します。 -表示するOBの数量を選択します。 -さまざまなOBユーザーインターフェイス。 -OBのさまざまなフィルター。 -OB近接アラート。 -ADRの高線と低線。 -通知サービス(画面アラート|プッシュ通知)。 概要 注文ブロックは、金融機関や銀行からの注文収集を示す市場行動です。著名な金融機関と中央銀行が外国為替市場を牽引しています。したがって、トレーダーは市場で何をしているのかを知る必要があります。市場が注文ブロックを構築するとき、それは投資決定のほとんどが行われる範囲のように動きます。 注文の構築が完了すると、市場は上向きと下向きの両方に向かって急激に動きます。注文ブロック取引戦略の重要な用語は、機関投資家が行っていることを含むことです。それらは主要な価格ドライバーであるため、機関投
トレンドトレーディング は、タイミングのプルバックとブレイクアウトにより、市場で起こっているトレンドから可能な限り利益を得るように設計された指標です。確立されたトレンドの中で価格が何をしているかを分析することにより、取引の機会を見つけます。 [ インストールガイド | 更新ガイド | トラブルシューティング | よくある質問 | すべての製品 ] 自信を持って効率的に金融市場を取引する むち打ちにならずに確立されたトレンドから利益を得る 収益性の高いプルバック、ブレイクアウト、早期の逆転を認識する この指標は、独自の品質とパフォーマンスを分析します 複数時間枠のダッシュボードを実装します インジケーターは再描画されていません 電子メール/音声/視覚アラートを実装します 確立されたトレンドは多くの取引機会を提供しますが、ほとんどのトレンド指標はそれらを完全に無視しています。インジケーターの解釈はかなり簡単です: (1) トレンドの変化 (2) トレンドの方向への後退 (3) トレンドの方向へのブレイクアウト 赤いダッシュ は下降トレンド中の修正です 青いダッシュ は上昇ト
The Volume by Price Indicator for MetaTrader 4 features Volume Profile and Market Profile TPO (Time Price Opportunity). Volume and TPO histogram bar and line charts. Volume Footprint charts. TPO letter and block marker collapsed and split structure charts. Session filtering and grouping. Static, dynamic and flexible range segmentation and compositing methods with relative and absolute visualizations. Graphical layering, positioning and styling options to suit the user's analytic and aesthetic n
Cycle Sniper
Elmira Memish
4.39 (36)
NEW YEAR SALE PRICE FOR LIMITED TIME!!! Please contact us after your purchase and we will send you the complimentary indicators to complete the system Cycle Sniper is not a holy grail but when you use it in a system which is explained in the videos, you will feel the difference. If you are not willing to focus on the charts designed with Cycle Sniper and other free tools we provide, we recommend not buying this indicator. We recommend watching the videos about the indiactor and system before pu
How to use Pair Trading Station Pair Trading Station is recommended for H1 time frame and you can use it for any currency pairs. To generate buy and sell signal, follow few steps below to apply Pair Trading Station to your MetaTrader terminal. When you load Pair Trading Station on your chart, Pair Trading station will assess available historical data in your MetaTrader platforms for each currency pair. On your chart, the amount of historical data available will be displayed for each currency pai
The indicator " ZigZag on Trend " is an assistant in determining the direction of price movement, as well as a calculator of bars and points. It consists of a trend indicator, which follows the price direction by the trend line presented in the form of a zigzag and a counter calculating the number of bars traversed in the direction of the trend and the number of points on the vertical scale. (calculations are carried out by the opening of the bar) The indicator does not redraw. For convenience,
Step into the realm of Forex trading with confidence and precision using XQ, a cutting-edge Forex indicator designed to elevate your trading game to unprecedented heights. Whether you're a seasoned trader or just stepping into the world of currency exchange,   XQ Forex Indicator   empowers you with the insights and signals needed to make informed trading decisions. The signal conditions are a combination of three indicators, and XQ Forex Indicator only display  medium and long-term trends . The
Full Forex Market View Dashboard
Opengates Success International
5 (2)
FULL FOREX MARKET VIEWダッシュボードインジケーター これは、トレーダーが市場で何が起こっているかを完全に把握できるようにするために作成されたカスタム指標です。 リアルタイム データを使用して市場にアクセスし、取引を成功させるために必要なあらゆる情報を表示します。 インストール: このインジケーターをウィンドウ チャートに添付する前に、MT4 のマーケット ウォッチ パネルに移動し、不要な通貨ペアまたは取引しないすべての通貨ペアを非表示にして、残りをそこに残します。 その理由は、FFMV ダッシュボードが MT4 の気配値表示に表示されるすべての通貨ペアを表示するためです。 最大 30 通貨ペア以下を表示できます。 MT4 の気配値表示でそれ以上だと、FFMV ダッシュボードのフォントと画像がぼやけて変形します。 正しく表示されません。 使用法:      個人取引の場合      バスケット取引の場合 (方法についてはスクリーンショットを参照してください)      複数注文取引にも使用可能      独自の取引システムなどから
Cyclical indicator for trading and predicting the direction of the market. Shows the cyclical behavior of the price in the form of an oscillator. Gives signals for opening deals when rebounding from the upper and lower boundaries of the oscillator. In the form of a histogram, it shows the smoothed strength of the trend. Will complement any trading strategy, from scalping to intraday. The indicator does not redraw. Suitable for use on all symbols/instruments. Suitable time frames for short-term
回帰取引を意味する専門的かつ定量的なアプローチを実装する独自の指標。これは、価格が予測可能かつ測定可能な方法で迂回して平均に戻るという事実を利用しており、非定量的な取引戦略を大幅に上回る明確な出入りルールを可能にします。 [ Installation Guide | Update Guide | Troubleshooting | FAQ | All Products ] 明確な取引シグナル 驚くほど簡単に取引できます カスタマイズ可能な色とサイズ パフォーマンス統計を実装します ほとんどの取引戦略を上回ります 適切なSLおよびTPレベルを表示します 電子メール/音声/視覚アラートを実装します 使い方 インディケータは、より高い時間枠からの完全にカスタマイズ可能な移動平均の周りの標準偏差を測定し、トレンドフォローアプローチを使用して正確に取引を見つけます。取引は、現在のチャートの価格アクションに飛び込むことによって見つけられ、価格が選択したより高い時間枠から計算された平均価格帯に戻ったときに閉じられます。それがコード化される方法のために、指標は高ボラティリティと強いトレンドの
Indicatorul MOTANO Bună ziua! 24 de ore - REDUCERE PREȚ! Profita! Tocmai am terminat indicatorul MOTANO după multă muncă. Este un indicator de săgeată. Merge perfect pe M15, aproape orice pereche. Săgețile indică intrările de cumpărare și vânzare, iar o țintă de profit de 5,10 sâmburi asigură un profit sigur. Un profit și mai mare poate fi stabilit, în funcție de situație. Dar cuvintele sunt de prisos. Testați-l și trageți propriile concluzii. Notă Este posibil ca acești ind
驚異的なFXインジケーター「Miraculous」をご紹介します。完璧な結果を得るための1時間足を含むすべてのタイムフレームで効果的に機能する、最強の強力な特殊MT4フォレックスインジケーターです。 すべてのタイムフレームで優れた結果を提供する最高のFXインジケーターを探し続けるのに疲れましたか?これ以上探す必要はありません!「Miraculous」フォレックスインジケーターをご紹介します。このインジケーターは、トレーディングの経験を変革し、収益を新たなレベルに引き上げるために設計されました。 先進のテクノロジーと長年にわたる緻密な開発に基づいて構築された「Miraculous」フォレックスインジケーターは、FX市場における力と正確さの頂点となります。この素晴らしいツールは、すべてのレベルのトレーダーのニーズを満たすように設計されており、一貫した収益性を追求する上で比類のない優位性を提供します。 「Miraculous」フォレックスインジケーターの他との違いは、その非常に適応性にあります。デイトレーダー、スウィングトレーダーであろうと、長期ポジションを好む方であろうと、このインジケータ
3 Indicators in 1 indicator Strategy based on price action Made specifically for the best forex currency pairs Can be used in the best time frame of the market at a very reasonable price This indicator is basically 3 different indicatos . But we have combined these 3 indicators in 1 indicator so that you can use 3 indicators at the lowest price. All three strategies are based on price action. But based on different trends. Long term, medium term and short term Attributes : No repaintin
現在20%OFF! このダッシュボードは、複数のシンボルと最大9つのタイムフレームで動作するソフトウェアの非常に強力な部分です。 このソフトは、弊社のメインインジケーター(ベストレビュー:Advanced Supply Demand)をベースにしています。    Advanced Supply Demand ダッシュボードは、素晴らしい概要を提供します。それは示しています。  ゾーン強度評価を含むフィルタリングされた需給値。 ゾーン内/ゾーンへのPips距離。 ネストされたゾーンがハイライトされます。 選択されたシンボルの4種類のアラートを全ての(9)時間枠で提供します。 それはあなたの個人的なニーズに合わせて高度に設定可能です。 あなたの利益! すべてのトレーダーにとって最も重要な質問です。 市場に参入するのに最適なレベルはどこか? 成功のチャンスとリスク/リターンを得るために、強力な供給/需要ゾーン内またはその近くで取引を開始します。 損切りの最適な位置はどこですか? 最も安全なのは、強力な供給/需要ゾーンの下/上にストップを置くことで
Currently Price 20% OFF ( for unlimited use )   BONUS  AUX VIP Club 2024 : Include  EA Airbag  and  Load Data History  to enhance the performance of this tool to its maximum potential  Click Here to Download Files   ( for users only )   Hello World! Introducing.. SMCpro VIP tool and Indicator for MetaTrader 4, designed to revolutionize your trading experience with the ICT Smart Money Concept. This system is meticulously crafted to empower traders with advanced insights and precision in
作者のその他のプロダクト
Introducing the trend indicator! Ready trading system. The principle of the indicator is to automatically determine the current state of the market when placed on a chart. The indicator analyzes market dynamics for pivot points. Shows the favorable moments of entering the market with stripes. Can be used as a channel indicator or level indicator! This indicator allows you to analyze historical data, and on their basis display instructions to the trader on further actions. To find out how to dete
The indicator monitors the market trend with very high reliability. Sharp price fluctuations, as well as noise around averaged prices, are ignored. All intersection points will be ideal points at which the direction of the trend changes. Signal points, places where color changes, can be used as points of potential market reversal. This development can be used both for long-term trading, and for piping on small periods. The indiuctor algorithm implements a kind of technical analysis based on the
This indicator will provide you with everything you need in order to overcome losses due to human emotions. The indicator determines the moments of a trend reversal and the direction of its movements. This development is equipped with the most modern, adaptable trading algorithms. The main secret of short-term trading is to have information on when to enter a deal. The indicator works great on all timeframes and informs the trader about the most successful moments of buying or selling a currency
It can be used as an independent trading system. It is based on the idea that some currency pairs follow one another. The indicator allows you to simultaneously display several other charts on the chart of one currency pair, which allows you to anticipate some movements and fairly accurately determine the beginning of trends. The principle of trading according to indicator signals is also simple: you need to sell a currency pair whose chart is higher, and buy the lower one.
This indicator gives signals about a trend change, shows successful signals. High probability of a successful trend, it can be used with an optimal risk to profit ratio. The indicator does not redraw and is not late; it can be used both for piping on small periods and for long-term trading. The indicator algorithm works using open prices, and you can work with a zero bar. It works on all currency pairs and on all timeframes.
This indicator will provide you with everything you need in order to overcome losses due to human emotions. The indicator determines the moments of a trend reversal and the direction of its movements. This development is equipped with the most modern, adaptable trading algorithms. The main secret of short-term trading is to have information on when to enter a deal. The indicator works great on all timeframes and informs the trader about the most successful moments of buying or selling a currency
The indicator ignores sharp fluctuations and market noise and tracks market trends with absolute reliability. It is suitable for trading on small timeframes and on large ones, it ignores sudden price spikes or price movement corrections due to the reduction of market noise around the average price value. For calculations, the indicator uses indicators: iLow, iHigh, iMA, iATR. Since the output signal relies on reliable indicators, it is also reliable. You can configure both a sound signal and se
Turbo Pro - Advisor uses a number of indicators to search for signals for entry. It works in fully automatic mode! Use default settings. Unlike alternative developments, this bot can simultaneously trade on both buy and sell. This is a significant advantage in real work because it makes it possible to achieve significantly better results due to increased capitalization. The bot works like a scalpel with sharp price movements, or uses series closures by averaging the overall position. Turbo Pro
This is a convenient tool if you are used to trading on a clean chart, but sometimes you need to look at this indicator. If you are not sure how to determine the inflection point of a trend and are concerned about how to draw trend lines, then this indicator is for you. From now on, you do not need to sit near the computer and analyze the price, use this indicator carefully.
This is a hybrid trend indicator, as it is based on the signals of elementary indicators and a special algorithm for analysis. The smart algorithm of the indicator determines the trend, filters out market noise and generates input signals. The indicator uses a color alarm: blue - when changing from descending to ascending, and red - on the contrary, to descending. You can use the indicator as the main indicator for determining the trend. The indicator can work both for entry points and as a filt
Special Volume - Volume indicator, in the Forex market volumes are peculiar (teak). Why is Forex not possible to track normal volumes? The fact is that it is an OTC market. Therefore, it is practically not realistic to calculate the volume of purchases and sales by one instrument. Many Forex traders completely abandon volume indicators in their work. But for those who want to use them, there are some interesting tools, and one of them is Special Volume. The Special Volume indicator shows the ave
Direction Trend indicator. Shows the direction of the current trend. Colors bars in red and blue. It works on all currency pairs and on all timeframes. Do not forget that the approach should be comprehensive, indicator signals require additional information to enter the market. The principle of the indicator is that when placed on a chart, it automatically determines the current state of the market, analyzes historical data, based on historical data.
This indicator is a professional indicator for Forex trading. Shows points for entering the market, points of potential market reversal. Uses one parameter for settings. Ready trading system. The indicator combines several progressive algorithms. Combined systems for analyzing historical data are projected onto lines in the form of straight lines connecting extremes. That is the pivot point of the market. These extremes or pivot points of the market can be used as line levels! Which is very conv
A trend indicator, and not the first view, is a regular indicator, but it can be used with an optimal risk coefficient. The principle of work is simple - the indicator shows the moments for entering the market with arrows, which is very easily perceived visually. It is recommended to use an oscillator with an additional indicator, for example, standard RSI. You need to respond to level 50. Or use some other confirmation system. The indicator can be used both for piping for small periods and
Turbo Fix - the adviser uses a number of indicators to search for signals to enter. It works in fully automatic mode! Use default settings. Unlike alternative developments, this bot can simultaneously trade on both buy and sell. This is a significant advantage in real work because it makes it possible to achieve significantly better results due to increased capitalization. The bot works like a scalpel with sharp price movements, or uses series closures by averaging the overall position. Turbo F
The indicator shows the direction of the trend, signaling this using pivot points. It can be used with an optimal risk ratio. The arrows indicate favorable moments and directions for entering the market. Uses one parameter to adjust (adjust from 1 to 3). It works on all currency pairs and on all timeframes. The indicator can be used both for piping for small periods and for long-term trading. It works on all currency pairs and on all timeframes. When using, it is recommended to look at an add
HighScalpel
Ivan Simonika
5 (1)
Introducing the HighScalpel scalping system. It is enough to optimize once, for example, per month. After that, he shows excellent results on the forward period (several times larger), which can be seen in the screenshots. Be attentive to the spread indicators of your broker! The higher the spread, the less often the market entries. If the spread is above 20 pips, then the number of inputs falls by two orders of magnitude. It is ideal to use a broker with a floating spread of 6 pips. Such b
The Revers Line signals a change in the angle of the moving average, the LevelZero parameter sets the circle of the zero point, there are limits from -LevelZero to LevelZero including those that will be considered a zero point, this can be indicated in red on histograms.   Options:   LevelZero - zero point [-LevelZero, LevelZero];   Length - length of the moving average;   Start - the starting point for calculating the angle;   End - the end point for calculating the angle;   MetodMA - averagin
We present to you a fully automated Expert Advisor designed for trading major currency pairs. The bot uses a set of its own trading algorithms and has protection against crashes. Attention! The bot only works correctly when the spread is less than 6 pips! I ask you to weigh this fact, and if you do not have the appropriate conditions for trading, this bot will not work for you! The robot controls the volume of trading positions, slippage, spread, maintains and protects open orders, can work wit
A new trend determination algorithm has been developed for this indicator. The algorithm with acceptable accuracy generates input signals and output levels. Strategy for trend trading, filtering and all the necessary functions built into one tool! The principle of the indicator’s operation is to automatically determine the current state of the market when placing it on a chart, analyze historical data based on historical data and display instructions for further actions on the screen to the trad
This development is a scalping system. The bot shows excellent results, which can be seen in the screenshots. You can shamelessly start the protest and bot with such a rite, self-confidently chucking in yogo abilities. The bot can be tested on high currency pairs and high periods. In order to install the test tester so it is indicated on the screenshots, for correct test. You need to trade on timeframes M1-M15. An expert created to trade on any instrument. It is preferable to test the adviser w
Traders can use the Trends Histogram indicator to identify potential areas of profit taking in the next section of an uptrend or downtrend. So it is for direct entry into the market. The indicator is used in the same way as any of these indicators individually or in combination with other indicators. This indicator shows an uptrend and a downtrend (green histogram). Only one input parameter is available: Length. It affects the scale of indicator price coverage. Installed input parameters ca
This development is a scalping system. The Forex Go bot shows excellent results, which can be seen in the screenshots. You can shamelessly start the protest and the bot with such a rite, self-confidently churning in your abilities. The bot can be tested on high currency pairs and high periods. In order to install the test tester so it is indicated on the screenshots, for correct test. You need to trade on timeframes M1-M15. Expert Advisor is designed to trade on any instrument. It is preferable
The work of the Stable Pulse bot is displayed in the form of several key mmoments, which can be seen in the screenshots. This development is a scalping system. You can download and test the bot for free this way by yourself making sure of its capabilities. The bot can be tested on different currency pairs and different periods. The main thing is to set the tester settings as shown in the screenshot, for correct testing. You need to trade on timeframes M1-M15. Expert Advisor is designed to trade
Universal scalper with averaged algorithm to exit the drawdown. The Protected Article advisor uses an author's scalping strategy. More than a year of work on a demo and on real accounts. The adviser will be a good assistant when scalping, trading on the news, as well as when opening many transactions on different currency pairs. It must be run on the chart of each pair that you want to trade. The parameters of the adviser are clear and easy to configure. Advisor Goal Scalping results in small
The Trend Agil e indicator tracks the market trend with very high reliability. Sharp price fluctuations, as well as noise around averaged prices, are ignored. All intersection points will be ideal points at which the direction of the trend changes. Signal points, places where color changes, can be used as points of potential market reversal. This development can be used both for long-term trading, and for piping on small periods. The indiuctor algorithm implements a variety of technical analysis
Balanced Bot - the adviser uses a number of indicators to search for signals for entry. It works in fully automatic mode! Use default settings. Unlike alternative developments, this bot can simultaneously trade on both buy and sell. This is a significant advantage in real work because it makes it possible to achieve significantly better results due to increased capitalization. The bot works like a scalpel with sharp price movements, or uses series closures by averaging the overall position. Tur
This indicator gives signals about a trend change, shows successful signals. High probability of a successful trend, it can be used with an optimal risk to profit ratio. The indicator does not redraw and does not lag, it can be used both for pipsing in small periods and for long-term trading. The indicator algorithm works using open prices, and you can work with a zero bar. It works on all currency pairs and on all timeframes.
Introducing the trend indicator! Ready trading system. The principle of the indicator is to automatically determine the current state of the market when placed on a chart. The indicator analyzes market dynamics for pivot points. Shows the favorable moments of entering the market in stripes. It can be used as a channel indicator or level indicator! This indicator allows you to analyze historical data, and on their basis display instructions to the trader on further actions. To find out how to det
Analyst Bot - the adviser uses many moving average indicators to search for signals to enter. Works in fully automatic mode! You do not need any settings, you can use the default settings. The bot passes the historical gap for the 19-year period from 2000 to 2019. Unlike alternative developments, this bot can simultaneously trade both on buy and on sell. That is, it has two independent systems of analysis. This is a significant advantage in real life because it gives the opportunity to achieve
フィルタ:
レビューなし
レビューに返信