Buy Sell Areas with Smart Candles
- インディケータ
- Mohamed yehia Osman
- バージョン: 1.5
- アップデート済み: 2 9月 2021
- アクティベーション: 5
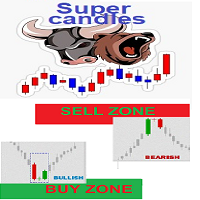
Simple indicator for possible BUY / Sell Zones based on smart volumes indicator
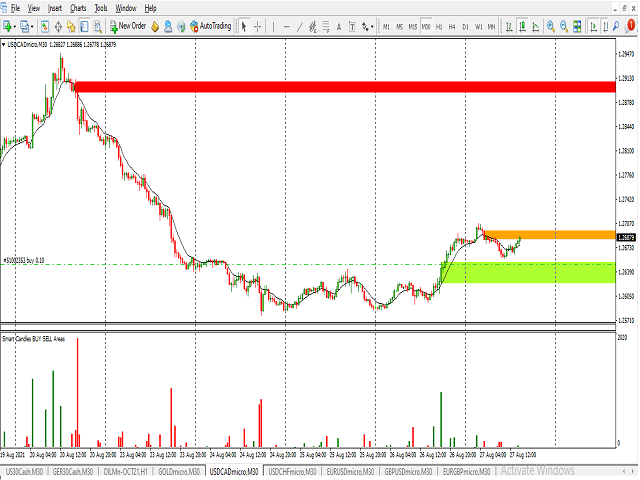
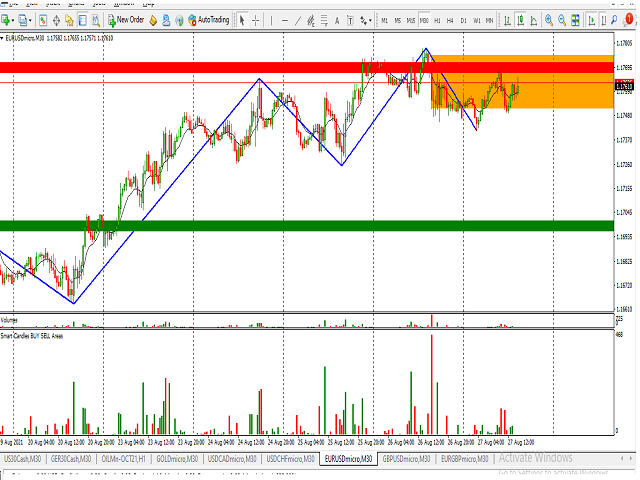
two levels of buy/Sell Zones : Main BUY/SELL area and current BUY/SELL area and medium range BUY SELL Levels
SELL Levels in Red
BUY levels in Green
Sell levels(RED) are transformed to buy levels (GREEN) when price is crosses above
BUY levels(GREEN) are transformed to SELL levels (RED) when price is crossed Below
your strategy can vary :
1- you can Buy when price is above a green BUY area
2- you can Buy by approaching upper/lower limit of a Buy area
3- you can Sell when price is below a red SELL area
4- you can Sell by approaching upper/lower limit of a Sell area
the power of buy area /sell area can be identified by the wideness of area
:::BUY Zones (GREEN)
:::SELL Zones (RED)
::::: Other color (violet / blue ) When two Buy and Sell Zones overlap -> this is no decision area -> you can wait until price cross the Buy area up or the Sell area down
inputs :
1- frequency of smart candles detection (high-very low) depends on how much smart candles you would like to detect
2-session hours for indicator to work : start + end hour according to you LCT
3- enable/disable the second Big buy/sell areas levels
