Wick Fill Trend MT5
- インディケータ
- Javier Morales Fernandez
- バージョン: 1.0
- アクティベーション: 5
-ウィックフィルトレンドの考え方
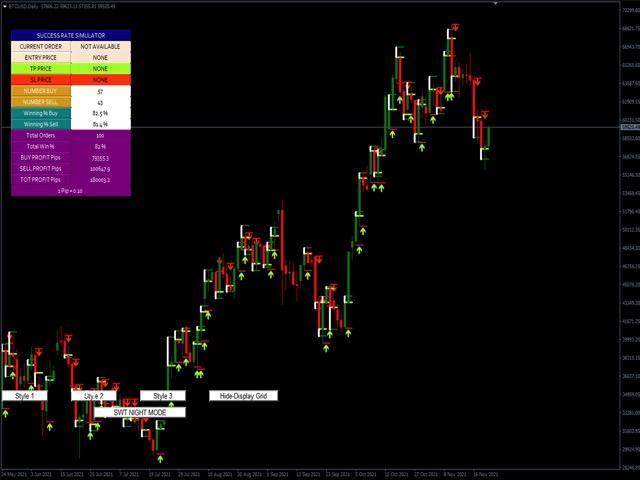
市場のボラティリティが高い時、ローソク足はその移動の途中で芯を作る傾向があります。ローソク足の芯は、価格の反発を反映しています。これらのウィックは、その方向に押す巨大なボリュームを持っているので、時間の大半は満たされています。Wick Fill Trendは、トレンド相場に焦点を当て、そのチャンスをスキャンします。
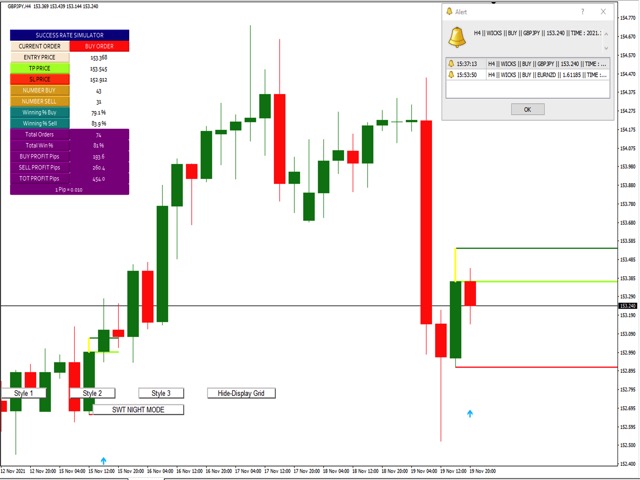
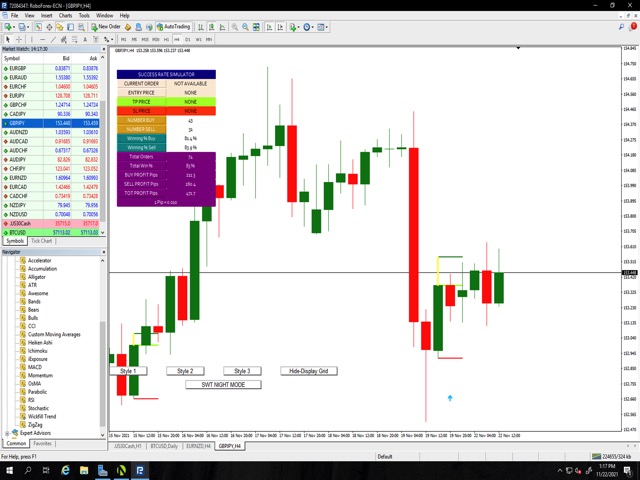
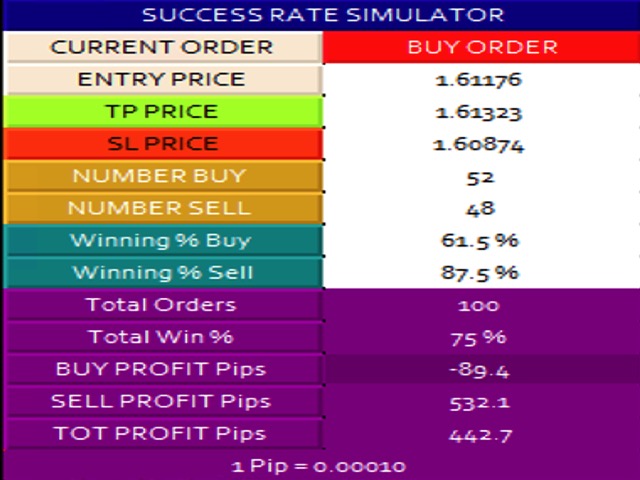
エントリーポイント、利益確定、損切りなどのライブシグナルを表示する成功率シミュレーターダッシュボードを備えています。この成功率シミュレーターはバックテストとして使用することができ、過去にどのインプットがより良い利益を上げたかを確認することができます。この成功率シミュレーターは、バックテストとして使用することができ、過去にどの入力がより良い利益を上げたかを確認することができます。
-インプット
-トレンドウィック。この入力は、インディケータがスキャンしなければならないウィックの大きさを決定します。この値は%で測定されます。デフォルトでは20%です。
-シグナル数 シグナル数:成功率シミュレーターでスキャンするシグナルの数を指定します。
-移動平均 このフィルターは、移動平均とRSIを組み合わせたものです。RSIと移動平均はユーザーが自由に設定することができます。
-前のバーの方向。この機能は、直前のローソク足に基づいてシグナルを回避または許可します。この機能が有効な場合、直前のローソク足がトレンドと同じ方向にある場合のみ、ウィックをシグナルとして考慮します。偽の場合は、すべてのウィックを考慮します。
-直近の高値・安値:レンジ相場を回避するために、直近の高値・安値をスキャンする機能です。
-最小ローソク足サイズ。最小ローソク足の大きさ: スキャンの対象となる最小ローソク足の大きさを指定します。
-最大ローソク足サイズ。最大ローソク足:この入力は、インディケータがウィックをスキャンすることを考慮する最大のバーサイズです。
-ストップロスの比率。デフォルトでは、ストップロスはシグナルローソク足のHHまたはLLとなります。この機能により、ユーザーはウィックシグナルに基づいてストップロスを大きく、または小さく設定することができます。例えば、2:を選択した場合、ローソク足の芯を基準とした2倍の損切りとなります。
-アラート設定:このインジケータは、アラートとプッシュ通知を起動し、モバイルデバイスに送信することができます。まず、このインジケーターからのシグナルをアプリで受信するためには、MetaTraderアプリの設定>チャットとメッセージ>からMetaquotes IDを取得する必要があります。次に、デスクトップ版のTools>Options>NotificationsにMetaquotes IDを挿入してください。 すると、ライブシグナルの通知を受け取ることができます。
MetaTrader4はこちらからお試しください: https://www.mql5.com/en/market/product/71085
**************************ATTENTION*******************
このインジケータは、M1タイムフレームを使用して、成功率シミュレータのための最も正確な結果を持つようにデータを収集します。一部のブローカーは、最高のデータを持っていないか、それが不完全であるため、結果は過去から別のスキャンの信号に1つのブローカーから異なる場合があります。通常、メタトレーダー5は自動的にデータをダウンロードします。しかし、インジケータを使用する前に、1MNから1Mまでのすべてのタイムフレームを開き、データを取りこぼさないようにすることをお勧めします。
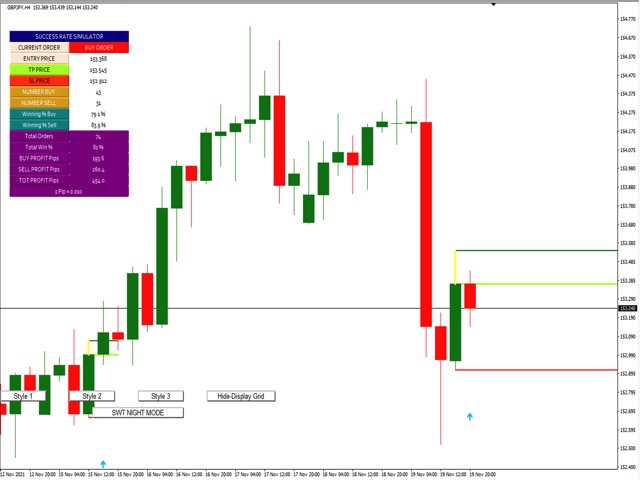
スタイルが重要だから
私は、ローソクの色、明るいまたは暗いへの背景を変更し、グリッドを配置または削除するたびにプロパティをクリックすることで、どのように迷惑であることを認識しています。ここで、私が製品の大部分に含まれているワンクリックで解決策があります。
- トレーダーが望むキャンドルのスタイルを選択するための3つのカスタマイズ可能なボタン。
- 昼と夜のモードを切り替えるには、1つのボタン。
- チャート上のグリッドを表示または非表示にするには、1つのボタン。
*****設定で、あなたはボタンの色や画面上に表示されるようにする場所を選択することができます*****。
私の他の製品をチェックすることを検討してください https://www.mql5.com/en/users/javimorales.fer/seller
著者
ハビエル・モラレス、Algorithms for Tradingの創設者。