Bollinger Bands Max
- インディケータ
- John Louis Fernando Diamante
- バージョン: 1.6
- アップデート済み: 15 2月 2022
- アクティベーション: 5
A fully featured BB indicator
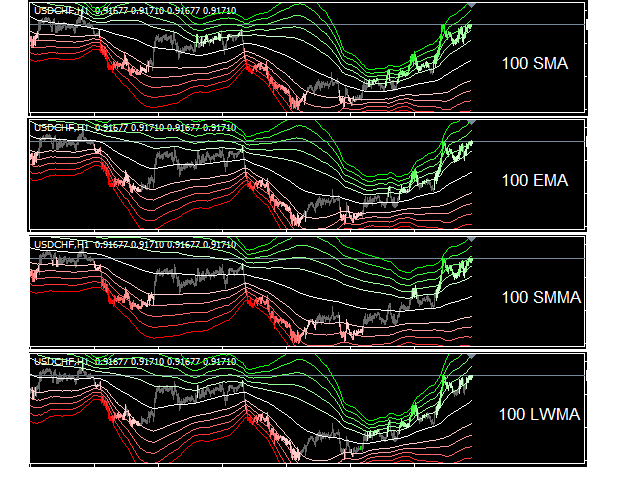
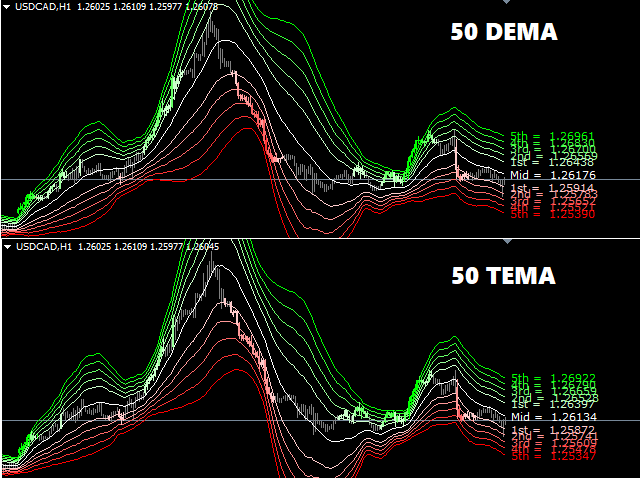
You're no longer limited to the built in default of using BB off a SMA method, now you can choose from SMA - EMA - SMMA - LWMA - DEMA - TEMA.
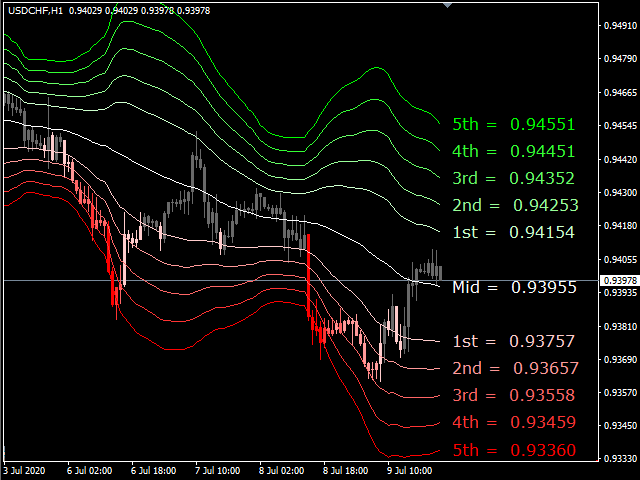
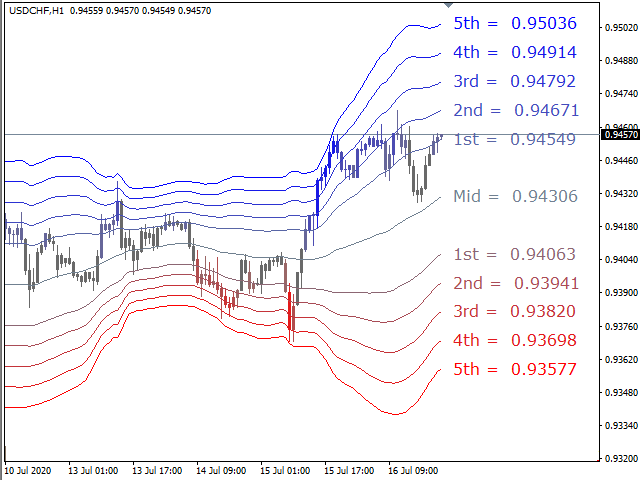
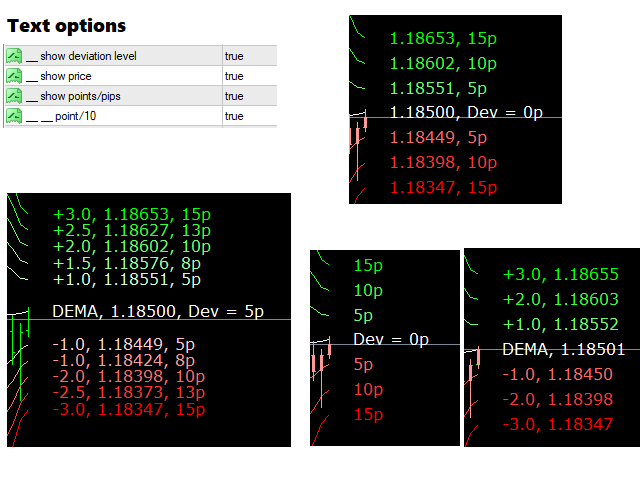
You now also have up to 5 standard deviation levels, with price labels, and deviation-colored candles are provided.
Options:
- MTF
- moving average type SMA - EMA - SMMA - LWMA - DEMA - TEMA
- 5 adjustable deviation levels
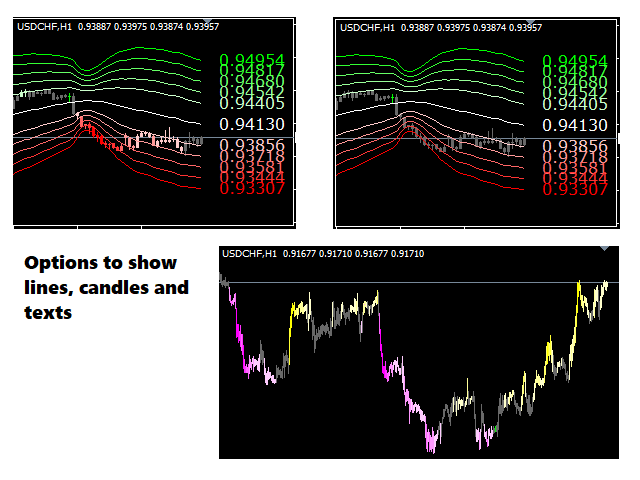
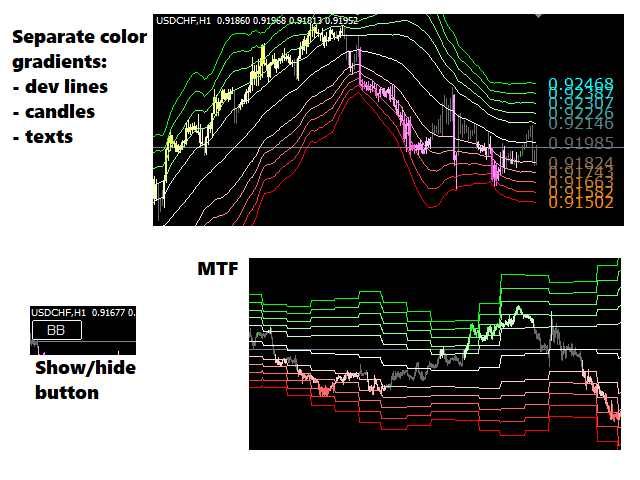
- color gradients to BB lines, candles, and texts
- show-hide button to declutter the chart
- full alert options, live/completed, dev line choice
- texts for deviation level, price and pip distance to midline
Troubleshooting:
- If there are any issues or suggestions for the indicator, please comment and let me know. The feedback will be noted and considered in future updates.

I like it! Thanks Author! 5 stars!