• 概要
  • レビュー
  • コメント

TrendOrFlatIndicator

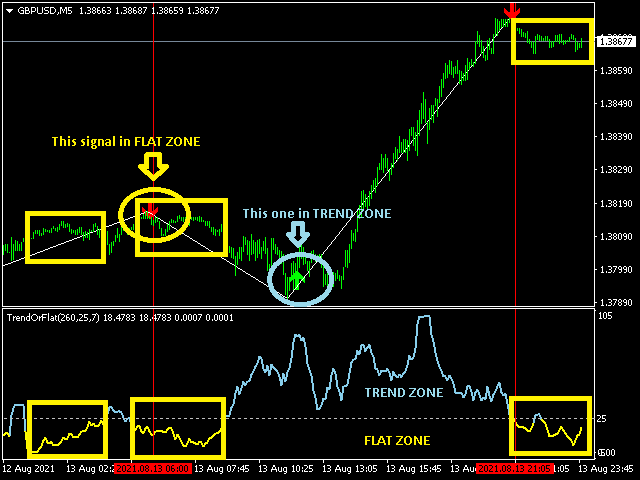
This indicator analyzes the ranges in the selected LookBack Bars and shows the relative strength of the price movement with the Level percentage you set. The blue line indicates that the current price movement is strong, and the yellow line indicates that we are in a flat price movement. The blue line does not determine whether the price action is up or down, it just shows relative strength. Therefore, as seen in the picture, direction can be determined with a simple zigzag indicator on the main chart (or with any arrow indicator).
おすすめのプロダクト
Taurus All4 Taurus All4 is a high-performance indicator, it will tell you the strength of the trend, and you will be able to observe the strength of the candle. Our indicator has more than 4 trend confirmations. It is very simple and easy to use. Confirmation Modes Candle Trend Confirmations: When the candle switches to light green the trend is high. When the candle switches to light red the trend is reverting down. When the candle changes to dark red the trend is low. Trendline Trend Conf
This indicator displays Stochastic osc signals on the price chart and allows the user to receive notifications of such signals. The Stochastic indicator is a classic and proven indicator of the technical analysis of the markets. Despite its age, it is still relevant today. Depending on the settings, the indicator allows you to work effectively on various TFs and any markets. Signals are given on fully formed bars and are not redrawn. Custom Parameters: Stochastic_Price (0-1) - The applied pric
The King of Forex Trend Cloud Indicator is a trend following indicator based on moving averages. The Indicator is meant to Capture both the beginning and the end of a trend. This indicator can be used to predict both short and long terms market trends.  The king of Forex Trend Cloud if paired together with the King of Forex Trend Indicator can give a broad picture in market analysis and forecasts. I have attached images for both the  The king of Forex Trend Cloud on its own and  The king of Fore
Visually, Capernaum, on the chart, appears as small arrows indicating the direction of the trend movement and the opening of trading positions. The appearance of a blue up arrow indicates that the market is beginning to rise and it is time to buy. And the appearance of a red down arrow means that the market is falling and it is high time to sell. When a suitable moment for buying appears, the indicator generates a signal exactly at the moment of its appearance and not below or above the current
The Search for Reversal trend indicator can be used both for pipsing on small periods and for long-term trading. Indicator showing signals for entry. Displays both entry points and the trend itself. Shows statistically calculated times to enter the market with arrows. Using the indicator, you can optimally distribute the risk coefficient. Uses all one parameter for settings. When choosing a parameter, it is necessary to visually resemble so that the corresponding graph has an excellent projec
[ZhiBiCCI]インディケータは全てのサイクル使用に適しており、そして全ての市場品種にも適しています。 [ZhiBiCCI]緑色の実線は強気の発散の逆転です。緑色の点線は古典的な強気の発散です。 [ZhiBiCCI]赤への実線は逆弱気の発散である。赤い点線は古典的な弱気の発散です。 [ZhiBiCCI]はパラメータ(アラート、メール送信、通知送信)で設定でき、(true)に設定するとインスタント信号をアラームウィンドウに送信し、Eメール、インスタントメッセージを送信できます。 パラメータ設定の説明 [displayAlert]:これはアラームスイッチで、trueに設定され、矢印が表示されればプロンプトに自動的に警告され、falseに設定されれば警告されません。 [sendmail_NO_OFF]:これはメールを送信するためのスイッチで、trueに設定します。矢印が表示されていればMT4で設定したメールボックスにメールを送信し、falseに設定されていればメールを送信しません。 [sendnotification_NO_OFF]:これはインスタントメッセー
SystemBinaryM1 - a professional indicator for trading short-term binary options, is a complete, self-contained author's strategy for working in the binary options market. The unique algorithm for analyzing the foreign exchange market is based on the calculation of reference points on three different time periods M15, M5. M1. Thus, the indicator simultaneously analyzes the long-term, medium-term and short-term price behavior before issuing a signal. The indicator is set in the usual way and work
Indicator for determining the trend. The arrows and lines on the chart show the price reversal and the probable current trend or correction. You should always trade in the direction of the arrow. It is best to use the indicator on several time frames at once and enter the market when all time frames have the same arrow. For example, we open a sell trade if there is a red arrow on the M5, M30 and H4 timeframes. Or we open a buy deal if the indicator shows a blue arrow on all timeframes. Advant
PipFinite Trend PRO
Karlo Wilson Vendiola
4.89 (2359)
Breakthrough Solution For Trend Trading And Filtering With All Important Features Built Inside One Tool! Trend PRO's smart algorithm detects the trend, filters out market noise and gives entry signals with exit levels. The new features with enhanced rules for statistical calculation improved the overall performance of this indicator. Important Information Revealed Maximize the potential of Trend Pro, please visit www.mql5.com/en/blogs/post/713938 The Powerful Expert Advisor Version Automa
Nice Stable Arrow   indicator is designed for signal trading. This indicator generates trend signals. It uses many algorithms and indicators to generate this signal. It tries to generate a signal from the points with the highest trend potential. This indicator is a complete trading product. This indicator does not need any additional indicators. The indicator certainly does not repaint. The point at which the signal is given does not change. Signals are sent at the beginning of new candle
Deal Trading SPT
Sukunthakan Ngernbamrung
Deal Trading SPT (Super Trend) is an indicator, shows the market trend direction, entry position, take profit level, stop loss level and trend strength. Utility Help to further filter and develop strategy to trade Market overview on the chart Stop loss and take profit calculation with market volatility Resistance and support for trialing stop No repaint after the finished bar Works in any timeframe and financial instrument, including forex, CFD and crypto etc. Message pop-up, notification wi
Binary Options Support Resistance Indicator This indicator is designed for binary options trading and effectively shows retracements from support and resistance levels. Signals appear on the current candle. A red arrow pointing downwards indicates a potential selling opportunity, while a blue arrow pointing upwards suggests buying opportunities. All that needs adjustment is the color of the signal arrows. It is recommended to use it on the M1-M5 timeframes as signals are frequent on these timef
Description Shows Heikin-Ashi candles (often misspelled Heiken-Ashi) on the chart and can alert when candles change color. The alert is useful for both entry and exit. The number of candles of the new color before an alert is raised can be set. The alert can be controlled interactively, directly from the chart. Also includes bonus indicators of current spread and ask/bid prices in large text, color coded as price changes. Usage Heikin-Ashi candles give a much better insight to the underlying tre
The Storm Prices indicator is trendy, arrow family. It is easy to work and understand when the first red arrow appears, you need to buy, when the first blue arrow appears, sell. The indicator is used for scalping and pipsing. The indicator makes calculations based on several technical indicators. Determines the direction of the trend and gives a fairly clear indication of the position. The indicator allows you to determine the opportunities for entering the market for a short time. There is a sw
MYEwo
Ahmet Metin Yilmaz
The MyEwo indicator is a tool that helps you to find the short maturity direction in your chart. Default input values are frequently used values in this indicator. You can find and use your own values according to your own trend detection and pairs you will trade. My advice is to use a moving average in order to understand the long maturity trend on your main graph (200 and higher may be appropriate). The M5 graphics will be simplify Scalping style Trade transactions that you will use . You can
ナイト ゴースト - バイナリ オプションの矢印インジケーター。 これからのあなたの頼もしいアシスタントです! 11 - チャートの再描画なし - すべての通貨ペアで大活躍! -インジケータの精度は最大 90% (特に夜間) ・長時間の設定不要(バイナリーオプションに最適な設定) - 信号が遅れない - 現在のローソク足でのシグナルの出現 ・M1期にピッタリ(No More!) ・目に優しいキャンドルカラー(赤・青) -インストールされたアラート それを扱う: - 青い矢印は信号アップを示します -赤い下向き矢印 M1 以上のインジケーターをチャートに配置しないでください. シグナルの精度が低下します! インジケーターのスクリーンショットとビデオを見る
Renko, Heiken Ashi, Ticks Bar, Range Bar.    Easy switching, easy setup, all in one window.        Place the Custom Chart indicator and view Renko, Heiken Ashi, Tick bar, Range bar charts in real time at real chart.    Position the offline chart window so that the indicator control panel is visible.    Switch the chart mode by click of a button.    Connect to the output chart any indicator, expert advisor without any restrictions.    No, it doesn't work in the tester.    Yes, you can use an
How to use Pair Trading Station Pair Trading Station is recommended for H1 time frame and you can use it for any currency pairs. To generate buy and sell signal, follow few steps below to apply Pair Trading Station to your MetaTrader terminal. When you load Pair Trading Station on your chart, Pair Trading station will assess available historical data in your MetaTrader platforms for each currency pair. On your chart, the amount of historical data available will be displayed for each currency pai
This is a trend indicator without redrawing Developed instead of the binary options strategy (by the color of the Martingale candlestick) Also works well in forex trading When to open trades (binary options) A signal will appear in the place with a candle signaling the current candle It is recommended to open a deal for one candle of the current timeframe M1 and M5 When a blue dot appears, open a deal up When a red dot appears, open a trade down. How to open trades on Forex. When a signal is rec
Signal Undefeated   indicator is designed for trend and signal trading. This indicator generates trend signals.  It uses many algorithms and indicators to generate this signal. It tries to generate a signal from the points with the highest trend potential. This indicator is a complete trading product. This indicator does not need any additional indicators.  You can only trade with this indicator. The generated signals are displayed on the graphical screen.  Thanks to the alert features you can g
I make this indicator to help you for setting effective stoploss and getting more signals from following trends. This indicator helps to tell the trends and sideway, when 2 lines stand above of blue cloud, it means uptrend. When 2 lines stand above red cloud, it means down trend, the other else, it means sideway market. For taking order, you have to wait the arrows. You also need to see the cloud position, if the cloud's res, you have to wait the yellow arrow for selling order. If the cloud's bl
Owl smart levels
Sergey Ermolov
4.34 (35)
MT5版  |   FAQ Owl Smart Levels Indicator   は、 Bill Williams   の高度なフラクタル、市場の正しい波構造を構築する Valable ZigZag、エントリの正確なレベルをマークする Fibonacci レベルなどの一般的な市場分析ツールを含む 1 つのインジケーター内の完全な取引システムです。 利益を得るために市場と場所に。 戦略の詳細な説明 インジケータを操作するための指示 顧問-取引助手 プライベートユーザーチャット ->購入後に私に書いて、私はプライベートチャットにあなたを追加し、あなたはそこにすべてのボーナスをダウンロードすることができます 力はシンプルさにあります! Owl Smart Levels   取引システムは非常に使いやすいので、専門家にも、市場を勉強し始めて自分で取引戦略を選択し始めたばかりの人にも適しています。 戦略と指標に秘密の数式や計算方法が隠されているわけではなく、すべての戦略指標は公開されています。 Owl Smart Levels を使用すると、取引を開始するためのシグナルをすばやく確認し、
Black series MT4 - The indicator is designed for trading on binary options with Timeframe M1-M5-M15 Multicurrency (Works on cryptocurrency and currency pairs) The signal appears when the candle opens Up to 90% correct signals There is no signal redrawing at all Can be used with other indicators. Good for scalping! In Settings there is: -Indicator working methods -I Allert Arrow color Red signal down Blue signal up Also watch the video how the indicator works and signals
The Th3Eng PipFinite indicator is based on a very excellent analysis of the right trend direction with perfect custom algorithms. It show the true direction and the best point to start trading. With StopLoss point and Three Take Profit points. Also it show the right pivot of the price and small points to order to replace the dynamic support and resistance channel, Which surrounds the price. And Finally it draws a very helpful Box on the left side on the chart includes (take profits and Stop loss
Advanced Bollinger Bands Scanner is a multi symbol multi timeframe Bollinger bands dashboard that monitors and analyzes the Bollinger Bands indicator from one chart. This panel monitors the Bollinger bands indicator in up to 28 configurable instruments and 9 timeframes for price overbought/oversold, price consolidation (Bollinger bands squeeze), and consolidation breakout (squeeze break)  with a deep scan feature to scan all market watch symbols (up to 1000 instruments!). Download Demo here  
Indicator captures the trend reversals with no-repaint Buy and Sell Arrow signals. CyberZingFx Trend Reversal Indicator - your go-to solution for accurate and reliable trend reversal signals. With its  advanced trading strategy , the indicator offers you Buy and Sell Arrow signals that do not repaint, making it a reliable tool for catching Swing Highs and Swing Lows in any market and any time frame. Indicator works on  any market  and  any time frames . __________________________________________
MT4 用 Forex インジケーター「ダイナミック売られ過ぎ/買われ過ぎゾーン付き CCI」。 コモディティ チャネル インデックス (CCI) は、トレンド方向へのモメンタム トレーディングに最適です。 ダイナミック買われ過ぎゾーンから売りエントリーを取り、ダイナミック売られ過ぎゾーンからメイン トレンドの方向に買いエントリーを取るのに最適です。 このインジケーターは、プライス アクション エントリーと組み合わせるのにも最適です。 ダイナミック買われ過ぎゾーン - 黄色の線の上 ダイナミック売られ過ぎゾーン - 青い線の下 CCI オシレーターは、現在の価格と過去の平均価格の差を測定します。 // より優れたエキスパート アドバイザーとインジケーターは、こちらで入手できます: https://www.mql5.com/en/users/def1380/seller これは、この MQL5 Web サイトでのみ提供されるオリジナル製品です。
The Arrows Forecasters indicator is simple, visual and effective trend detection. The intelligent algorithm of the indicator determines the trend with a good probability. Uses just one parameter for settings. The indicator shows the points of potential market reversal. Ready-made trading system. The indicator does not redraw and does not lag. Works on all currency pairs and on all timeframes. You should remember that using a combination of forecasting tools, it is advisable to choose 2-3 indi
Alpha Trend
Evgeny Belyaev
3.33 (3)
Alpha Trend is a trend indicator for the MetaTrader 4 platform; it has been developed by a group of professional traders. The Alpha Trend indicator finds the most probable tendency reversal points, which allows making trades at the very beginning of a trend. This indicator features notifications, which are generated whenever a new signal appears (alert, email, push-notification). This allows you to open a position in a timely manner. Alpha Trend does not redraw, which makes it possible to evalua
SuperTrend Alerts adds alerts to the widely popular SuperTrend indicator. As the name suggests, SuperTrend is a trending indicator which works best in trendy (not choppy) markets. SuperTrend is extremely popular for intraday and daily trading, and can be used on any timeframe. Place a call when the price closes above the SuperTrend line, and place a put when the price closes below the SuperTrend line. These crossovers are highlighted by non-repainting up/down arrows. Alerts Email, message and
このプロダクトを購入した人は以下も購入しています
Gann Made Easy は、ミスター・ギャンの理論を使用した取引の最良の原則に基づいた、プロフェッショナルで使いやすい外国為替取引システムです。 W・D・ガン。このインジケーターは、ストップロスとテイクプロフィットレベルを含む正確な買いと売りのシグナルを提供します。 PUSH通知を利用して外出先でも取引可能です。 購入後はご連絡ください!私の取引のヒントと素晴らしいボーナスインジケーターを無料で共有します! おそらく、ギャンの取引手法についてはすでに何度も聞いたことがあるでしょう。通常、ギャンの理論は初心者のトレーダーだけでなく、すでにある程度の取引経験がある人にとっても非常に複雑なものです。なぜなら、ギャンの取引手法は理論的にはそれほど簡単に適用できるものではないからです。私はその知識を磨き、最良の原則を私の外国為替インジケーターに組み込むために数年を費やしました。 このインジケーターは非常に簡単に適用できます。必要なのは、それをチャートに添付し、簡単な取引推奨事項に従うだけです。このインジケーターは常に市場分析の仕事を行い、取引の機会を探します。適切なエントリーポイントを検出
最初のパルスレベルを反転 (RFI)     指示する     ロシア     -        utilizar con   el indicador の ESP 推奨事項 -   TPSpro トレンド プロフェッショナル版 -   MT5のバージョン 最も重要なことは、将来においても最も重要なことです。 機能のプリンシパル: ゾーンのほとんどは、ベンダーとコンプラドールによってアクティブ化されます。 状況を直感的に把握できるよう、初期の衝動を修正します。 LOGIC AI: MUESTRA zonas (círculos) parabuscar puntos de entrada cuando se activa una plantilla 視覚的に優れた視覚効果があり、最も重要な機能がすべて揃っていることに注意してください。 優れたニベレス/ゾーンの視覚化 (modo MTF) 世界で最も人気のある場所/ゾーンです。これを使用するのに最適な方法です (   TPSproTREND PRO   )。 アルゴリズム プロフェッショナル セパラド パソ ア パソ パラ オペラ それは
Enigmera
Ivan Stefanov
5 (3)
エニグメラ:市場の中核 https://www.enigmera.com はじめに このインディケータと取引システムは、金融市場に対する驚くべきアプローチです。ENIGMERAは、フラクタルサイクルを使用して、サポートとレジスタンスレベルを正確に計算します。本格的な蓄積局面を示し、方向性と目標を示します。 トレンド中でも調整中でも機能するシステムです。 どのように作動するのか? ENIGMERAは、支持線・抵抗線、目標線、乖離線の3つのラインで構成されています。このシステムは、過去のデータを現在と未来に外挿する典型的な市場指標とは異なり、現在の完全な画像を提供します。支持線上にある場合、それは本当の支持を意味し、抵抗線上にある場合、それは本当の抵抗を意味する。ある水準が破られた場合、それはトレンドの変化を意味する。再描画はしない。 市場は常に進化しているため、ENIGMERAはその評価ツールを適応させ、定期的に戦略を修正しています。  これにより、すべてのシナリオが徹底的に評価されることが保証されます。この市場指標の独自性は、その能力を見れば明らかです。  ENIGM
まず第一に、この取引インジケーターは再描画されず、再描画されず、遅延しないことを強調する価値があります。これにより、手動取引とロボット取引の両方に理想的なものになります。 ユーザーマニュアル:設定、入力、戦略。 アトミックアナリストは、価格の強さとモメンタムを利用して市場でより良いエッジを見つけるためのPA価格アクションインジケーターです。ノイズや誤ったシグナルを除去し、取引ポテンシャルを高めるための高度なフィルターを備えています。複雑なインジケーターの複数のレイヤーを使用して、アトミックアナリストはチャートをスキャンし、複雑な数学的計算をシンプルなシグナルと色に変換します。これにより、どのような初心者トレーダーでも理解して使用し、一貫した取引の決定を行うことができます。 「アトミックアナリスト」は、新規および経験豊富なトレーダー向けにカスタマイズされた包括的な取引ソリューションです。プレミアムインジケーターとトップノッチの機能を1つの取引戦略に組み合わせ、すべてのタイプのトレーダーにとって汎用性のある選択肢にします。 デイリートレーディングとスキャルピング戦略:高
TPSpro TREND PRO は 、市場を自動的に分析し、トレンドとその各変化に関する情報を提供し、再描画せずに取引に参加するためのシグナルを提供するトレンド指標です。 インディケータは各ローソク足を使用し、個別に分析します。さまざまなインパルス(アップまたはダウンインパルス)を指します。通貨、仮想通貨、金属、株、指数の取引への正確なエントリーポイント! バージョンMT5                   インジケーターの完全な説明   インジケーター -   RFI LEVELS と併用することをお勧めします。 主な機能: レンダリングなしで正確な入力信号! シグナルが表示された場合、それは関連性を維持します。これは、シグナルを提供してからそれを変更する可能性があり、入金時の資金の損失につながる可能性があるリドローインジケーターとの重要な違いです。より高い確率と精度で市場に参入できるようになりました。矢印が表示された後、ターゲットに達する (利益確定) か反転シグナルが表示されるまで、ローソク足を色付けする機能もあります。 STOP LOSS / TAKE PROFIT
mql5と Telegramの モーニング・ブリーフィングで、詳細とスクリーンショットを含む毎日のマーケット・アップデートをご覧 ください! FX Power MT4 NGは 、長年の人気を誇る通貨強度計FX Powerの次世代モデルです。 この次世代ストレングスメーターは何を提供するのでしょうか?初代FXパワーの魅力すべて プラス GOLD/XAUの強さ分析 より正確な計算結果 個別に設定可能な分析期間 カスタマイズ可能な計算上限値により、さらに優れたパフォーマンスを実現 もっと見たい人のための特別なマルチインスタンス設定 すべてのチャートでお好みの色を無限に設定可能 数え切れないほどの通知オプションにより、重要なことを見逃すことはありません。 Windows 11とmacOSのスタイルで角を丸くした新しいデザイン 魔法のように動くインジケーターパネル FXパワーの主な機能 すべての主要通貨の強さの完全な履歴 すべての時間枠における通貨の強さの履歴 すべてのブローカーとチャートで同一の計算結果 100%信頼できるリアルタイム計算 -> リペイントなし ドロップダウン・リストから
トレンドカッターは、M1 や M5 などの下位時間枠を含むあらゆる時間枠で使用できるトレンド指標です。このインジケーターは日中取引を好むトレーダーにとって理想的であり、長期取引を好むトレーダーにも役立ちます。このインジケーターは、取引システムの基礎として、またはスタンドアロンの取引ソリューションとして使用できます。 このインジケーターは、PUSH 通知を含むあらゆるタイプのアラートを提供します。 インジケーターの使い方はとても簡単です。信号に従えばいいだけです。また、このインジケーターのすべてのユーザーに、このメソッドをできるだけ効率的に使用するのに役立つ追加のインジケーターも無料で提供します。 取引のヒントと素晴らしいボーナスを入手するには、購入後にご連絡ください。
現在20%OFF! 初心者やエキスパートトレーダーのためのベストソリューション! このダッシュボードソフトウェアは、28の通貨ペアで動作しています。それは私達の主要な指標(高度な通貨の強さ28と高度な通貨インパルス)の2に基づいています。それは全体の外国為替市場の大きい概観を与えます。それは、すべての(9)時間枠で28の外国為替ペアのための高度な通貨の強さの値、通貨の動きの速度と信号を示しています。チャート上で1つのインディケータを使用して市場全体を観察し、トレンドやスキャルピングの機会をピンポイントで見つけることができたら、あなたのトレードがどのように改善されるか想像してみてください。 このインディケータには、強い通貨と弱い通貨の識別、潜在的な取引の識別と確認がより簡単になるような機能が搭載されています。このインディケータは、通貨の強さや弱さが増加しているか減少しているか、また、すべての時間枠でどのように機能しているかをグラフィカルに表示します。 新機能として、現在の市場環境の変化に適応するダイナミックなマーケットフィボナッチレベルが追加され、すでに当社のAdvan
FX Volume
Daniel Stein
4.58 (33)
mql5と Telegramの モーニング・ブリーフィングで、詳細とスクリーンショットを含む毎日のマーケット・アップデートをご覧 ください! FX Volumeは、ブローカーの視点から市場のセンチメントをリアルに洞察する、最初で唯一の出来高インジケーターです。 ブローカーのような機関投資家が外国為替市場でどのようなポジションをとっているか、COTレポートよりもはるかに速く、素晴らしい洞察を提供します。 この情報をチャート上で直接見ることは、あなたの取引にとって真のゲームチェンジャーであり、画期的なソリューションです。 以下のようなユニークなマーケットデータ洞察から利益を得てください。 比率は 、通貨のロングポジションとショートポジションの比率をパーセントで表示します。 比率の変化は 、選択した期間内のロング比率とその変化率を表示します。 Volumes Totalは 、通貨の取引量(ロングとショート)の合計をロット単位で表示します。 Volumes Long :全通貨のロングポジションの取引量を表示します。 Volumes(ショート )は、全通貨のショートポジションの取引量を表示
現在26%オフ 初心者やエキスパートトレーダーに最適なソリューション! このインジケーターは、独自の機能と新しい計算式を取り入れた、ユニークで高品質、かつ手頃な価格のトレーディングツールです。たった1枚のチャートで28の為替ペアの通貨強度を読み取ることができます。新しいトレンドやスキャルピングチャンスの引き金となるポイントを正確に特定することができるので、あなたのトレードがどのように改善されるか想像してみてください。 ユーザーマニュアルはこちら  https://www.mql5.com/en/blogs/post/697384 これが最初の1本、オリジナルだ! 価値のないクローンを買わないでください。 特別な サブウィンドウの矢印で強い通貨の勢いを表示 GAPがあなたのトレードを導く! 基準通貨や気配値が売られすぎ・買われすぎのゾーン(外相フィボナッチレベル)にあるとき、個別チャートのメインウィンドウに警告表示。 通貨がレンジの外側から反落した場合、プルバック/リバーサルのアラート。 クロスパターンの特別なアラート 複数の時間枠を選択可能で、トレンドを素早く
An exclusive indicator that utilizes an innovative algorithm to swiftly and accurately determine the market trend. The indicator automatically calculates opening, closing, and profit levels, providing detailed trading statistics. With these features, you can choose the most appropriate trading instrument for the current market conditions. Additionally, you can easily integrate your own arrow indicators into Scalper Inside Pro to quickly evaluate their statistics and profitability. Scalper Inside
NextCandlePredictor インジケーター NextCandlePredictorは、再描画しない、色が変わらない、動かない、消えない、遅延がないアラート付きのシグナルインジケーターです。あらゆるタイムフレームで次のキャンドルまたはその次のキャンドルの方向を識別するのに役立ちます。ニューヨーク、ロンドン、またはその両方の重なり合う高ボラティリティ市場に特にお勧めです。 主な特徴: タイムフレームの汎用性: M1からH1以上のあらゆるタイムフレームで迅速かつ正確なシグナルを提供します。 明確な買い/売りシグナル: ADXのDI+とDI-ラインを使用して明確な買いと売りのシグナルを生成し、最良のトレード判断を下せるようにします。 直感的な視覚化: シグナルはチャート上に緑色(買い)と赤色(売り)の矢印で直接表示され、迅速かつ簡単に読み取れます。 カスタマイズ可能な設定: 分析するバーの数とアラートオプションを好みとトレード戦略に応じて調整できます。使用するTFに応じた提案表を以下で確認してください。 即時およびオプションのキャンドル終了時アラート: デフォルトでは、ADX条件が
現在20%OFF! 初心者やエキスパートトレーダーに最適なソリューションです。 このインディケータは、エキゾチックペア・コモディティ・インデックス・先物など、あらゆるシンボルの通貨の強さを表示することに特化したインディケータです。金、銀、原油、DAX、US30、MXN、TRY、CNHなどの通貨の強さを表示するために、9行目にどのシンボルでも追加することができます。独自の機能を多数搭載し、新しい計算式を採用したため、ユニークで高品質、かつ手頃な価格のトレーディングツールとなっています。新しいトレンドやスキャルピングチャンスのトリガーポイントを正確に把握することができるため、あなたのトレードがどのように改善されるか想像してみてください。 ユーザーマニュアル:ここをクリック   https://www.mql5.com/en/blogs/post/708876 すべての時間枠に対応します。あなたはすぐにトレンドを見ることができるようになります! 新しいアルゴリズムに基づいて設計されているため、潜在的な取引の特定と確認がより簡単になります。これは、8つの主要通貨と1つのシンボ
まず第一に、この取引ツールはノンリペイント、ノンリドロー、ノンラグの指標であり、プロの取引に理想的ですことを強調する価値があります。 オンラインコース、ユーザーマニュアル、デモ。 スマートプライスアクションコンセプトインジケーターは、新米から経験豊富なトレーダーまで、非常 に強力なツールです。Inner Circle Trader AnalysisやSmart Money Concepts Trading Strategiesなど、20以上の有用な指標を1つに組み合わせています。このインジケーターはスマートマネーコンセプトに焦点を当て、大手機関の取引方法を提供し、彼らの動きを予測するのに役立ちます。 特に、流動性分析に優れており、機関がどのように取引しているかを理解しやすくしています。市場のトレンドを予測し、価格の動きを慎重に分析するのに優れています。機関の戦略とトレードを合わせることで、市場の動向についてより正確な予測ができます。このインジケーターは多目的であり、市場構造を分析し、重要な注文ブロックを特定し、さまざまなパターンを認識するのに優れています。 このインジケー
現在31%オフ! 初心者やエキスパートトレーダーに最適なソリューション! このインジケータは、独自の機能と秘密の数式を組み込んだ、ユニークで高品質かつ手頃な価格のトレーディングツールです。たった1枚のチャートで28の通貨ペアのアラートを表示します。新しいトレンドやスキャルピングチャンスの引き金となるポイントを正確に把握することができるので、あなたのトレードがどのように改善されるか想像してみてください! 新しい基本的なアルゴリズムに基づいて構築されているため、潜在的な取引の特定と確認がより簡単になります。これは、通貨の強さや弱さが加速しているかどうかをグラフィカルに表示し、その加速のスピードを測定するためです。加速すると物事は明らかに速く進みますが、これはFX市場でも同じです。つまり、反対方向に加速している通貨をペアにすれば、利益を生む可能性のある取引を特定することができるのです。 通貨の勢いを示す縦の線と矢印は、あなたの取引の指針となるでしょう。 ダイナミックマーケットフィボナッチ23レベルはアラートトリガーとして使用され、市場の動きに適応します。もしインパルスが黄色
Please contact me after purchase to immediately get your PDF strategy + documentation for Trend Pulse !  Official release price of $79  (3 /50 copies left). Next price is $129 . Introducing Trend Pulse , a unique and robust indicator capable of detecting bullish, bearish, and even ranging trends! Trend Pulse uses a special algorithm to filter out market noise with real precision. If the current symbol is moving sideways, Trend Pulse will send you a ranging signal, letting you know that it'
通貨強さウィザードは、取引を成功させるためのオールインワン ソリューションを提供する非常に強力な指標です。このインジケーターは、複数の時間枠のすべての通貨のデータを使用して、このまたはその外国為替ペアのパワーを計算します。このデータは、使いやすい通貨インデックスと通貨パワーラインの形式で表され、特定の通貨のパワーを確認するために使用できます。 必要なのは、取引したいチャートにインジケーターを接続することだけです。インジケーターは、取引する通貨の実際の強さを示します。このインジケーターは、トレンドに合わせて取引するときに有利に利用できる売買高の圧力の極値も示します。このインジケーターには、フィボナッチに基づく可能なターゲットも表示されます。 このインジケーターは、PUSH 通知を含むあらゆるタイプのアラートを提供します。 購入後ご連絡下さい。私の取引のヒントをあなたと共有し、素晴らしいボーナスインジケーターを無料で提供します! 幸せで有益な取引をお祈りします。
Order Block Hunter
Noha Mohamed Fathy Younes Badr
5 (3)
Order block hunter indicator is the best indicator for  hunt the order blocks that area where there has been a large concentration of limit orders waiting to be executed Order blocks are identified on a chart by observing previous price action and looking for areas where the price experienced significant movement or sudden changes in direction .This indicator does that for you by using very complicated codes and helps you to take the best areas To buy and sell because it make marks at the best a
Advanced Supply Demand
Bernhard Schweigert
4.91 (294)
現在33%オフ 初心者にもエキスパートトレーダーにも最適なソリューション このインジケーターは独自の機能と新しい公式を多数内蔵しており、ユニークで高品質かつ手頃な取引ツールです。このアップデートでは、2つの時間枠ゾーンを表示できるようになります。より長いTFだけでなく、チャートTFとより長いTF(ネストゾーンを表示)の両方を表示できます。すべてのSupply Demandトレーダーの皆さんのお気に召すはずです。:) 重要情報の公開 Advanced Supply Demandの可能性を最大化するには、 https://www.mql5.com/ja/blogs/post/720245 にアクセスしてください。   エントリーまたはターゲットの正確なトリガーポイントを正確に特定できれば取引がどのように改善されるか想像してみてください。新しい基盤となるアルゴリズムに基づいて構築されているため、買い手と売り手の間の潜在的な不均衡をさらに簡単に特定できます。これは、最も強い需要と供給のゾーンと、過去のパフォーマンス(古いゾーンを表示)がグラフィカルに表現されるためです。これらの機能は、最適
Indicator : RealValueIndicator Description : RealValueIndicator is a powerful tool designed specifically for trading on the EURUSD pair. This indicator analyzes all EUR and USD pairs, calculates their real currency strength values, and displays them as a single realistic value to give you a head start on price. This indicator will tell you moves before they happen if you use it right. RealValueIndicator allows you to get a quick and accurate overview of the EURUSD currency pair tops and bottoms,
カスタムMT4インジケーターで外国為替取引を成功させるための秘密を発見してください! 外国為替市場で成功を達成し、リスクを最小限に抑えながら一貫して利益を得る方法を疑問に思ったことはありますか? これがあなたが探している答えです! 取引へのアプローチに革命をもたらす独自のMT4インジケーターを導入できるようにします。 ユニークな汎用性 私たちのインジケータは、RenkoとRangeBarのろうそくのフォーメーションを好むユーザー向けに特別に設計されています。 これらのチャートタイプは多くの経験豊富なトレーダーに好まれていることを理解しています。そのため、私たちのインジケーターはそれらとシームレスに統合され、比類のない市場分析を提供します。 クリアトレンドシグナル 複雑な分析を忘れてください! 私たちのインジケーターは、鮮やかな色と明確なドット構造を利用して、市場の動向を明確に示しています。 赤と青の点は、価格の動きの方向性について疑いの余地がなく、取引の迅速な意思決定を可能にします。 HH/HL HL/LL戦略とのアライメント HH/HLおよびHL/LL構
TakePropips Donchian Trend Pro
Eric John Pajarillaga Aldana
4.44 (16)
TakePropips Donchian Trend Pro   (MT4) は、ドンチャン チャネルを使用してトレンドの方向を自動的に検出し、エントリーとエグジットの取引シグナルを提供する強力で効果的なツールです! この多機能インジケーターには、トレンド スキャナー、取引シグナル、統計パネル、スクリーナー、取引セッション、およびアラート履歴ダッシュボードが含まれます。取引シグナルを提供し、チャートを分析する時間を節約するように設計されています! ユーザー マニュアルとインストール ガイドは、ブログ投稿 (   https://www.mql5.com/en/blogs/post/751368   ) からダウンロードできます。 今日は 50% オフ! 98ドルから49ドルに値下げ! このインジケーターは、ストラテジー テスターでテストできます (ビジュアル モードを有効にします)。 詳細については、説明の下にあるビデオ チュートリアルも利用できます。 ご不明な点やサポートが必要な場合は、私に連絡してください。 TakePropips Donchian Trend Pro イン
Cycle Sniper
Elmira Memish
4.37 (35)
NEW YEAR SALE PRICE FOR LIMITED TIME!!! Please contact us after your purchase and we will send you the complimentary indicators to complete the system Cycle Sniper is not a holy grail but when you use it in a system which is explained in the videos, you will feel the difference. If you are not willing to focus on the charts designed with Cycle Sniper and other free tools we provide, we recommend not buying this indicator. We recommend watching the videos about the indiactor and system before pu
もちろんです。以下は、提供いただいたテキストの日本語への翻訳です: MT4用の天文学指標をご紹介します:究極の天体トレーディングコンパニオン トレーディング体験を天空の高みに高める準備はできていますか?私たちの革命的なMT4用の天文学指標をご紹介します。この革新的なツールは、複雑なアルゴリズムの力を借りて、類まれなる天文学的洞察と精密な計算を提供します。 あなたの指先で宇宙の情報を: 宝のような天文学的データが明らかになる包括的なパネルをご覧ください。惑星の地理的/太陽中心座標、太陽と地球の距離、星の大きさ、伸び、星座、黄道座標および赤道座標、さらには水平座標まで、それぞれが綿密に計算され美しく表示されています。指標によって生成される垂直線は時間値に対応し、トレーディングの旅に宇宙の視点を提供します。 惑星のラインと関係: グラフを飾る惑星のラインの魔法を体験し、スケールと角度をカスタマイズできます。直感的なコントロールパネルを介して各惑星のラインの表示を簡単に切り替えることができます。指定された時刻範囲内での合会、六分会、四分会、三分会、対会、逆行の指標で天体の関係の芸術を発見してく
Ultimate Sniper Dashboard
Hispraise Chinedum Abraham
4.82 (22)
299ドルで割引中! 今後値上げの可能性あり! 下の説明を読んでください! 究極のスナイパーダッシュボードのための最高のエントリーシステム。究極のダイナミックレベル。(私の製品をチェックしてください) 究極のスナイパーダッシュボードはMT4多通貨テスト制限のため、ライブマーケットでのみ作動します。 究極のスナイパーダッシュボードをご紹介します。HA-Sniper、MA-Sniper、その他多くの特別なモードが含まれる最高の製品です。究極のスナイパーダッシュボードは絶対的な獣です! 初心者やエキスパートトレーダーにとって最高のソリューションです。もう二度と動きを見逃さない! シンプルさとピップを愛するトレーダーのために、特別な製品をご用意しました。シンプルでありながら、ダッシュボードは複数のカスタムアルゴリズムに基づき28の通貨ペアを監視し、すべての作業を行います。たった一つのチャートで、プロのように市場を読み解くことができます。もし、為替ペアが動き出したときに、その方向性を正確に特定することができれば、あなたの取引はどれほど改善されることでしょう。   当社のシ
これはMT4のインジケーターで、再描画なしで取引に参入するための正確なシグナルを提供します。 外国為替、暗号通貨、金属、株式、インデックスなど、あらゆる金融資産に適用できます。かなり正確な見積もりを提供し、取引を開始して終了するのに最適な時期を教えてくれます。1つのシグナルを処理しただけでインジケーターの元が取れた例の 動画 (6:22)をご覧ください。Entry PointsPro インジケーターの助けを借りたほとんどのトレーダーの最初の1週間の結果が改善しています。 Telegramグループ に登録してください。Entry Points Proインジケーターのメリットは次の通りです。 再描画のないエントリーシグナル 再描画されるインジケーターでは一度表示されたシグナルが削除されて大きな金銭的損失につながることがありますが、これと異なり、表示されて確認されたシグナルは消えることがありません。 エラーなしの取引開始 インジケーターアルゴリズムによって取引を開始する(資産を売買する)理想的な瞬間を見つけることができます。それを使用するすべてのトレーダーの成功率が向上します。
Apollo BuySell Predictor は、いくつかの取引モジュールを含む専門的な取引システムです。独自のブレイクアウト ゾーン、フィボナッチ ベースのサポートとレジスタンス レベル、ピボット トレンド ライン、プルバック ボリューム シグナル、およびトレーダーが日常的に必要とするその他の便利な機能をトレーダーに提供します。システムはどのペアでも機能します。推奨される時間枠は M30、H1、H4 です。インジケーターは、H4 よりも高い時間枠を除いて、他の時間枠でも機能します。 このシステムは、トレーダーが取引を成功させるために必要なすべてを提供するため、普遍的です。システムは複数の方法で使用できます。デイトレード、スイングトレード、さらにはスキャルピングにも使用できます。どのような取引スタイルを好む場合でも、システムは市場を真の姿で見るのに役立ちます。すべての信号は再描画せず、ラグもありません! 取引の好みやタスクに応じて、システムのさまざまなモジュールのオン/オフを切り替えることができます。システムは、PUSH 通知を含むすべてのタイプのアラートを提供します。必要なアラー
ON Trade Waves Patterns Harmonic Elliot Wolfeをご紹介します。これは手動および自動の方法を使用して市場のさまざまなパターンを検出するために設計された高度なインジケーターです。以下はその動作方法です: ハーモニックパターン: このインジケーターは、チャートに表示されるハーモニックパターンを識別できます。これらのパターンは、Scott Carneyの「Harmonic Trading vol 1および2」で説明されているように、ハーモニックトレーディング理論を実践するトレーダーにとって重要です。手動で描画するか、自動検出に頼るかにかかわらず、ON Trade Waves Patternsがお手伝いします。 コントロールパネル: このインジケーターはユーザーフレンドリーなコントロールパネルを備えています。チャートと時間枠の設定を保存し、異なる構成間をスムーズに切り替えることができます。チャートスペースを最大限に活用するために最小化することもできます。他の分析ツールで作業することを好む場合、閉じるボタンをクリックするだけで、すべてのインジケーターデ
Scalper Vault は、スキャルピングを成功させるために必要なすべてを提供するプロフェッショナルなスキャルピング システムです。このインジケーターは、外国為替およびバイナリー オプションのトレーダーが使用できる完全な取引システムです。推奨される時間枠は M5 です。 システムは、トレンドの方向に正確な矢印シグナルを提供します。また、トップとボトムのシグナルとギャン マーケット レベルも提供します。 インジケーターは、プッシュ通知を含むすべてのタイプのアラートを提供します。 インジケータの購入後にご連絡ください。私の個人的な取引の推奨事項と素晴らしいボーナス指標を無料で共有します! 幸せで有益な取引をお祈りします!
Break and Retest
Mohamed Hassan
4.18 (17)
This Indicator only places quality trades when the market is really in your favor with a clear break and retest. Patience is key with this price action strategy! If you want more alert signals per day, you increase the number next to the parameter called: Support & Resistance Sensitivity.  After many months of hard work and dedication, we are extremely proud to present you our  Break and Retest price action indicator created from scratch. One of the most complex indicators that we made with ove
作者のその他のプロダクト
XLineBreak
Ahmet Metin Yilmaz
5 (1)
このインジケーターは、入力パラメーター バー検出戦略を使用してブレイクアウトを除外します。 WaitForBarClosed 関数を使用してシグナル (true) を確認できますが、false よりも少し遅れてアクティブになることがあります。 インジケーターが別のウィンドウで開きます。 すべての時間枠とペアに適しています。 青い線はトレンドの方向を示しています。 任意のチャートにインジケーターを添付 ポップアップ表示されるインジケーター ダイアログ ボックスから、入力タブで目的の入力を選択します。 [OK] を選択して確認し、続行します。 パラメーター Lines_Break: 周期、推奨値は 3 ~ 21 です。周期が大きいほど、インジケーターが滑らかになります。 WaitForBarClosed: "true" または "false"。 よりタイトなストップ ロスと小さなテイク プロフィット レベルによって、より早いシグナルに「false」を使用できます。 確認済みシグナルには「true」を使用できます。 true と false の両方のオプションが一緒に使用されて
TripleS
Ahmet Metin Yilmaz
5 (1)
3S indicator  designed for trend detection without the effect of accidental price leaps. It uses Price Series and a few moving averages for noise reduction. It works on multiple timeframes, even M1. To increase effectiveness, it is recommended to use default parameters for M1 graphic (see screenshots). You can change settings for other time frames. Example of using this indicator : If  Gold  cross to  Blue  down and both gold and blue under the  Gray ,  it could be a promising sell signal . To
EwoMov
Ahmet Metin Yilmaz
EwoMov indicator is useful for determining a trend with higher period of price Moving Averages (it should be higher than 200). I am using this indicator for swing trade on M5-M30 charts. This indicator uses several bars for calculation. They are all saved in external parameters. The proper values are 5 - 13 - 34, but you can change them. It is ready for all timeframes, but does its best for M5-H1. It is designed to be optimized for other timeframes. You can find some explanations on screenshots.
Mighty Scalper LightEA A Trend Friendly EA There are different and complex logic mixed in it It begins to work, simply with a BreakOut strategy and Works in PARTIAL CLOSE and CLOSE TIME LIMIT you had never seen before in the market expert... It opens an order and use partial close in a specific levels and close order within a specific time ( if order still live ) No Martingale and hedging It works any kind of broker, but lower spread gets more gain Fast optimization for strategy tester ( for
This EA uses  Non-Repaint Hull Moving Averages calculation. You can find positive results with the correct optimization. Optimization should be adjusted according to the properties of the broker you are using and your trading institution. Default settings are optimized for AUDUSD in an ECN broker for M30 time frame. (Remember, it is necessary to re-optimize your brokers for the settings.) Test it before buying for your broker settings if it is ok, It is recommended use rental option to be sure
The Great Gig In The Sky is an expert advisor and also a song from My favorite Rock Band's. Pink Floyd.  There is only one input parameter. Lots amount. You know what do you do in there. Try in a demo account from your real broker to test. Expert logic also includes stop loss and take profit transactions. Do not worry about them. The one-month rental period is only for you to try the experiment and is valid for limited copy. Tested and Preferred pairs are GBPJPY, CHFJPY,CADJPY. I am still contin
HMA Nrp
Ahmet Metin Yilmaz
Alan Hull's moving average, more sensitive to the current price activity than the normal MA. Reacts to the trend changes faster, displays the price movement more clearly. No Repaint Version on separate Windows shows the trend 1 and -1 . Improvement of the original version of the indicator by WizardSerg <wizardserg@mail.ru>. Suitable for all timeframes. Parameters Period - period, recommended values are from 9 to 64. The greater the period, the smoother the indicator. Method - method, suitable
OneWayTicket indicator is based on CCI indicator. In fact, it analyzes multiple CCIs from several timeframes. There are four Ways of OneWayTicket, read from left to right - 15 min, 30 min, 1 hour and 4 hours. The idea is to enter the market when all four CCIs agree on a trend. A trader chooses which timeframes to monitor. When all four ways of the OneWayTicket are green - Buy . When all four ways of the OneWayTicket are bright red - Sell . Original idea from the author: tageiger, revised for the
This Script Shows your Account & Symbol information which you use on your graphics. These are: Account Information Number Name Currency Server Leverage Stop Out Level Balance Information Balance Equity Margin Free Margin Symbol Information Symbol Lot Size Min.Lot Lot Step Max.Lot Tick Value Tick Size Spread Stop Loss Level Swap Long Swap Short Initial Margin Maint.Margin Required Margin Trade Allowed
Virtue
Ahmet Metin Yilmaz
"Virtue" is a fully automated Long term Expert Advisor. It calculates market condition itself and decides to enter a position. "Virtue" needs patience that is the why its name Virtue. Patience is a virtue. You must be patient to make some Money. You have to wait for it to find optimal conditions to open an order. It will be enough to just install it on the platform. No need to optimize many parameters. Expert is optimized for EURUSD H1 timeframe. First download demo and test it for your broker.
Virtue Multi Lot   "Virtue" is a fully automated Long term Expert Advisor. It calculates market condition itself and decides to enter a position. This is the main position. After that position, it adds some small lots for scalping. You can select how many orders will be open extra. It depends on your account margin and risk managment. "Virtue" needs patience that is the why its name Virtue. Patience is a virtue. You must be patient to make some Money. You have to be wait it find optimal condit
Instructions Attach the indicator to any chart (advised H4) Use input tabs (defaults are 5 and false ) Press ok and continue trading. Description The indicator uses a kind of pattern breakout strategy to help your trading strategy. I am using this strategy on H4 charts for many of pairs with a trailing stop and default indicator settings. Better results are shown on USDJPY, EURJPY, CADJPY, EURGBP, EURUSD, USDCAD, USDCHF, NZDUSD and GBPUSD. Trailing stops should be different for each pair. The
PivotSupportResistance This indicator plots horizontal lines at daily pivot levels R3, R2, R1, Pivot, S1, S2, S3, where R means Resistance and S means Support. This indicator can be applied to any chart period, although daily pivots on charts with long periods are meaningless (if you switch your chart timeframe greater than daily chart, you will get alert and indicator will not work). Labels are shown for the most recent day's levels. There are no external inputs, so it is easy to use. Please re
PriceChannel is designed for trend detection without the effect of accidental price leaps. It uses Price Series and a few moving averages for noise reduction. It works on multiple timeframes, even M1. To increase effectiveness, it is recommended to use 3 instances of PriceChannel with different parameters on one chart (see screenshots). You can use the following settings (for M1 charts): PriceChannel(10,2,30) Gold colour. PriceChannel(10,5,30) Blue colour. PriceChannel(21,8,13) Gray colour. Exa
VoMa
Ahmet Metin Yilmaz
Variation of Moving Averages indicator is calculated as the difference between different periods of moving averages. Obtained result filtered by another MA. It displays more precise signals of divergences between prices and the value of the indicator. It emphasizes price extremums more precisely, it moves faster. There are three inputs FastMA: Default is 13, shows MA period. SlowMA: Default is 21, shows MA period. SignalMA: Default is 8, shows MA period. It basically detects the trend, advised
This indicator calculates price movement with the Volume. The Volume indicates the number of deals in the desired period, but does not show number of contracts per deal. From this point of view, the tick does not reflect the true volume. However it is a valuable demand indicator. Volume and price are calculated with a special formula. There are 3 input parameters EMAPeriod: Price and volume data are calculated using this period of Moving Average first. DEMAPeriod: Results of first EMA, recalcu
Doma
Ahmet Metin Yilmaz
Differences of Moving Averages This indicator plots short term trend with two moving averages difference and its signal line. Best result at 5 min chart in default parameters. There are 7 extern input parameters: MaShortPeriod: period of the first MA. MaLongPeriod: period of the second MA. ModeDoMA: DoMA method. ModePrc: MA price mode. SignalMaPeriod: Period of Signal MA. ModeSma: Signal MA mode. LabelLevel: Horizontal line level on display. Default parameters can be changed by user.
HLOC Trend Indicator This indicator helps you to determine trend direction on your trade. Default parameters for H1 time frame. You can use this indicator both bigger time frame and smaller time frame to open a trade. The calculation is based on high, low, opening and closing price values of each bar in the selected time period. When the values found in the Indicator custom formula are exceeded, the buy or sell signal falls on the screen. There are two extern inputs; RiskFactor: Early but risky
This indicator shows Linear Regression Line and it's channels which calculated with fibo numbers. You can use this indicator in different timeframes on your chosen timeframe chart. You only need to attach this indicator on the chart twice or more with a different colors to do this.  There are 6 input parameters; period      : you can choose regression timeframe independent of chart timeframe. linewidth : width of line on the chart. bars back regression begin : calculated regression bar count. LR
This indicator examines the relative strengths of the currencies of 8 different countries and displays the one that has the potential to gain profit in the short term as a suggestion. The relative strength of each country's currency over the selected time period is shown on the graph as a percentage. The recommended currency according to BuyLevel and SellLevel determined by the user is shown in the bottom right section. The indicator also automatically brings up the 30-minute graph of the sugge
Price Action Signals generates buy and sell signals with price close and complex logic. You can use it different timeframes and pairs.  Best results are on M30 and H1 charts with default parameter. You can change this parameter ( nFrequency ) for other timeframes. ( except M1 timeframe ) There is only one extern input: nFrequency: It determines signal frequency. Default is 0.004. You can use this arrow for Expert Advisors. Upsignal: iCustom(......"PriceActionSignals", buffer nr:0 ) Downsignal :
ATR Channel is an indicator. It shows us ATR ( depends on selected period ) Line on main chart. It also draw 3 up ATR channels (ATRu) and 3 down ATR channels (ATRd) on the same window. All they helps you to trade with a ATR indicator. There are 6 extern inputs; PeriodsATR   : You can change ATR Period default is 13. MA_Periods   : Use for draw ATR channels MA periods. Default is 34. MA_Type       : You can change MA_method here. Default is Linear weighted. Mult_Factor1 : It is for first up and d
PriceRunner
Ahmet Metin Yilmaz
5 (1)
偶発的な価格急騰の影響を受けずにトレンドを検出するように設計された PriceRunner インジケーター。 ノイズ削減のために、Price Series といくつかの移動平均を使用します。 M1 を含め、複数の時間枠で動作します。 効果を高めるには、M1 グラフィックにデフォルトのパラメーターを使用することをお勧めします (スクリーンショットを参照)。 他の時間枠の設定を変更できます。 このインジケーターの使用例: ゴールドがブルーにクロスし、ゴールドとブルーの両方がグレーの下にある場合、有望な売りシグナルである可能性があります。 このインジケーターからシグナルを取得するには (プロのエキスパート ユーザー向け): ゴールド: バッファー番号。 0、青: バッファ番号。 1、灰色: バッファ番号。 2 このインジケーターは同じロジックを使用し、「TripleS インジケーター」を計算しますが、チャート ウィンドウではなく別のウィンドウに描画します。以前に「TripleS インジケーター」を販売した場合、これも販売することをお勧めしません。スクリーンショットを見て、最初にデモをテ
BuySellEA
Ahmet Metin Yilmaz
SrEwo Expert adviser designed and optimized for EURUSD. You may Optimize all other instruments. It is easy to use.  *** It uses only M5 chart graphic and you need to use M5. ( Both test and live ) Input Parameters: Lots: Base lot amount.Expert use this amount as referance.  crossfactorlimit: expert will open new order with this limit modifylimit & TP limit : order modify and another TP limit. targetprofit : expert calculates this number in its logic. crossfactor : next order lots multiply with t
Expert works H1 timeframe only There are two main criteria. Daily pivots and moving averages. To open a buy order, today's daily pivot must greather than the day before's daily pivots.  Moving averages for EURUSD pair as default. They can be changed for other pairs and also for EURUSD too. You can also change takeprofit and stoploss level. expert doesnt trade on mondays and before 2 hour on other trade days. You can test and optimize for all pairs with extern parameters. Do not purchase without
Psr1EA
Ahmet Metin Yilmaz
Psr1 EA is the one of Psr series EAs. It works on 5 minutes chart only. You can use this EA any currencies but you should optimize first. Default parameters belongs to my broker databases EURUSD M5 . It uses pivot  and 2 main moving averages.  Moving averages can be adjustable by user. ( for optimizing ) Input Parameters:  MagicNum: Expert will use this number to determine experts orders. Lots: Lots amount which you want to use. Default is 0.01 ( it can be cahnged by expert due to your broker's
Psr3EA
Ahmet Metin Yilmaz
Psr3 EA is the one of Psr series EAs. It works on 5 minutes chart only. You can use this EA any currencies but you should optimize first. Default parameters belongs to my broker databases EURUSD M5 . It uses pivot  and Support/Resistance Levels.  Stoploss and Takeprofit can be adjustable by user. ( for optimizing ) Input Parameters:  MagicNum: Expert will use this number to determine experts orders. Lots: Lots amount which you want to use. Default is 0.01 ( it can be cahnged by expert due to you
Indicator values are in the range 0-100. The greater is the indicator value, the greater is the market stability, so the more likely we have trend. The smaller is the indicator value - the less probable the trend is. Tips: Trading on unstable market:     Buy, when moving average (blue line) of the CMI indicator is below 40 and the histogram is red.     Sell when moving average (blue line) of the CMI indicator is below 40 and the histogram is green.     Close positions when CMI his
SIGNALINE INDICATOR This indicator for all pairs and all timeframes I have just completed the M5 timeframe for deep optimization EURJPY yet. EURJPY M5 Optimization ( TP=150 , SL=130 , IndicatorPeriod=6 , Mov1=22 , Mov2=48 ) (*)Added 20.05.2019 You can find this signal page below https://www.mql5.com/en/signals/583477 Other optimizasyon results will be added on this signalpage. Input Parameters: IndicatorPeriod: Default is 8. Mov1               : Default is 21. Mov2               : Default is 48.
フィルタ:
レビューなし
レビューに返信