Smoothed DeMarker
- インディケータ
- Victor Golovkov
- バージョン: 1.0
Индикатор сглаженного DeMarker Oscillator (xDeM)
Входные параметры:
- Period - период усреднения
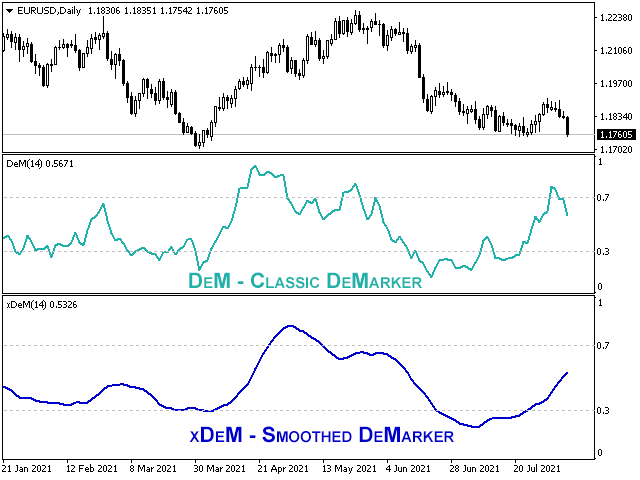
Принцип работы
Индикатор перерассчитывает стандартный технический индикатор DeMarker Oscillator (дважды усредняет получаемые значения).
Период усреднения индикатора соответствует двойному периоду стандартного DeMarker Oscillator.
Например: xDeM с периодом усреднения 7 соответствует DeM c периодом 14.
Индикаторный буфер не перерисовывается.