Chances
- インディケータ
- Ahmed Alaaeldin Abdulrahman Ahmed Elherzawi
- バージョン: 1.3
- アップデート済み: 28 2月 2022
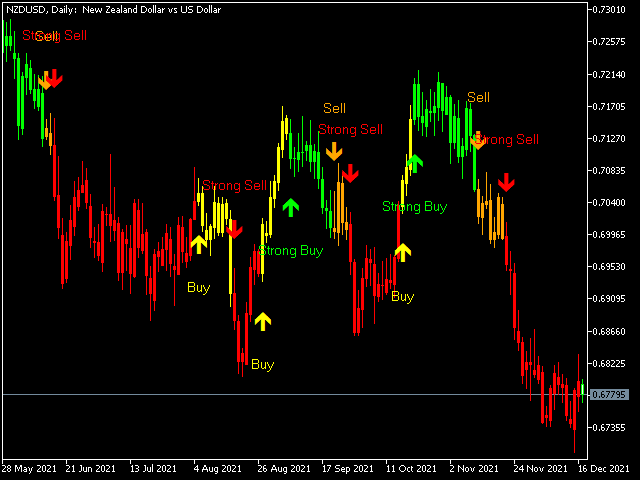
The Investment Castle Chances indicator will show signals on the chart for entering a buy or sell trade. There are 2 types of signals for each direction as follows:
- Buy / Sell (Orange colored candlesticks)
- Strong Buy (Green colored candlesticks) / Strong Sell (Red colored candlesticks)
You may place a buy trade once you see the Buy arrow or vise versa, or you might prefer to wait for a further confirmation “Strong Buy” / “Strong Sell”. This indicator works best with the high time frames H1, H4, D, W.
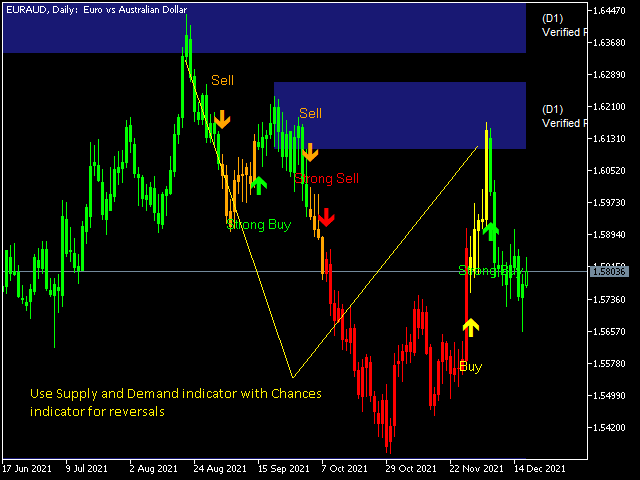
However, at reversals, it is best to see the lower time frames for a confirmation on the turning point.
Example:
You load the indicator on NZDUSD on D1 time frame with the Supply and Demand or Support and Resistance indicator. You will see a support below the current price level.
Load the indicators on H1 chart and observe a pullback at strong support, from there you could catch the long trend earlier.
Now, we can clearly see the Price Action and Trend Analysis automatically on the chart. The Price has retested the resistance and it is expected to fall to the next support level.
Settings:
I tried my best to reduce the number of inputs to the minimum possible. Therefore, you will see that most of the inputs are for colors. However, I found the best settings as set the defaults, so you simply install the indicator and you are good to go.


It is Good Indicator but i want to aks, Is it need for update anytime or it will be permanent set up after installed on mt5 terminal ? because i would like to apply for my real account. I need reply as soon as possible sir ? thanks for your attention.