Multi Chart MT4
- インディケータ
- Tais Miranda Hoffmann
- バージョン: 1.10
- アップデート済み: 21 2月 2022
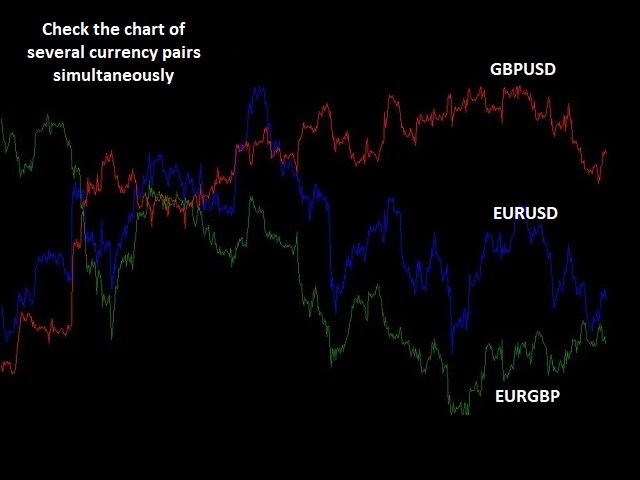
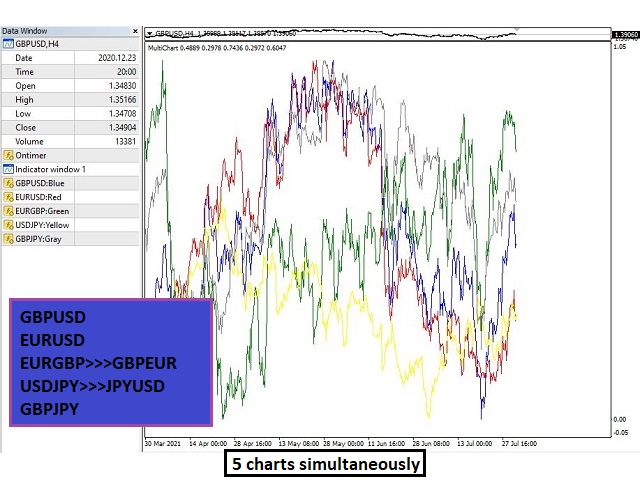
An indicator for analyzing different currency pairs simultaneously
Forex is a complex market that requires several currency pairs to be analyzed simultaneously
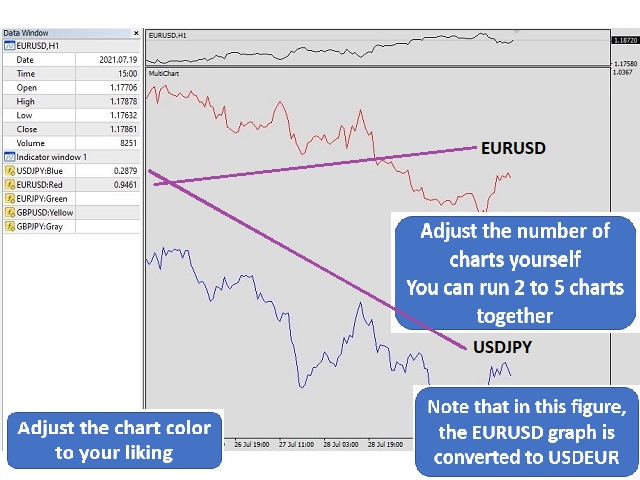
Determine the number of currency pairs yourself
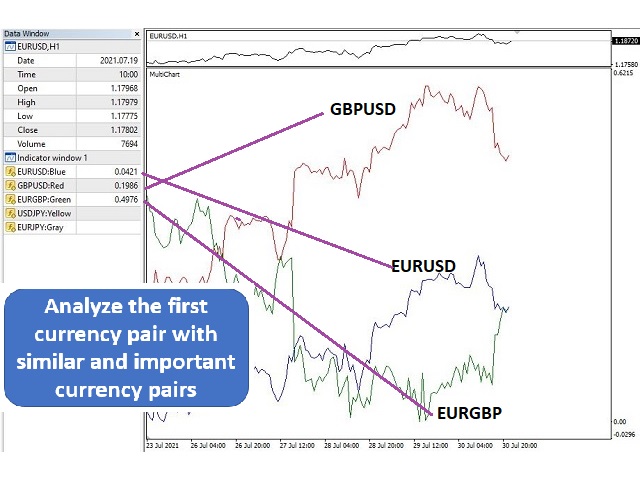
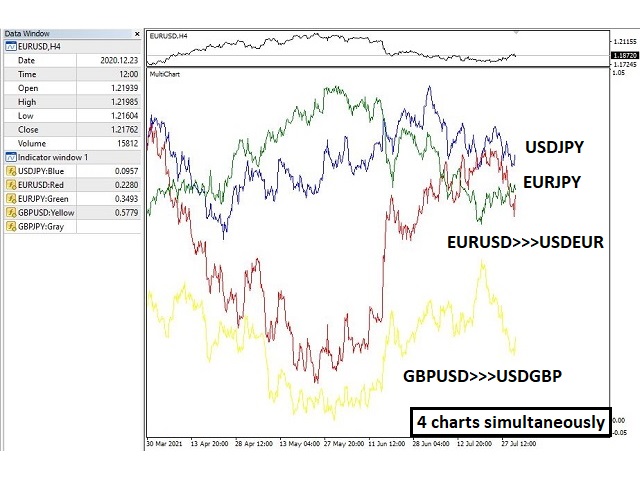
Determine the currency pair you want to analyze to analyze 4 of the most important and similar currency pairs at the same time.
For direct and simple analysis, some currency pairs have changed (EURUSD>>>USDEUR)
Do not doubt that to succeed in this market, you must analyze several currency pairs at the same time to succeed
- The complexity of the Forex market
- Requires simultaneous analysis of several currency pairs
- It is also difficult to analyze opposite currency pairs ( EURUSD , USDJPY )
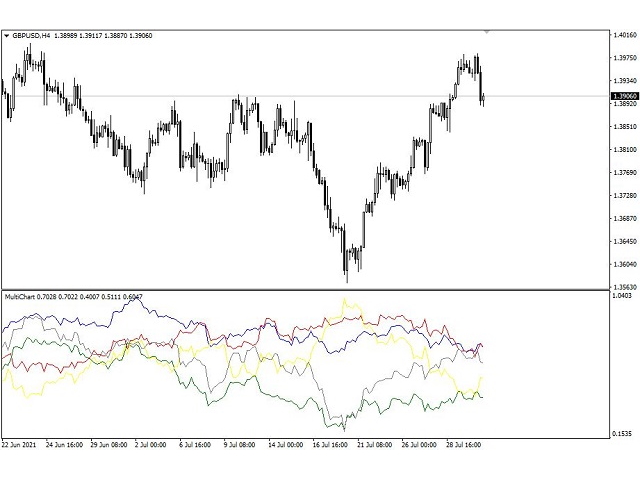
- Currency pair charts are linear
- Prices are based on the Close price of candles
- You determine the main currency pair you want to analyze
- Other currency pairs are selected based on the original currency pair
- The charts of some currency pairs are reversed. For example, if you want to analyze the EURUSD pair, the chart of the USDJPY turns into the JPYUSD
- Determine the number of currency pairs you want to analyze at the same time
- You should analyze the displayed currency pair diagrams simultaneously in different ways (such as Price Action)
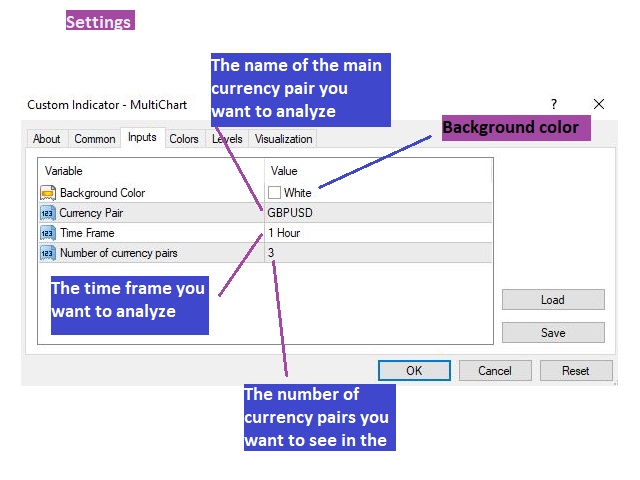
- Currency Pair ( Determine the main currency pair you want to analyze )
- Time Frame ( Specify the time frame you want to analyze )
- Number of currency pairs ( Determine the number of currency pairs you want to analyze at the same time )
- At the beginning of the work, try to analyze a small number of currency pairs first so that it is not difficult
- If there is a problem, tell me so I can fix it right away
- If the graph is not displayed correctly, your data is incomplete
- To avoid troubles, the number of candles that are initially displayed is small. For more analysis, run a back test.
- Can be used in all time frames
- With fast support
- With a simple and fast way of working
- With functional settings
- Why is the graph not displayed correctly? The amount of data you have in other currency pairs is small
- Which currency pairs should we download? Only the currency pairs you see in the data Window section
- Where is data Window Meta Trader? Press the "ctrl" + "D" at the same time
- What information does this part of data Window display? Pairs of currencies used. You can also see their color. See the photos to find out
- How to download the data of this currency pair? Just run the chart of that currency pair
- To run this indicator online, do you need to run chart all 5 currency pairs simultaneously? Yes, to run this indicator online, to download data online, you need to run the required currency pairs to download the data at the same time.

A lot of people charge a lot for the same kind of stuff but this one is free. Thanks.