• 概要
  • レビュー
  • コメント
  • 最新情報

ATeam Impulse

The Elder Impulse System was designed by Alexander Elder and featured in his book. According to Elder, “the system identifies inflection points where a trend speeds up or slows down”. The Impulse System is based on two indicators, a  exponential moving average and the MACD-Histogram. The moving average identifies the trend, while the MACD-Histogram measures momentum. As a result, the Impulse System combines trend following and momentum to identify tradable impulses. This unique indicator combination is color coded into the price bars for easy reference.
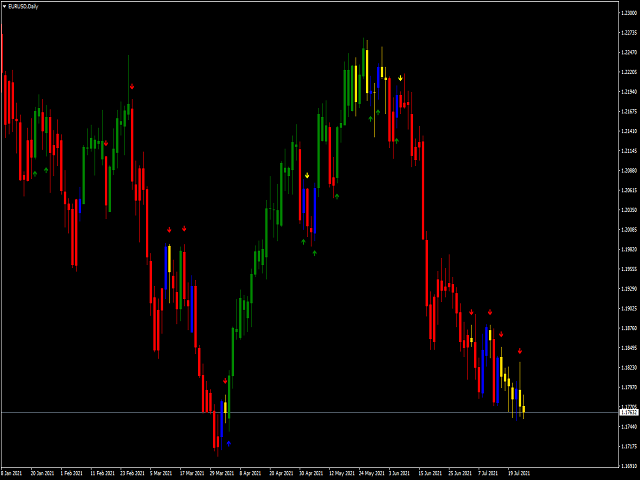
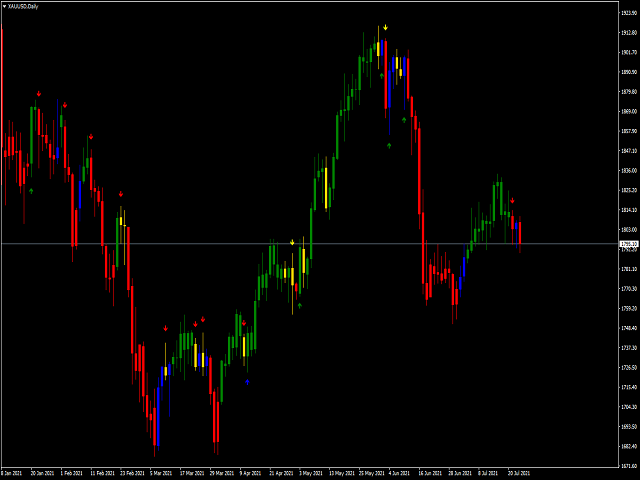
The indicator use 4 colors insteady 3 color on the original idea.
Green/Blue bars show that the bulls are in control of both trend and momentum as both the EMA and MACD-Histogram are rising. Red /Yellow bars indicates that the bears have taken control because the 13-day EMA and MACD-Histogram are falling.
Up arrow is signal for Buy.
Down arrow is signal for Sell.
おすすめのプロダクト
TrendPlus
Sivakumar Subbaiya
4.21 (14)
Trend Plus   Trendplus  Indicator   Time Frame: Suitable for any time frame.  Purpose: Trend Prediction. Blue and red candle indicate the buy and sell call respectively. Buy: When the blue candle is formed buy call is initiated. close the buy trades when the next red candle will formed.   Sell: When the Red candle is formed Sell call is initiated. close the Sell trades when the next blue candle will formed.   Happy trade!!
FREE
Title : UT_Bot - ATR-Based Trading Indicator Introduction : Discover the power of "UT_Bot," the ultimate trading indicator that leverages the Average True Range (ATR) to provide unparalleled accuracy in your trading decisions. If you're seeking a more reliable alternative to the Super Trend indicator, look no further. UT_Bot is your key to precision trading. Key Features : ATR-Powered Precision: UT_Bot uses the ATR to deliver accurate signals that adapt to market volatility. Enhanced Trend Detec
[ZhiBiCCI]インディケータは全てのサイクル使用に適しており、そして全ての市場品種にも適しています。 [ZhiBiCCI]緑色の実線は強気の発散の逆転です。緑色の点線は古典的な強気の発散です。 [ZhiBiCCI]赤への実線は逆弱気の発散である。赤い点線は古典的な弱気の発散です。 [ZhiBiCCI]はパラメータ(アラート、メール送信、通知送信)で設定でき、(true)に設定するとインスタント信号をアラームウィンドウに送信し、Eメール、インスタントメッセージを送信できます。 パラメータ設定の説明 [displayAlert]:これはアラームスイッチで、trueに設定され、矢印が表示されればプロンプトに自動的に警告され、falseに設定されれば警告されません。 [sendmail_NO_OFF]:これはメールを送信するためのスイッチで、trueに設定します。矢印が表示されていればMT4で設定したメールボックスにメールを送信し、falseに設定されていればメールを送信しません。 [sendnotification_NO_OFF]:これはインスタントメッセー
Owl smart levels
Sergey Ermolov
4.63 (54)
MT5版  |   FAQ Owl Smart Levels Indicator   は、 Bill Williams   の高度なフラクタル、市場の正しい波構造を構築する Valable ZigZag、エントリの正確なレベルをマークする Fibonacci レベルなどの一般的な市場分析ツールを含む 1 つのインジケーター内の完全な取引システムです。 利益を得るために市場と場所に。 戦略の詳細な説明 インジケータを操作するための指示 顧問-取引助手 プライベートユーザーチャット ->購入後に私に書いて、私はプライベートチャットにあなたを追加し、あなたはそこにすべてのボーナスをダウンロードすることができます 力はシンプルさにあります! Owl Smart Levels   取引システムは非常に使いやすいので、専門家にも、市場を勉強し始めて自分で取引戦略を選択し始めたばかりの人にも適しています。 戦略と指標に秘密の数式や計算方法が隠されているわけではなく、すべての戦略指標は公開されています。 Owl Smart Levels を使用すると、取引を開始するためのシグナルをすばやく確認し、
Sto Signal AM
Andriy Matviyevs'kyy
5 (1)
This indicator displays Stochastic osc signals on the price chart and allows the user to receive notifications of such signals. The Stochastic indicator is a classic and proven indicator of the technical analysis of the markets. Despite its age, it is still relevant today. Depending on the settings, the indicator allows you to work effectively on various TFs and any markets. Signals are given on fully formed bars and are not redrawn. Custom Parameters: Stochastic_Price (0-1) - The applied pric
FREE
QualifiedEngulfing - は ProEngulfing インジケーターの無料版です。 ProEngulfing - は Advance Engulf インジケーターの有料版で、 こちらからダウンロードできます。 ProEngulfing の無料版と有料版の違いは何ですか?無料版は1日に1つのシグナルの制限があります。 QualifiedEngulfingをご紹介します - あなたのMT4用のプロフェッショナルエンゴルフパターンインジケーター Precisionの力を解放して、QualifiedEngulfingを使用して外国為替市場での資格のあるエンゴルフパターンを特定および強調する先進的なインジケーターです。MetaTrader 4用に開発されたQualifiedEngulfingは、外国為替市場のエンゴルフパターンを確認およびハイライトするために設計された切り立ったアプローチを提供し、取引の決定に対して最も信頼性の高いシグナルのみを受け取ることを確認します。 QualifiedEngulfingの動作方法: QualifiedEngulfingは、エンゴルフパター
FREE
The indicator allows you to trade binary options. The recommended time frame is М1 and the expiration time is 1,2,3 minutes. The indicator suitable for auto and manual trading. A possible signal is specified as a arrows above/under a candle. You should wait until the candle closes! Arrows are not re-painted Trade sessions: TOKYO section (Half-end) Currency pairs: USD/JPY Working time frame: M1 Expiration time: 1,2,3 minutes. The indicator also shows good results when using the martingale strateg
FREE
Trend PA
Mikhail Nazarenko
5 (3)
The Trend PA indicator uses   Price Action   and its own filtering algorithm to determine the trend. This approach helps to accurately determine entry points and the current trend on any timeframe. The indicator uses its own algorithm for analyzing price changes and Price Action. Which gives you the advantage of recognizing, without delay, a new nascent trend with fewer false positives. Trend filtering conditions can be selected in the settings individually for your trading style. The indicator
Forex Gump
Andrey Kozak
2.83 (6)
Forex Gump is a fully finished semi-automatic trading system. In the form of arrows, signals are displayed on the screen for opening and closing deals. All you need is to follow the instructions of the indicator. When the indicator shows a blue arrow, you need to open a buy order. When the indicator shows a red arrow, you need to open a sell order. Close orders when the indicator draws a yellow cross. In order to get the most effective result, we recommend using the timeframes H1, H4, D1. There
Discover the power of precision and efficiency in your trading with the " Super Auto Fibonacci " MT4 indicator. This cutting-edge tool is meticulously designed to enhance your technical analysis, providing you with invaluable insights to make informed trading decisions. Key Features: Automated Fibonacci Analysis: Say goodbye to the hassle of manual Fibonacci retracement and extension drawing. "Super Auto Fibonacci" instantly identifies and plots Fibonacci levels on your MT4 chart, saving you tim
FREE
The indicator shows the potential trend direction by cyclical-wave dependence. Thus, all the rays of the intersection will be optimal rays, in the direction of which the price is expected to move, taking into account the indicator period. Rays can be used as a direction for potential market movement. But we must not forget that the approach must be comprehensive, the indicator signals require additional information to enter the market.
Break Moment
Svyatoslav Kucher
5 (1)
Break Moment is a unique proprietary indicator with extensive capabilities and a variety of settings. It can be used as a signal generator or as an auxiliary tool. For the calculations, the price channel is determined. When it is broken, if all conditions of the additional filter are met, it displays a signal in the form of a histogram. Break Moment can be used to determine the main trend, as it has 2 filters for determining it in addition to everything else. If these filters are activated, the
We present you the indicator "Candle closing counter", which will become your indispensable assistant in the world of trading. That’s why knowing when the candle will close can help: If you like to trade using candle patterns, you will know when the candle will be closed. This indicator will allow you to check if a known pattern has formed and if there is a possibility of trading. The indicator will help you to prepare for market opening and market closure. You can set a timer to create a p
This is a trend indicator without redrawing Developed instead of the binary options strategy (by the color of the Martingale candlestick) Also works well in forex trading When to open trades (binary options) A signal will appear in the place with a candle signaling the current candle It is recommended to open a deal for one candle of the current timeframe M1 and M5 When a blue dot appears, open a deal up When a red dot appears, open a trade down. How to open trades on Forex. When a signal is rec
"The trend is your friend" is one of the best known sayings in investing, because capturing large trendy price movements can be extremely profitable. However, trading with the trend is often easier said than done, because many indicators are based on price reversals not trends. These aren't very effective at identifying trendy periods, or predicting whether trends will continue. We developed the Trendiness Index to help address this problem by indicating the strength and direction of price trend
MTF Kijun
Kristmundur Roman Zakharii
4 (1)
The indicator plots higher timeframe Kijun-sen (of Ichimoku ) on lower timeframes. To change timeframes, in the timeframe field enter the number: M1    PERIOD_M1 1 1 minute. M5    PERIOD_M5 5 5 minutes. M15  PERIOD_M15 15 15 minutes. M30  PERIOD_M30 30 30 minutes. H1    PERIOD_H1 60 1 hour. H4    PERIOD_H4 240 4 hour. D1    PERIOD_D1 1440 Daily. W1   PERIOD_W1 10080 Weekly. MN1  PERIOD_MN1 43200 Monthly. By default, the Kijun is shifted 3 periods forward but if you wish to have it exactly
The indicator displays the data of the Stochastic oscillator from a higher timeframe on the chart. The main and signal lines are displayed in a separate window. The stepped response is not smoothed. The indicator is useful for practicing "manual" forex trading strategies, which use the data from several screens with different timeframes of a single symbol. The indicator uses the settings that are identical to the standard ones, and a drop-down list for selecting the timeframe. Indicator Parame
Improved version of the free HMA Trend indicator (for MetaTrader 4) with statistical analysis. HMA Trend is a trend indicator based on the Hull Moving Average (HMA) with two periods. HMA with a slow period identifies the trend, while HMA with a fast period determines the short-term movements and signals in the trend direction. The main differences from the free version: Ability to predict the probability of a trend reversal using analysis of history data. Plotting statistical charts for analyz
The main idea of this indicator is rates analysis and prediction by Fourier transform. Indicator decomposes exchange rates into main harmonics and calculates their product in future. You may use the indicator as a standalone product, but for better prediction accuracy there is another related indicator - FreqoMaster - which uses FreqoMeterForecast as a backend engine and combines several instances of FreqoMeterForecast for different frequency bands. Parameters: iPeriod - number of bars in the ma
矢印を再描画しない外国為替スキャルピング インジケーター。 M5、M15、M30、H1 の時間枠で最適に機能します。デフォルト設定は M5 時間枠用です。下の図は、「期間 = 0.35」パラメーター値を使用して H1 チャートで作業する例を示しています。デモ版をダウンロードして、自分でテストできます。現在、ほとんどすべてのスキャルピング戦略でこのインジケーターのシグナルを使用しています。私たちの計算によると、そのシグナルの精度は時間枠に応じて約 95% です。このインジケーターは、すべての通貨ペアで機能します。すべての主要通貨ペアと金属でテストしました。どこでも±95%のほぼ同じ精度が得られました。 インジケーターの利点: 矢印を再描画しません すべての通貨ペアで動作します 高い信号精度 スキャルピングに良い インジケーターの設定: period - 信号精度を計算するための期間。 price - インジケーターにどの価格を使用するかを指示します: CLOSE、OPEN、HIGH、LOW。デフォルトでは、インディケータは CLOSE 価格で動作します。
Binary Options Assistant (BOA) Multi Currency Dashboard for Binary Options (MT4) . You can use any of the BOA Signals Indicators with the dashboard. Just change the BOA Signals Indicator Name in the dashboard settings to the indicator you want to get signals from. For example: CHILL. BOA_BURN_Indicator_v1   Strategy :   Ana Trader Binary Options Strategy (MACD & Stochastic) BOA_COLD_Indicator_v1   Strategy :  Amalia Trader Binary Options Strategy (Keltner & Stochastic) BOA_CHILL_Indicator_
「Adjustable Fractals」 - フラクタルインジケーターの高度なバージョンで、非常に便利な取引ツールです。 ご存知のとおり、標準フラクタル mt4 インジケーターには設定がまったくありません - これはトレーダーにとって非常に不便です 調整可能なフラクタルはその問題を解決しました - 必要な設定がすべて含まれています。 インジケーターの期間を調整可能 (推奨値 - 7 以上) 価格の高値/安値からの距離を調整可能 フラクタル矢印に合わせてデザインを調整可能 // さらに優れたエキスパートアドバイザーとインジケーターはここから入手できます: https://www.mql5.com/en/users/def1380/seller // また、収益性が高く、安定していて信頼性の高いシグナル https://www.mql5.com/en/signals/1887493 に参加することも歓迎します。 当MQL5サイトのみでご提供しているオリジナル商品です。
Xmasterインジケーターの新しいより正確なバージョン。最も効果的で正確な式を得るために、世界中の200以上のトレーダーが、PCでこのインジケーターのさまざまな組み合わせの15,000以上のテストを実施しました。そしてここでは、正確なシグナルを表示し、再ペイントしない「Xmasterフォーミュラインジケーター外国為替再ペイントなし」インジケーターを紹介します。このインジケーターはまた、電子メールとプッシュによってトレーダーにシグナルを送信します。新しいティックが到着するたびに、75以上のパラメーターで市場を常に分析し、トレーダーに正確な売買シグナルを示します。また、このインディケータの助けを借りて、正しい方向で取引を開始するためにトレンドが現在どの方向に進んでいるかを確認できます。 新しい「Xmasterフォーミュラインジケーターforexno repaint」インジケーターはどのように機能し、古いバージョンと何が違うのですか? まず第一に、それは世界中のさまざまなトレーダーによって15,000回以上テストされた最も最適化された市場分析アルゴリズムです。 第二に、このインジケーター
Perfect Trade System   indicator is designed for trend and signal trading. This indicator generates trend signals.  It uses many algorithms and indicators to generate this signal. It tries to generate a signal from the points with the highest trend potential. This indicator is a complete trading product. This indicator does not need any additional indicators.  You can only trade with this indicator. The generated signals are displayed on the graphical screen.  Thanks to the alert features you ca
MegaTrends
Sivakumar Subbaiya
1 (1)
Megatrends  Indicator   Time Frame: Suitable for any time frame.  Purpose: Trend Prediction. Blue and red color indicate the buy and sell call respectively. Buy: When the blue line is originating it is opened buy call. Sell: When the Red line is origination it is opened sell call Happy trade!! this indicator is suitable for all time frame, but our recommended time frame to use 1hour and 4 hours, suitable for any chart.
FREE
Gvs Undefeated Trend   indicator is designed for trend and signal trading. This indicator generates trend signals.  It uses many algorithms and indicators to generate this signal. It tries to generate a signal from the points with the highest trend potential. This indicator is a complete trading product. This indicator does not need any additional indicators.  You can only trade with this indicator. The generated signals are displayed on the graphical screen.  Thanks to the alert features you ca
This indicator is another variant of the famous powerful indicator Fibonacci-SS https://www.mql5.com/en/market/product/10136 but has different behaviour in placing Pending Order and TP Line. Automatically places Fibonacci retracement lines from the last highest and lowest visible bars on the chart with: An auto Pending Order (Buy/Sell). Taking Profit 1, Taking Profit 2 is pivot point and Taking Profit 3 for extended reward opportunity. The best risk and reward ratio. Simple and powerful indica
Gartley Projection D
Oleksandr Medviediev
3.71 (7)
このインジケーターは、H.M.Gartley (「株式市場の利益」、1935 年) の開発に従って調和パターン (XABCD) を識別します。 D 点を透視投影の点として投影します (設定で ProjectionD_Mode = true を指定します)。 再描画はしません。 作業時間枠のバーが閉じるとき、特定されたパターン ポイントが Patterns_Fractal_Bars バーの間に移動していない場合、チャート上に (予想される価格変動の方向に) 矢印が表示されます。 この瞬間から、矢印はチャート上に永久に残ります。 連続した 2 ~ 3 つ以上の矢印 - これは市場状況の変化であり、再描画/再描画ではありません (時間枠を前後に切り替えてはなりません)。 注: 2 ~ 3 つ以上の矢印が連続している場合 - これは市況の変化であり、再描画ではありません。 パターンの総数は 85 です (Gartley-222 と Gartley-222WS を含む。完全なリストはコメント セクションにあります)。 識別されたすべてのパターンのうち、最後に識別されたパター
PZ Penta O MT4
PZ TRADING SLU
2.25 (4)
The Penta-O is a 6-point retracement harmonacci pattern which usually precedes big market movements. Penta-O patterns can expand and repaint quite a bit. To make things easier this indicator implements a twist: it waits for a donchian breakout in the right direction before signaling the trade. The end result is an otherwise repainting indicator with a very reliable trading signal. The donchian breakout period is entered as an input. [ Installation Guide | Update Guide | Troubleshooting | FAQ | A
FREE
このプロダクトを購入した人は以下も購入しています
Gann Made Easy は、ミスター・ギャンの理論を使用した取引の最良の原則に基づいた、プロフェッショナルで使いやすい外国為替取引システムです。 W・D・ガン。このインジケーターは、ストップロスとテイクプロフィットレベルを含む正確な買いと売りのシグナルを提供します。 PUSH通知を利用して外出先でも取引可能です。 購入後はご連絡ください!私の取引のヒントと素晴らしいボーナスインジケーターを無料で共有します! おそらく、ギャンの取引手法についてはすでに何度も聞いたことがあるでしょう。通常、ギャンの理論は初心者のトレーダーだけでなく、すでにある程度の取引経験がある人にとっても非常に複雑なものです。なぜなら、ギャンの取引手法は理論的にはそれほど簡単に適用できるものではないからです。私はその知識を磨き、最良の原則を私の外国為替インジケーターに組み込むために数年を費やしました。 このインジケーターは非常に簡単に適用できます。必要なのは、それをチャートに添付し、簡単な取引推奨事項に従うだけです。このインジケーターは常に市場分析の仕事を行い、取引の機会を探します。適切なエントリーポイントを検出
Reversal First Impulse levels (RFI)    INSTRUCTIONS        RUS       -       ENG              R ecommended to use with an indicator   -   TREND PRO -  Version MT5 A key element in trading is zones or levels from which decisions to buy or sell a trading instrument are made. Despite attempts by major players to conceal their presence in the market, they inevitably leave traces. Our task was to learn how to identify these traces and interpret them correctly. Main functions: Displaying active zones
まず第一に、この取引インジケーターは再描画されず、再描画されず、遅延しないことを強調する価値があります。これにより、手動取引とロボット取引の両方に理想的なものになります。 ユーザーマニュアル:設定、入力、戦略。 アトミックアナリストは、価格の強さとモメンタムを利用して市場でより良いエッジを見つけるためのPA価格アクションインジケーターです。ノイズや誤ったシグナルを除去し、取引ポテンシャルを高めるための高度なフィルターを備えています。複雑なインジケーターの複数のレイヤーを使用して、アトミックアナリストはチャートをスキャンし、複雑な数学的計算をシンプルなシグナルと色に変換します。これにより、どのような初心者トレーダーでも理解して使用し、一貫した取引の決定を行うことができます。 「アトミックアナリスト」は、新規および経験豊富なトレーダー向けにカスタマイズされた包括的な取引ソリューションです。プレミアムインジケーターとトップノッチの機能を1つの取引戦略に組み合わせ、すべてのタイプのトレーダーにとって汎用性のある選択肢にします。 デイリートレーディングとスキャルピング戦略:高
現在26%オフ 初心者やエキスパートトレーダーに最適なソリューション! このインジケーターは、独自の機能と新しい計算式を取り入れた、ユニークで高品質、かつ手頃な価格のトレーディングツールです。たった1枚のチャートで28の為替ペアの通貨強度を読み取ることができます。新しいトレンドやスキャルピングチャンスの引き金となるポイントを正確に特定することができるので、あなたのトレードがどのように改善されるか想像してみてください。 ユーザーマニュアルはこちら  https://www.mql5.com/en/blogs/post/697384 これが最初の1本、オリジナルだ! 価値のないクローンを買わないでください。 特別な サブウィンドウの矢印で強い通貨の勢いを表示 GAPがあなたのトレードを導く! 基準通貨や気配値が売られすぎ・買われすぎのゾーン(外相フィボナッチレベル)にあるとき、個別チャートのメインウィンドウに警告表示。 通貨がレンジの外側から反落した場合、プルバック/リバーサルのアラート。 クロスパターンの特別なアラート 複数の時間枠を選択可能で、トレンドを素早く
Trend Punch
Mohamed Hassan
5 (14)
Manual guide:   Click here WEEKEND SALE PROMO:   $65 ONLY!  -- Next price is  $120 .  This indicator is unstoppable when combined with our other indicator called  Support & Resistance . After purchase, send us a message and you will get it   for  FREE as a BONUS! I like to use Trend Punch on XAUUSD on the M1 timeframe & higher ones!  Introducing Trend Punch , the revolutionary forex trend indicator that will transform the way you trade! Trend Punch is uniquely designed to provide
An exclusive indicator that utilizes an innovative algorithm to swiftly and accurately determine the market trend. The indicator automatically calculates opening, closing, and profit levels, providing detailed trading statistics. With these features, you can choose the most appropriate trading instrument for the current market conditions. Additionally, you can easily integrate your own arrow indicators into Scalper Inside Pro to quickly evaluate their statistics and profitability. Scalper Inside
Gold Stuff
Vasiliy Strukov
4.89 (262)
Gold Stuff は、金専用に設計されたトレンド指標であり、あらゆる金融商品にも使用できます。 インジケーターは再描画せず、遅れません。 推奨時間枠 H1. それインディケータでフルオートExpert Advisor EA Gold Stuffが動作します。 あなたは私のプロフィールでそれを見つけることができます. 設定と個人的なボーナスを得るために、購入後すぐに私に連絡してください! トレンド スキャナーの強力なサポートを利用して、無料のインジケーターを入手し、プライバシーを守ります。あーみー!   設定 矢印を描く - オンオフ。 チャートに矢印を描く。 アラート - 可聴アラートのオンオフ。 メール通知 - オンオフ。 電子メール通知。 プチ通知 - オンオフ。 プッシュ通知。 次に、色域を調整します。 Gold Stuff は、金専用に設計されたトレンド指標であり、あらゆる金融商品にも使用できます。 インジケーターは再描画せず、遅れません。 推奨時間枠 H1. それインディケータでフルオートExpert Advisor EA Gold Stuff
TPSpro TRENDPRO  - is a trend indicator that automatically analyzes the market and provides information about the trend and each of its changes, as well as giving signals for entering trades without redrawing! The indicator uses each candle, analyzing them separately. referring to different impulses - up or down impulse. Exact entry points into transactions for currencies, crypto, metals, stocks, indices!  -  Version MT5               DETAILED DESCRIPTION                R ecommended to use with
Legacy of Gann
Pavel Zamoshnikov
4.83 (12)
The indicator very accurately determines the levels of the possible end of the trend and profit fixing. The method of determining levels is based on the ideas of W.D.Gann, using an algorithm developed by his follower Kirill Borovsky. Extremely high reliability of reaching levels (according to K. Borovsky  - 80-90%) Indispensable for any trading strategy – every trader needs to determine the exit point from the market! Precisely determines targets on any timeframes and any instruments (forex, met
Advanced Supply Demand
Bernhard Schweigert
4.92 (313)
現在33%オフ 初心者にもエキスパートトレーダーにも最適なソリューション このインジケーターは独自の機能と新しい公式を多数内蔵しており、ユニークで高品質かつ手頃な取引ツールです。このアップデートでは、2つの時間枠ゾーンを表示できるようになります。より長いTFだけでなく、チャートTFとより長いTF(ネストゾーンを表示)の両方を表示できます。すべてのSupply Demandトレーダーの皆さんのお気に召すはずです。:) 重要情報の公開 Advanced Supply Demandの可能性を最大化するには、 https://www.mql5.com/ja/blogs/post/720245 にアクセスしてください。   エントリーまたはターゲットの正確なトリガーポイントを正確に特定できれば取引がどのように改善されるか想像してみてください。新しい基盤となるアルゴリズムに基づいて構築されているため、買い手と売り手の間の潜在的な不均衡をさらに簡単に特定できます。これは、最も強い需要と供給のゾーンと、過去のパフォーマンス(古いゾーンを表示)がグラフィカルに表現されるためです。これらの機能は、最適
現在20%OFF! 初心者やエキスパートトレーダーのためのベストソリューション! このダッシュボードソフトウェアは、28の通貨ペアで動作しています。それは私達の主要な指標(高度な通貨の強さ28と高度な通貨インパルス)の2に基づいています。それは全体の外国為替市場の大きい概観を与えます。それは、すべての(9)時間枠で28の外国為替ペアのための高度な通貨の強さの値、通貨の動きの速度と信号を示しています。チャート上で1つのインディケータを使用して市場全体を観察し、トレンドやスキャルピングの機会をピンポイントで見つけることができたら、あなたのトレードがどのように改善されるか想像してみてください。 このインディケータには、強い通貨と弱い通貨の識別、潜在的な取引の識別と確認がより簡単になるような機能が搭載されています。このインディケータは、通貨の強さや弱さが増加しているか減少しているか、また、すべての時間枠でどのように機能しているかをグラフィカルに表示します。 新機能として、現在の市場環境の変化に適応するダイナミックなマーケットフィボナッチレベルが追加され、すでに当社のAdvan
FX Volume
Daniel Stein
4.6 (35)
mql5と Telegramの モーニング・ブリーフィングで、詳細とスクリーンショットを含む毎日のマーケット・アップデートをご覧 ください! FX Volumeは、ブローカーの視点から市場のセンチメントをリアルに洞察する、最初で唯一の出来高インジケーターです。 ブローカーのような機関投資家が外国為替市場でどのようなポジションをとっているか、COTレポートよりもはるかに速く、素晴らしい洞察を提供します。 この情報をチャート上で直接見ることは、あなたの取引にとって真のゲームチェンジャーであり、画期的なソリューションです。 以下のようなユニークなマーケットデータ洞察から利益を得てください。 比率は 、通貨のロングポジションとショートポジションの比率をパーセントで表示します。 比率の変化は 、選択した期間内のロング比率とその変化率を表示します。 Volumes Totalは 、通貨の取引量(ロングとショート)の合計をロット単位で表示します。 Volumes Long :全通貨のロングポジションの取引量を表示します。 Volumes(ショート )は、全通貨のショートポジションの取引量を表示
Enigmera
Ivan Stefanov
5 (3)
エニグメラ:市場の中核 https://www.enigmera.com はじめに このインディケータと取引システムは、金融市場に対する驚くべきアプローチです。ENIGMERAは、フラクタルサイクルを使用して、サポートとレジスタンスレベルを正確に計算します。本格的な蓄積局面を示し、方向性と目標を示します。 トレンド中でも調整中でも機能するシステムです。 どのように作動するのか? ENIGMERAは、支持線・抵抗線、目標線、乖離線の3つのラインで構成されています。このシステムは、過去のデータを現在と未来に外挿する典型的な市場指標とは異なり、現在の完全な画像を提供します。支持線上にある場合、それは本当の支持を意味し、抵抗線上にある場合、それは本当の抵抗を意味する。ある水準が破られた場合、それはトレンドの変化を意味する。再描画はしない。 市場は常に進化しているため、ENIGMERAはその評価ツールを適応させ、定期的に戦略を修正しています。  これにより、すべてのシナリオが徹底的に評価されることが保証されます。この市場指標の独自性は、その能力を見れば明らかです。  ENIGM
mql5と Telegramの モーニング・ブリーフィングで、詳細とスクリーンショットを含む毎日のマーケット・アップデートをご覧 ください! FX Power MT4 NGは 、長年の人気を誇る通貨強度計FX Powerの次世代モデルです。 この次世代ストレングスメーターは何を提供するのでしょうか?初代FXパワーの魅力すべて プラス GOLD/XAUの強さ分析 より正確な計算結果 個別に設定可能な分析期間 カスタマイズ可能な計算上限値により、さらに優れたパフォーマンスを実現 もっと見たい人のための特別なマルチインスタンス設定 すべてのチャートでお好みの色を無限に設定可能 数え切れないほどの通知オプションにより、重要なことを見逃すことはありません。 Windows 11とmacOSのスタイルで角を丸くした新しいデザイン 魔法のように動くインジケーターパネル FXパワーの主な機能 すべての主要通貨の強さの完全な履歴 すべての時間枠における通貨の強さの履歴 すべてのブローカーとチャートで同一の計算結果 100%信頼できるリアルタイム計算 -> リペイントなし ドロップダウン・リストから
PRO Renko Systemは、特別にRENKOチャートを取引するために設計された高精度の取引システムです。 これは、様々な取引商品に適用することができる普遍的なシステムです。 システムは効果的に正確な逆転信号へのアクセスを与えるいわゆる市場の騒音を中和する。 表示器は非常に使いやすく、信号の生成に責任がある1つの変数だけがあります。 あなたは簡単にお好みの任意の取引ツールとレンコバーのサイズにツールを適応させることができます。 私はいつもあなたが私のソフトウェアで収益性の高い取引を支援するために余分なサポートを提供する準備ができています! 私はあなたに幸せで収益性の高い取引をしたいです! ご購入後にご連絡ください! 私はあなたに私のレンコチャートジェネレータを送信します。 私はまた、私の個人的な推奨事項やシステムの他のモジュールを無料で共有します!
Trend Screener
STE S.S.COMPANY
4.83 (88)
トレンドインジケーター、1つのツールに組み込まれたすべての重要なトレンド機能を備えたトレンドトレーディングとフィルタリングのための画期的なユニークなソリューション! これは、すべてのシンボル/商品(外国為替、商品、暗号通貨、インデックス、株式)で使用できる100%再描画されていないマルチタイムフレームおよびマルチ通貨インジケーターです。 トレンドスクリーナーは、チャート内のドットで矢印トレンドシグナルを提供するインジケーターに続く効率的なインジケーターです。 トレンド分析インジケーターで使用できる機能: 1.トレンドスキャナー。 2.最大利益分析を備えたトレンドライン。 3.トレンド通貨強度メーター。 4.アラート付きのトレンド反転ドット。 5.アラート付きの強いトレンドドット。 6.トレンド矢印 毎日の分析例、毎日のシグナルパフォーマンス...など、トレンドスクリーナーインジケーターを使用して、ここで見つけることができます: ここをクリックしてください 期間限定オファー:トレンドスクリーナーインジケーターは、50ドルと生涯でのみご利用いただけます。 (元の価格125 $) MQ
市場の2つの基本原則に基づく日中戦略。 このアルゴリズムは、追加のフィルターを使用したボリュームと価格の波の分析に基づいています。インディケータのインテリジェントアルゴリズムは、2つの市場要因が1つに結合した場合にのみシグナルを出します。インディケータは、より高い時間枠のデータを使用して、M1チャート上の特定の範囲の波を計算します。そして波を確認するために、インジケーターはボリュームによる分析を使用します。 このインディケータはレディトレーディングシステムです。トレーダーが必要とするのは、信号に従うことだけです。また、インジケーターはあなた自身の取引システムの基礎になることができます。取引はミニッツチャートでのみ行われます。 インジケーターがMTFの原則を使用しているという事実にもかかわらず、インジケーターのアルゴリズムは可能な限り安定しています。 購入後、必ず私に書いてください!私の取引設定と推奨事項をあなたと共有します!
通貨強さウィザードは、取引を成功させるためのオールインワン ソリューションを提供する非常に強力な指標です。このインジケーターは、複数の時間枠のすべての通貨のデータを使用して、このまたはその外国為替ペアのパワーを計算します。このデータは、使いやすい通貨インデックスと通貨パワーラインの形式で表され、特定の通貨のパワーを確認するために使用できます。 必要なのは、取引したいチャートにインジケーターを接続することだけです。インジケーターは、取引する通貨の実際の強さを示します。このインジケーターは、トレンドに合わせて取引するときに有利に利用できる売買高の圧力の極値も示します。このインジケーターには、フィボナッチに基づく可能なターゲットも表示されます。 このインジケーターは、PUSH 通知を含むあらゆるタイプのアラートを提供します。 購入後ご連絡下さい。私の取引のヒントをあなたと共有し、素晴らしいボーナスインジケーターを無料で提供します! 幸せで有益な取引をお祈りします。
ご紹介   クォンタム トレンド スナイパー インジケーターは 、トレンド反転を特定して取引する方法を変革する画期的な MQL5 インジケーターです。 13年以上の取引経験を持つ経験豊富なトレーダーのチームによって開発されました。     クォンタムトレンドスナイパーインジケーター   は、非常に高い精度でトレンドの反転を識別する革新的な方法で、あなたのトレーディングの旅を新たな高みに押し上げるように設計されています。 ***Quantum Trend Sniper Indicatorを購入すると、Quantum Breakout Indicatorを無料で入手できます!*** クォンタム ブレイクアウト インジケーターは、トレンドの反転を特定するとアラートを発し、矢印を示し、3 つのテイクプロフィットレベルを提案します。 初心者トレーダーにもプロのトレーダーにも適しています。 量子EAチャネル:       ここをクリック MT5のバージョン:       ここをクリック 推奨事項: 期間: すべての時間枠。最良の結果を得るには、
このインディケータは、当社の2つの製品 Advanced Currency IMPULSE with ALERT  +   Currency Strength Exotics . のスーパーコンビネーションです。 このインジケーターは全ての時間枠で作動し、8つの主要通貨と1つのシンボルの強弱のインパルスをグラフで表示します。 このインジケータは、金、エキゾチックペア、商品、インデックス、先物など、あらゆるシンボルの通貨強度の加速度を表示することに特化されています。金、銀、原油、DAX、US30、MXN、TRY、CNHなどの通貨強度の加速度(インパルスまたは速度)を表示するために、任意のシンボルを9行目に追加できる、この種の最初のものです。 新しいアルゴリズムに基づいて構築され、潜在的な取引の特定と確認がさらに容易になりました。これは、通貨の強さや弱さが加速しているかどうかをグラフィカルに表示し、その加速の速度を測定するためです。加速すると物事は明らかに速く進みますが、これはFX市場でも同じです。つまり、反対方向に加速している通貨をペアリングすれば、潜在的に利益を生む取
もちろんです。以下は、提供いただいたテキストの日本語への翻訳です: MT4用の天文学指標をご紹介します:究極の天体トレーディングコンパニオン トレーディング体験を天空の高みに高める準備はできていますか?私たちの革命的なMT4用の天文学指標をご紹介します。この革新的なツールは、複雑なアルゴリズムの力を借りて、類まれなる天文学的洞察と精密な計算を提供します。 あなたの指先で宇宙の情報を: 宝のような天文学的データが明らかになる包括的なパネルをご覧ください。惑星の地理的/太陽中心座標、太陽と地球の距離、星の大きさ、伸び、星座、黄道座標および赤道座標、さらには水平座標まで、それぞれが綿密に計算され美しく表示されています。指標によって生成される垂直線は時間値に対応し、トレーディングの旅に宇宙の視点を提供します。 惑星のラインと関係: グラフを飾る惑星のラインの魔法を体験し、スケールと角度をカスタマイズできます。直感的なコントロールパネルを介して各惑星のラインの表示を簡単に切り替えることができます。指定された時刻範囲内での合会、六分会、四分会、三分会、対会、逆行の指標で天体の関係の芸術を発見してく
Please send me Direct message on MQL5 CHAT after purchasing the Indicator for Training and Installation Support There are some additional files that is important to use with the Indicator . So be sure to contact me after purchasing the Indicator So that I can add you for training and support . If you find any difficulty with installation then send me Direct message here So that I can connect with you via Anydesk or Teamview for the product installation. " Smart Order Block Indicator " to find
ICT, SMC, SMART MONEY CONCEPTS, SMART MONEY, Smart Money Concept, Support and Resistance, Trend Analysis, Price Action, Market Structure, Order Blocks, BOS/CHoCH,   Breaker Blocks ,  Momentum Shift,   Supply&Demand Zone/Order Blocks , Strong Imbalance, HH/LL/HL/LH,    Fair Value Gap, FVG,  Premium  &   Discount   Zones, Fibonacci Retracement, OTE, Buy Side Liquidity, Sell Side Liquidity, BSL/SSL Taken, Equal Highs & Lows, MTF Dashboard, Multiple Time Frame, BigBar, HTF OB, HTF Market Structure, 
まず第一に、この取引ツールはノンリペイント、ノンリドロー、ノンラグの指標であり、プロの取引に理想的ですことを強調する価値があります。 オンラインコース、ユーザーマニュアル、デモ。 スマートプライスアクションコンセプトインジケーターは、新米から経験豊富なトレーダーまで、非常 に強力なツールです。Inner Circle Trader AnalysisやSmart Money Concepts Trading Strategiesなど、20以上の有用な指標を1つに組み合わせています。このインジケーターはスマートマネーコンセプトに焦点を当て、大手機関の取引方法を提供し、彼らの動きを予測するのに役立ちます。 特に、流動性分析に優れており、機関がどのように取引しているかを理解しやすくしています。市場のトレンドを予測し、価格の動きを慎重に分析するのに優れています。機関の戦略とトレードを合わせることで、市場の動向についてより正確な予測ができます。このインジケーターは多目的であり、市場構造を分析し、重要な注文ブロックを特定し、さまざまなパターンを認識するのに優れています。 このインジケー
カスタムMT4インジケーターで外国為替取引を成功させるための秘密を発見してください! 外国為替市場で成功を達成し、リスクを最小限に抑えながら一貫して利益を得る方法を疑問に思ったことはありますか? これがあなたが探している答えです! 取引へのアプローチに革命をもたらす独自のMT4インジケーターを導入できるようにします。 ユニークな汎用性 私たちのインジケータは、RenkoとRangeBarのろうそくのフォーメーションを好むユーザー向けに特別に設計されています。 これらのチャートタイプは多くの経験豊富なトレーダーに好まれていることを理解しています。そのため、私たちのインジケーターはそれらとシームレスに統合され、比類のない市場分析を提供します。 クリアトレンドシグナル 複雑な分析を忘れてください! 私たちのインジケーターは、鮮やかな色と明確なドット構造を利用して、市場の動向を明確に示しています。 赤と青の点は、価格の動きの方向性について疑いの余地がなく、取引の迅速な意思決定を可能にします。 HH/HL HL/LL戦略とのアライメント HH/HLおよびHL/LL構
現在20%OFF! 初心者やエキスパートトレーダーに最適なソリューションです。 このインディケータは、エキゾチックペア・コモディティ・インデックス・先物など、あらゆるシンボルの通貨の強さを表示することに特化したインディケータです。金、銀、原油、DAX、US30、MXN、TRY、CNHなどの通貨の強さを表示するために、9行目にどのシンボルでも追加することができます。独自の機能を多数搭載し、新しい計算式を採用したため、ユニークで高品質、かつ手頃な価格のトレーディングツールとなっています。新しいトレンドやスキャルピングチャンスのトリガーポイントを正確に把握することができるため、あなたのトレードがどのように改善されるか想像してみてください。 ユーザーマニュアル:ここをクリック   https://www.mql5.com/en/blogs/post/708876 すべての時間枠に対応します。あなたはすぐにトレンドを見ることができるようになります! 新しいアルゴリズムに基づいて設計されているため、潜在的な取引の特定と確認がより簡単になります。これは、8つの主要通貨と1つのシンボ
TakePropips Donchian Trend Pro
Eric John Pajarillaga Aldana
4.82 (17)
TakePropips Donchian Trend Pro   (MT4) は、ドンチャン チャネルを使用してトレンドの方向を自動的に検出し、エントリーとエグジットの取引シグナルを提供する強力で効果的なツールです! この多機能インジケーターには、トレンド スキャナー、取引シグナル、統計パネル、スクリーナー、取引セッション、およびアラート履歴ダッシュボードが含まれます。取引シグナルを提供し、チャートを分析する時間を節約するように設計されています! ユーザー マニュアルとインストール ガイドは、ブログ投稿 (   https://www.mql5.com/en/blogs/post/751368   ) からダウンロードできます。 今日は 50% オフ! 98ドルから49ドルに値下げ! このインジケーターは、ストラテジー テスターでテストできます (ビジュアル モードを有効にします)。 詳細については、説明の下にあるビデオ チュートリアルも利用できます。 ご不明な点やサポートが必要な場合は、私に連絡してください。 TakePropips Donchian Trend Pro イン
ECM Elite Channel is a volatility-based indicator, developed with a specific time algorithm, which consists of finding possible corrections in the market. This indicator shows two outer lines, an inner line (retracement line) and an arrow sign, where the channel theory is to help identify overbought and oversold conditions in the market. The market price will generally fall between the boundaries of the channel. If prices touch or move outside the channel, it's a trading opportunity. The
TrendDecoder Premium
Christophe Pa Trouillas
5 (6)
レンジと次の動きを特定    |  トレンドの最も早いシグナルと強さを得る   |  反転の前に明確な出口を得る   |  価格がテストするフィボ・レベルを見つける。 非リペイント、非遅延インディケータ - マニュアルおよび自動売買に最適 - すべての資産、すべての時間単位に対応 期間限定キャンペーン   >> 50%OFF 購入後、 推奨セッティングについては、このチャンネルで私に連絡してください。 MT5 バージョン: ここをクリック BladeSCALPER   と   PowerZONES   を使った完全な方法を入手する どのようなものですか? TrendDECODERは、トレンド監視をシンプルかつ簡単にするための複数のイノベーションを集約したものです。 Projective TrendLine (投影トレンドライン) - 今後のトレンドのスピードリファレンス。 RealTime TrendLine vs. Projective TrendLine (リアルタイムトレンドライン vs. Projective TrendLine) - 市場が同じ方
Indicator : RealValueIndicator Description : RealValueIndicator is a powerful tool designed specifically for trading on the EURUSD pair. This indicator analyzes all EUR and USD pairs, calculates their real currency strength values, and displays them as a single realistic value to give you a head start on price. This indicator will tell you moves before they happen if you use it right. RealValueIndicator allows you to get a quick and accurate overview of the EURUSD currency pair tops and bottoms,
作者のその他のプロダクト
Volume Profile is an advanced charting study that displays trading activity over a specified time period at specified price levels. The study (accounting for user defined parameters such as number of rows and time period) plots a histogram on the chart meant to reveal dominant and/or significant price levels based on volume. Essentially, Volume Profile takes the total volume traded at a specific price level during the specified time period and divides the total volume into either buy volume or s
Ichimoku Kinko Hyo is a purpose-built trend trading charting system that has been successfully used in nearly every tradable market. It is unique in many ways, but its primary strength is its use of multiple data points to give the trader a deeper, more comprehensive view into price action. This deeper view, and the fact that Ichimoku is a very visual system, enables the trader to quickly discern and filter "at a glance" the low-probability trading setups from those of higher probability. This i
FREE
A form of technical analysis based on the ideas that the market is geometric and cyclical in nature. A Gann Fan consists of a series of diagonal lines called Gann angles, of which there are nine. These angles are superimposed over a price chart to show a security's support and resistance levels. The resulting image is supposed to help technical analysts predict price changes. Although once drawn by hand, today Gann Fans can be drawn with software programs. This indicator draws Gann Fan based on
This indicator was built based on Moving Average, but it always reset counter at the first bar of day/week/month. Simple arrow signal to show buy/sell signal. 3 lines of moving average can be used as price channel, this is market trend also. time_zone option allows choosing time for trading and session movement analysis.
Manual Panel
Hoang Ngoc Thach
5 (2)
I like trading manually, so I created this tool to make my trade more easier and faster. Features Money management. Click for place order ( Buy/Sell/BuyStop/BuyLimit/SellStop/SellLimit). Many buttons for control your account (Close All, Remove Pendings, Breakeven, Hedging). Auto hide if not use for 2 minutes. See profit on current symbol. Free to move panel to where you want. Save your settings for using on next time. Special: It's work on backtest mode! You can use this for training yourself.
This indicator helps to find high/low points. This is not perfect trend indicator, because sometime it shows anti-market trend. But it never misses highest and lowest price in history. So that, the rules for entry are: Sell with downtrend (red line), Buy with uptrend (blue line). Yellow arrows for Sell, but it should be confirmed by downtrend. Aqua arrows for Buy, but it should be confirmed by uptrend.
NoFear
Hoang Ngoc Thach
5 (1)
NoFear indicator is based on Advanced Moving Average. It is used in technical chart analysis providing signals whenever a rate change appears that exceeds the upper or lower border. The indicator works very well on trend market. It is easy to find good entry points by blue/violet arrows. The upper and lower bands should be used like support/resistance levels and stop/exit points. All signals do not repaint, and can be used immediately when they are coming. This means we do not need to wait for a
The idea for indicator is using multi-SuperTrend line to define market trend and Multi Moving Average line to find good entry point. The signal doesn't repaint, wait until the bar closed to make sure the signal is confirmed. Lowest RoyalBlue line is used for Buy stoploss. Highest Magenta line is used for Sell stoploss. Indicator supports alert when signal is coming (sends email, push notifications, sound alert). High Timeframe is better for using. Indicator parameters: CountBars = 500 — How m
CCI Exit
Hoang Ngoc Thach
5 (1)
This is a great indicator to find an exit point. We never know when the market is going to change its trend. Many indicators give you a good entry point, but not good to use opposite signal as an exit point, because the signal always comes too late. This indicator will protect your profit as soon as possible when a signal to exit is found! Don't use this signal to enter, it may not be good for making an entry. The signal doesn't repaint, wait until a bar closes to make sure it is confirmed. Indi
Trend Trade indicator is based on ADX indicator to define long/medium/short trend and good entry signals. The product supports virtual trade on chart to show where/when should we make an entry/exit. It works very well on D1 or above. The indicator is efficient on GOLD and CFDs. Alert_Settings = "+++++++++++++++++++++++" SendMailMode = true - Send email SendNotificationMode = true - Send notification to your phone AlertMode = true - Sound alert Show_Virtual_Trades = true - Show virtual trades Sin
i-Regression Channel generates regression channel: Linear regression channel consists of two parallel lines located at the equal distance from the linear regression trend line. The distance between the channel borders and the regression line is equal to the value of the highest close price deviation from the regression line. degree - degree of regression, changes from 1 to 61; kstd - regression channel width; bars - the number of bars for the channel calculation; shift - the channel horizontal s
The indicator is based on Moving Average to define the trend, then it finds a good entry point and follows the trend. We will keep open on a new signal until the trend is changed, and all trades exit on an opposite signal. The exit point is a bit late relative to the highest profitable point (at top/bottom), but it is the best point to exit your trades. Keep the trades, which are moving the right direction to get a high profit, and stop wrong trades as soon as possible when the trend is changed
The indicator compares Fractal and Zigzag indicators to define hard Support and Resistance. The arrow signal appears when a new support or resistance emerges or when the price breaks through Support and Resistance zone. This indicator is efficient in conjunction with a rebound and breakout strategy. It works well on H4 and D1 for all pairs. Settings BarCounts = 200; FastPeriod = 7 - fast period SlowPeriod = 14 - slow period Show_SR = true - show support/resistance Show_Arrows = true - show up/
Using high-volatility channel breakout-style trading systems has historically worked well across major currency pairs, show promise in determining the opportune time to trade the channel breakout trading strategy. This Breakout Strategy may look simple, but it is good follow trade trader strategy. Setting: Channel Periods: default 20 BarsCount: bars count in history Alert_Settings = "+++++++++++++++++++++++" SendMailMode = true - Send email SendNotificationMode = true - Send notification to yo
Reversal Breakout is a real breakout strategy. It is based on Moving Average indicator to define market trend and breakout points. Try to entry when price reverse is not good, because there are many false reversal signal, so that it is better to trade breakout at reverse point. This EA will work for all Timeframe, but I prefer to use it on H1 or above. Should use it on major pairs which are lowest Spread, and lowest Slippage: EURUSD,GBPUSD,USDJPY,GOLD,... No martingale No Grid Always use Stoplos
The indicator uses 2 Moving Average: 1 fast EMA and 1 slow EMA to define trend, reversal signal and breakout point. Reversal Signal comes on open time, it can be used as scalping signal for short time, but be careful with this signal because it may be an anti-trend signal, the indicator tries to catch reverse point. Breakout signal is where support or resistance was broken out, the reversal signal has failed. Breakout signal is stronger than the Reversal Signal. We can use support/resistance lev
ATeam Sonic Hope ATeam Sonic Hope is a fully automated Expert Advisor with no use of martingale, sometime EA open more trade with new signal and exit all trade with overall profit. Some ocillators indicator were used to generate signal and use Higher Timeframe as maintrend to entry. Real operation monitoring as well as my other products can be found here: https://www.mql5.com/en/users/rockyhoangdn/seller General Recommendations The minimum deposit is 100 USD,  Recomend low spread pair like :
The CCI Divergence is a reasonably useful indicator in itself, but it is even more effective when used with divergence pattern trading. The CCI Divergence indicator signal is one of the most potent signals among the indicators that exist in the market. Here is new version for Divergence Indicator using CCI method, with more improvements. Divergences indicate a potential investment point because the directional moment does not confirm the price. A bullish divergence occurs when the underlying
This is best control panel for trader who trade with Supply and Demand Zone. Easy to calculate entry lotsize by %risk/money risk/money target/fixed lot And support Half-Kelly feature: calculate the best Risk percentage for each trade follow Kelly criterion . Auto Change chart feature Exposure and Position manager Currencies Strength Meter And more features waiting you
If you have been anywhere near Forex forums or social media lately, you have no doubt been hearing people talk about   Smart Money Concepts (SMC)   trading. You may be wondering what SMC is, and whether it deserves all the hype. In this post, we will introduce Smart Money Concepts trading to you so you can make an informed decision about whether or not to give this strategy a try in your own trading. What is SMC Forex trading? Smart Money Concepts (SMC) is one of many forex trading methods. SMC
Ichimoku Kinko Hyo is a purpose-built trend trading charting system that has been successfully used in nearly every tradable market. It is unique in many ways, but its primary strength is its use of multiple data points to give the trader a deeper, more comprehensive view into price action. This deeper view, and the fact that Ichimoku is a very visual system, enables the trader to quickly discern and filter "at a glance" the low-probability trading setups from those of higher probability. This i
We try to detect long/medium/short-term trends and combine all of them with some price action patterns to find a good entry point. The Indicator benefits are: Can detect long/medium/short-term trends. Can detect resistances/supports level (like pivot levels). Shows entry point/time using colored arrows Multitimeframe mode is available.
This indicator is the same as the popular Heiken Ashi Smoothed. The Heikin Ashi indicator for MetaTrader 5 already exists, but it has two disadvantages: It paints the candles not accurate. It's not possible to change the candle width. See also Heikin Ashi in MQL5 Code Base . In this version there are no such disadvantages.
Any financial instrument that is traded on the market is a position of some active towards some currency. Forex differs from other markets only in the fact, that another currency is used as an active. As a result in the Forex market we always deal with the correlation of two currencies, called currency pairs. The project that started more than a year ago, helped to develop a group of indicators under a joint name cluster indicators. Their task was to divide currency pairs into separate currenci
This indicator is a copy of the Gann Hi-Lo Activator SSL indicator which was rewritten in MQL5. The original indicator was one-colored, that is why for more visual definition of the trend direction it was necessary to make it colored. This version is Mutitimefame, now you can see multi-trends in a separate window and signals in the main chart. Alert mode and sending of emails has been also added.
MTF Ichimoku is a MetaTrader 5 indicator based on well known Ichimoku. In MetaTrader 5 we have Ichimoku already included as a standard technical indicator. However it can be used only for the current timeframe. When we are looking for a trend, it is very desirable to have Ichimokuis showing higher timeframes. MTF Ichimoku presented here has additional parameter - TimeFrame. You can use it to set up higher timeframe from which Ichimokuis will calculate its values. Other basic parameters are not c
Ichimoku Kinko Hyo is a purpose-built trend trading charting system that has been successfully used in nearly every tradable market. It is unique in many ways, but its primary strength is its use of multiple data points to give the trader a deeper, more comprehensive view into price action. This deeper view, and the fact that Ichimoku is a very visual system, enables the trader to quickly discern and filter "at a glance" the low-probability trading setups from those of higher probability. This i
The Forex trading market operates 24 hours a day but the best trading times are when the major trading sessions are in play. The Sessions Moving Average indicator helps identify Tokyo, London and New York, so you know when one session starts, ends or even overlaps. This indicator also shows how session affects the price movement. Now, you can see the market trend by comparing the price with 3 Average lines or comparing 3 Average lines together.
The commodity channel index (CCI) is an oscillator originally introduced by Donald Lambert in an article published in the October 1980 issue of Commodities magazine (now known as Futures magazine). Since its introduction, the indicator has grown in popularity and is now a very common tool for traders in identifying cyclical trends not only in commodities, but also equities and currencies. The CCI can be adjusted to the timeframe of the market traded on by changing the averaging period. This indi
This is HTF (or MTF) of original Kolier SuperTrend indicator. On this version, you can use 4 Lines of supertrend to define the trend, it will be more powerful. Remade signals on smalls timeframes, the indicator will not repaint if used on small timeframes.
フィルタ:
レビューなし
レビューに返信
バージョン 2.0 2024.04.09
Update: fix bugs