Araz ETrend MT5
- インディケータ
- Mahmoud Karkeh Abadi
- バージョン: 1.0
- アクティベーション: 5
Finding the right trend is always one of the most important points of trading
If you agree with me then let's move on
- How do we recognize the trend?
As you well know, one of the best and most widely used standard indicators is the ATR.
There is no special magic
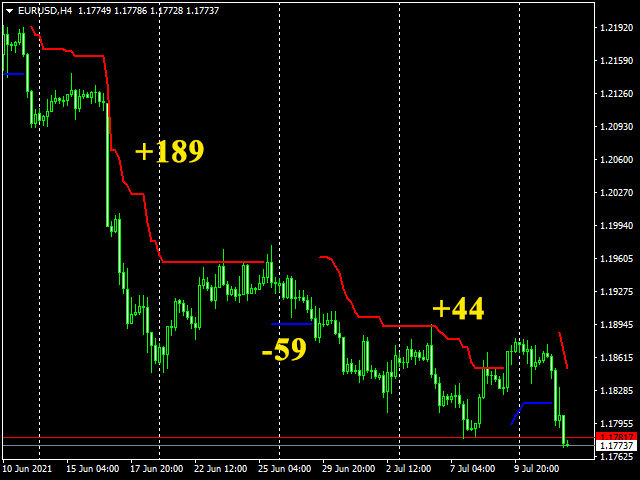
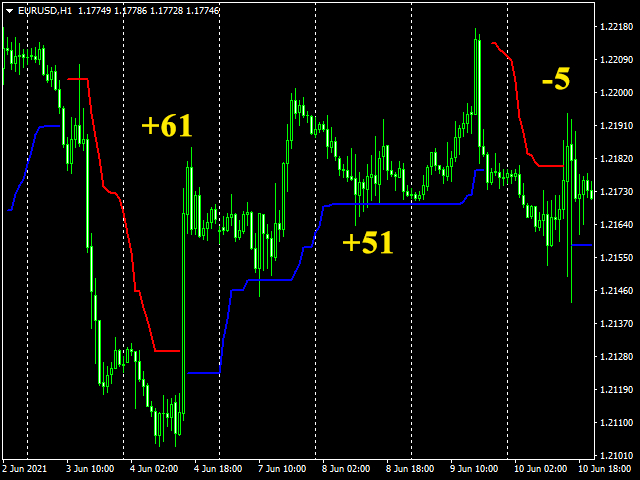
We try to identify the trend by calculating the amount of ATR and the amount of Multiplier.
You can use this indicator in all currencies and all time frames. Of course, note that the purpose of this indicator is to show the trend, not the entry and exit point.