• 概要
  • レビュー (3)
  • コメント

Elliott Wave False Breakout Stochastic

3

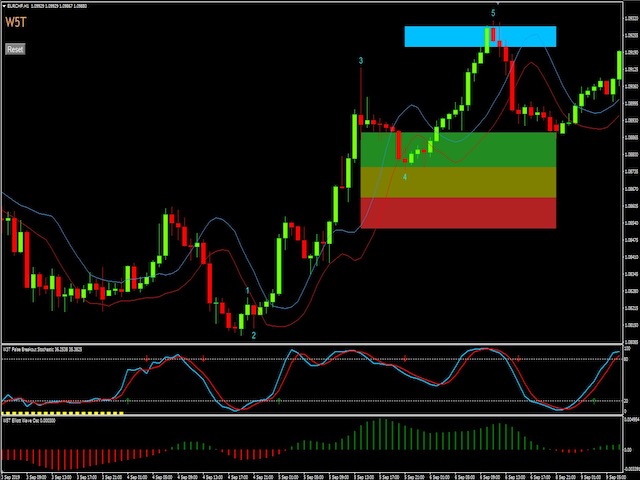
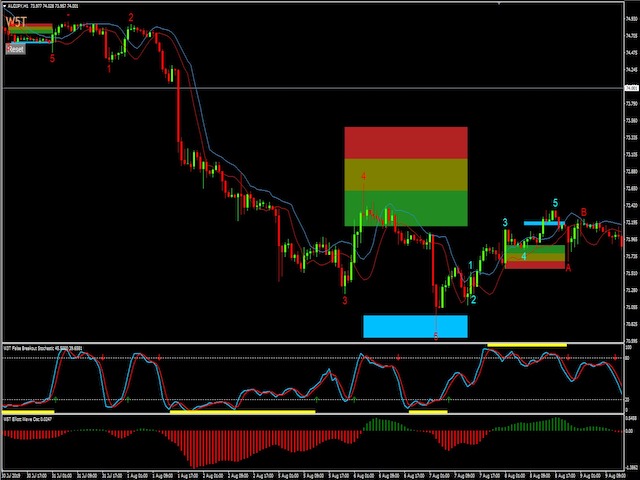
False Breakout Stochastic to be used with our Elliott Wave Indicator as part of the overall strategy on trading the 5th wave.
As we cannot upload multiple files, we have listed this separately.

False Breakout Stochastic is best used as a confirmation tool rather than the sole signal indicator

The Elliott Wave Indicator Suite is designed around a simple but effective Swing Trading Strategy.

The Indicator Suite is great for Stocks, Futures and Forex trading on multiple timeframes

You can find the main Elliott Wave Indicator here https://www.mql5.com/en/market/product/44034


レビュー 3
Aravind Kolanupaka
8925
Aravind Kolanupaka 2024.06.18 16:57 
 

Good supplement indicator than can be used as confirmation for swing trades.

John Winsome Munar
3471
John Winsome Munar 2022.06.21 03:43 
 

Good work

おすすめのプロダクト
This indicators automatically draws the Support and resistances levels for you once you've dropped it on a chart.  It reduces the hustle of drawing and redrawing these levels every time you analysis prices on a chart. With it, all you have to do is dropped it on a chart, adjust the settings to your liking and let the indicator do the rest.  But wait, it gets better; the indicator is absolutely free!  Get the new and improved version here:  https://youtu.be/rTxbPOBu3nY Parameters Time-frame  -> T
FREE
This indicator filters the Zigzag indicator to calculate the main support and resistance levels. Variables minimum gap between peaks : is the distance (GAP) between the peaks of the Zigzag peaks sensitivity : Minimum number of nearby peaks look back: it means that it has to test the last 50 peaks in the Zigzag object name perfix: a prefix for level’s line name on chart
FREE
You can find full version here: Harmonic Pattern Scanner MT4 Harmonic Pattern Scanner MT5 Introduction Harmonic Patterns are best used to predict turning point. Harmonic Patterns give you high win rate and high opportunities for trade in during one day. This indicator detects the best and successful patterns base on   Harmonic Trading   books by   Mr. Scott M.. Main Features Detect the best and     most successful patterns : Gartley, Bat, Crab, Butterfly, Cypher, Shark, Alt_Bat, Deep_Crab Easy-
FREE
インディケータは指定された数のろうそくを分析し、高値-安値に基づいてフィボナッチレベルをプロットします。 レベルが再配置されているので、範囲の右側に関心があります。 価格はレベルに固執し、タッチに反応します。 このツールを使用して、修正後のトレンドエントリポイントを見つけます。 左側でレベルが完全に上昇していることがわかる場合は、極値で移動の終わりを見つけたと見なすことができます。 すべての線は、バッファまたはオブジェクトを介して描画されます(オプション)。 入力パラメータ 。 Bars Count - 計算範囲 。 Visual Button - ボタン表示(有効/無効) 。 Corner - ボタンアンカー角度 。 X indent - ピクセル単位の水平パディング 。 Y indent - ピクセル単位の垂直パディング 。 Label Visual - 表示レベルラベル 。 Label Font Size   - フォントサイズ 。 Label Shift Bars   - バーの碑文のインデント 。 Label Tooltip   - レベルの上のカーソルの下に
FREE
Free automatic Fibonacci is an indicator that automatically plots a Fibonacci retracement based on the number of bars you select on the BarsToScan setting in the indicator. The Fibonacci is automatically updated in real time as new highest and lowest values appears amongst the selected bars. You can select which level values to be displayed in the indicator settings. You can also select the color of the levels thus enabling the trader to be able to attach the indicator several times with differe
FREE
トレンドキャッチャー: アラートインジケーター付きのトレンドキャッチャーストラテジーは、市場トレンドやポテンシャルなエントリーポイントやエグジットポイントを特定するのに役立つ多目的な技術分析ツールです。動的なトレンドキャッチャーストラテジーを備えており、市場状況に適応してトレンドの方向を明確に視覚化します。トレーダーは、自身の好みやリスク許容度に合わせてパラメーターをカスタマイズできます。このインジケーターはトレンドの識別を支援し、ポテンシャルなリバーサルをシグナルし、トレイリングストップのメカニズムとして機能し、市場への迅速な対応のためのリアルタイムアラートを提供します。 特徴: - トレンドの識別:上昇トレンドと下降トレンドをシグナルします。 - トレンドのリバーサル:ローソク足の色が上昇から下降に変わった場合やその逆の場合に、ポテンシャルなリバーサルを警告します。 - リアルタイムアラート:新しいトレンドの識別に対するアラートを生成します。 推奨事項: - 通貨ペア:EURUSD、AUDUSD、XAUUSDなど... - タイムフレーム:H1。 - アカウン
FREE
Fibonacci SR Indicator This indicator creates support and resistance lines. This indicator is based on Fibonacci Retracement and Extension levels. It will consider many combinations of the Fibonacci levels and draw support/resistance lines based on these. This indicator uses tops and bottoms drawn by the ZigZag indicator in its calculations. The ZigZag can also be drawn on the chart, if necessary. The indicator considers many combinations of past reversal points and Fibonacci ratio levels, and
FREE
Valable ZigZag
Sergey Ermolov
4.67 (9)
MT5版  |  Trend Monitor VZインジケーター  |  Owl Smart Levelsインジケーター   |  Owl Smart Levels戦略   |   FAQ エリオット波理論は 、価格チャート上の波の視覚的モデルに依存している金融市場のプロセスの解釈です。 Valable ZigZagインジケータは、取引の決定を行うために使用することができる市場の波の構造を表示します。 Valable ZigZag indicatorはより安定しており、古典的なZigZag indicatorのように方向を変えることはなく、トレーダーを誤解させます。 これは、指標波の構築にフラクタルを使用することによって達成される。 Telegram チャット: @it_trader_chat 新しい Expert Advisor Prop Master   - 取引ターミナルでテストしてください https://www.mql5.com/ja/market/product/115375 Valable ZigZagは、主にトレンド指標です 。 これは、トレーダーが取引すべき主な
FREE
The presented indicator allows you to determine potential entry points into the market and set protective orders at reasonable levels. This product can be useful for both beginners and experienced traders. The indicator is based on calculation methods proven by time and practicing traders. The indicator is calculated in two stages: At the first stage, linear regression (LR) of the selected price type is determined for a given number of chart periods. At the second stage, the obtained data is p
FREE
Basic Fibonacci Calculation Indicator  shows Trend, Stoploss, Profit 1,2,3, will show you your daily Highs and your Daily Lows , it will also show you where it expects the price to move to.  best time frame is H1 or higher .  For  a better system that also includes my Non-repaint Indicator please check out my paid Fibo Indicator  https://www.mql5.com/en/market/product/82323
FREE
ZigZag Fibo Retracement Indicator Optimize Your Trading Strategy! Are you seeking to optimize your trading strategy in the financial markets? Explore the unique features of the ZigZag Fibo Retracement Indicator, a powerful tool designed to help you identify potential support and resistance levels based on the combination of ZigZag patterns and Fibonacci ratios. Integration of ZigZag Patterns and Fibonacci: The ZigZag Fibo Retracement Indicator combines the effectiveness of ZigZag patterns, helpi
FREE
Vanexio
Sayan Vandenhout
VANEXIO USES THE TREND WAVE INDICATOR AND IT CAN IDENTIFY THE BEGINNING AND THE END OF A NEW WAVE TREND MOVEMENT. AS AN OSCILLATOR, THE INDICATOR IDENTIFIES THE OVERBOUGHT AND OVERSOLD ZONES. IT WORKS GREAT TO CATCH THE SHORT TERM PRICE REVERSALS AND USES A MARTINGALE STRATEGY TO CLOSE ALL TRADES IN PROFIT. USE DEFAULT SETTINGS ON H1 OR HIGHER TIME FRAME ON ANY PAIR FOR MORE ACCURATE TRADES WHY THIS EA : Smart entries calculated by 5 great strategies The EA can be run on even a $20000
FREE
This indicator shows ratios between extremes on the chart. You can specify your own ratios (e.g. Fibonacci). Parameters Most important Density - how much in details to search ratios in extremes. Bigger number means less details, smaller number means more details. Base unit is 1 bar on the chart. History - how far to go in history while searching. When you set -1, the indicator processes all bars from history. Base unit is 1 bar on the chart. Range - how far search ratios from given extreme. Ba
FREE
Lisek Waves
Darius Hans Lischka
2.5 (2)
Search for an entry with low risk for trading by Lisek Waves Indicator. Using Lisek Waves Indicator can improve your trading performance. In it’s simplest form, this trading tool make it easy to s earch for an entry with low risk   and to manage your trade and risk. Lisek Wave analysis is based on the notion that markets follow specific patterns called waves which are the result of a natural rhythm of crowd psychology that exists in all markets. You can avoid the loss from taking trades that are
FREE
Wave Reversal Indicator - determines the direction of trend waves and price reversals. The indicator shows wave movements and trend directions. It gives recommendations where to follow the trader, helps to follow the trading strategy. It is an addition to an intraday or medium-term strategy. Almost all parameters are selected for each time frame and are changed automatically, the only parameter for manual adjustment is the wavelength. Works on various trading instruments and timeframes, rec
FREE
Follow The Line
Oliver Gideon Amofa Appiah
4.07 (14)
FOLLOW THE LINE GET THE FULL VERSION HERE: https://www.mql5.com/en/market/product/36024 This indicator obeys the popular maxim that: "THE TREND IS YOUR FRIEND" It paints a GREEN line for BUY and also paints a RED line for SELL.  It gives alarms and alerts of all kinds. IT DOES NOT REPAINT and can be used for all currency pairs and timeframes. Yes, as easy and simple as that. Even a newbie can use it to make great and reliable trades. NB: For best results, get my other premium indicators for more
FREE
Basic Harmonic Pattern
Mehran Sepah Mansoor
4.61 (64)
このインディケータは、相場の反転ポイントを予測する最もポピュラーなハーモニックパターンを識別します。これらのハーモニックパターンは、外国為替市場で常に繰り返され ている価格形成であり、将来起こりうる値動きを示唆します。/   MT5無料バージョン さらに、このインジケーターには、市場エントリーシグナルと、様々な利食いと損切りが組み込まれています。ハーモニック・パターン・インディケータは、それ自体で売買シグナルを発 信することができますが、他のテクニカル・インディケータを使用してこれらの シグナルを確認することをお勧めします。例えば、RSIやMACDなどのオシレーターを使用して、トレンドの方向性やモメンタ ムの強さを確認してから売買を行うことを検討するとよいでしょう。 このインディケータのダッシュボードスキャナ: ( Basic Harmonic Patterns Dashboard ) 含まれるハーモニックパターン ガートレー バタフライ バット カニ サメ サイファー ABCD 主な入力 Max allowed deviation (%): このパラメータは
FREE
EA Scalping Expert
Gerard Valldosera Gomez
2 (2)
This is a fully automated scalping Expert Advisor that can be run successfully using EURUSD currency pair at H1 timeframe. This EA can't run in the same account. If you want an Expert Advisor that trades daily this is not because it requires patience to wait for a few days or weeks on the right opportunity for it to trade. It takes advantage of the volatility of the price movement.
FREE
Diversify the risk in your trading account by combining our Expert Advisors. Build your own custom trading system here:   Simple Forex Trading Strategies The expert advisor opens trades when the SMAs cross and when the WPR has left overbought/oversold areas. The SMAs are also programmed to close the trades if the trend changes. The Stop Loss, Take Profit, and Trailing Stop are calculated based on the ATR indicator. The recommended currency pair is NZDUSD and the recommended timeframe to opera
FREE
Double top and bottom indicator is a pattern scanning indicator which scans the tops and bottoms using zig zag pattern. When it find price bouncing back from the same point twice after a long trend then it generate arrow signals whenever the last resistance points is broken for double bottom and last support price broken for double top. Unlike other top bottom scanner it does not give only 1 signal. it alerts user when ever the last support /resistance is broker from double top/bottom pattern un
FREE
The indicator detects and displays М. Gartley's Butterfly pattern. The pattern is plotted by the extreme values of the ZigZag indicator (included in the resources, no need to install). After detecting the pattern, the indicator notifies of that by the pop-up window, a mobile notification and an email. The pattern and wave parameters are displayed on the screenshots. The default parameters are used for demonstration purposes only in order to increase the amount of detected patterns. Parameters
This indicator will detect harmonic patterns that are drawn on the chart by manual and automatic methods. You can see user manual from this link: https://www.mql5.com/en/blogs/post/719257 There is a free version (it detect only Gartley and Nenstar Patterns) to try this product. You can buy the full MT4 version from: https://www.mql5.com/en/market/product/104689 Notes When you use this indicator and change the settings, add indicators like Moving Average or Bollinger Bands, this indicator will
FREE
MultiFiboDynamicMT4 is a powerful, professional indicator for estimating the most important support and resistance levels. The main advantage is that it plots the Fibonacci levels at all timeframes simultaneously, which allows the trader to see the full picture of the possible price movement of the trading instrument! Advantages of the indicator The indicator is perfect for scalping and trading binary options. Suitable for beginners and experienced traders. Works on all timeframes. Works on an
FREE
ADR ST Patterns
Vladimir Poltoratskiy
4.67 (3)
ADR ST patterns is a modification of the classical ADR indicator. This simple indicator corresponds to the parameters specified in the ST patterns Strategy ( https://stpatterns.com/ ).   Structural Target patterns are the market itself, which is consistently divided into components. For the formation of ST patterns , no trend lines, geometric proportions of the model itself, trading volume, or open market interest are needed. They are easily recognized and built only on the basis of breaking thr
FREE
Description: The indicator measures, through the zigzag indicator, the levels of trend or correction. It shows in the chart the levels of each low or high detected. KEY LINKS:   How to Install  –  Frequent Questions  -  All Products  How is this indicator useful? This indicator determines, depending on Zigzag parameter if a trend is beginning, developing, or ending This indicator determines the direction of the trend Components Levels as positive or negative numbers, depending on the direction
FREE
このインジケーターは次のレベルを描画します。 毎日のオープンライン: 下は弱気相場、上は強気相場です。 1 日の平均値の高値と安値 アジア市場の高低 昨日の高値と安値 これらのレベルは、誰もが注意を払う必要がある強力なサポートとレジスタンスのレベルです。 始めるのに時間を使わなかったのなら! 価格がこれらのレベルに近い場合は注意が必要です。 より簡単に取引をお楽しみください! Kono injikētā wa tsugi no reberu o byōga shimasu. Mainichi no ōpunrain: Shita wa yowaki sōba,-jō wa tsuyoki sōbadesu. 1-Nichi no heikinchi no takane to yasune Ajia ichiba no takahiku kinō no takane to yasune korera no reberu wa, daremoga chūiwoharau hitsuyō ga aru kyōryokuna sapōto to rejisutansu no re
FREE
Ratio market
Aleksandr Krokhalev
4.38 (16)
Volatility under control. The indicator shows the optimal depth for setting goals within the day and on the average trend. It also builds pivot zones for the estimated correction depth. As an accompaniment, the key levels of the structure are displayed for several timeframes. Classical volatility indicators ATR & ADX on fixed timeframes are used for calculation. The calculation takes into account the spread, and if the market is slightly volatile, you will see a warning about the risk. You can c
FREE
New version 8.00 is available. In this version, I tried to take into account the wishes of the user. Each of you can also take part in the improvement of this advisor. In the default settings, the adviser opens trades when the extremum point is broken       standard indicator       Zigzag. When the upper point of the zigzag extremum is broken, it opens a buy deal, and when the lower point of the zigzag extremum is broken, it opens a sell deal. In addition to the standard ZigZag indicator, whi
FREE
Introduction This indicator detects volume spread patterns for buy and sell opportunity. The patterns include demand and supply patterns. You might use each pattern for trading. However, these patterns are best used to detect the demand zone (=accumulation area) and supply zone (=distribution area). Demand pattern indicates generally potential buying opportunity. Supply pattern indicates generally potential selling opportunity. These are the underlying patterns rather than direct price action. T
FREE
First of all, it is worth highlighting here that this Trading Indicator is Non Repainting, Non Redrawing and Non Lagging, which makes it ideal for manual trading. Never repaint and recalculate Once an arrow appears it never disappears, the signal comes at the opening of the new candle You will now be more profitable with this indicator You can do swing trading or scalping trading The indicator helps you identify the trend Can be optimized across all pairs and time frames Blue arrow is for buyin
FREE
このプロダクトを購入した人は以下も購入しています
Gann Made Easy は、ミスター・ギャンの理論を使用した取引の最良の原則に基づいた、プロフェッショナルで使いやすい外国為替取引システムです。 W・D・ガン。このインジケーターは、ストップロスとテイクプロフィットレベルを含む正確な買いと売りのシグナルを提供します。 PUSH通知を利用して外出先でも取引可能です。 購入後はご連絡ください!私の取引のヒントと素晴らしいボーナスインジケーターを無料で共有します! おそらく、ギャンの取引手法についてはすでに何度も聞いたことがあるでしょう。通常、ギャンの理論は初心者のトレーダーだけでなく、すでにある程度の取引経験がある人にとっても非常に複雑なものです。なぜなら、ギャンの取引手法は理論的にはそれほど簡単に適用できるものではないからです。私はその知識を磨き、最良の原則を私の外国為替インジケーターに組み込むために数年を費やしました。 このインジケーターは非常に簡単に適用できます。必要なのは、それをチャートに添付し、簡単な取引推奨事項に従うだけです。このインジケーターは常に市場分析の仕事を行い、取引の機会を探します。適切なエントリーポイントを検出
Please contact me after purchase to immediately get your PDF strategy + documentation for Trend Pulse !  Official release price of $89  ( 3 /50 copies left). Next price is $199 . Introducing Trend Pulse , a unique and robust indicator capable of detecting bullish, bearish, and even ranging trends! Trend Pulse uses a special algorithm to filter out market noise with real precision. If the current symbol is moving sideways, Trend Pulse will send you a ranging signal, letting you know that it
An exclusive indicator that utilizes an innovative algorithm to swiftly and accurately determine the market trend. The indicator automatically calculates opening, closing, and profit levels, providing detailed trading statistics. With these features, you can choose the most appropriate trading instrument for the current market conditions. Additionally, you can easily integrate your own arrow indicators into Scalper Inside Pro to quickly evaluate their statistics and profitability. Scalper Inside
まず第一に、この取引インジケーターは再描画されず、再描画されず、遅延しないことを強調する価値があります。これにより、手動取引とロボット取引の両方に理想的なものになります。 ユーザーマニュアル:設定、入力、戦略。 アトミックアナリストは、価格の強さとモメンタムを利用して市場でより良いエッジを見つけるためのPA価格アクションインジケーターです。ノイズや誤ったシグナルを除去し、取引ポテンシャルを高めるための高度なフィルターを備えています。複雑なインジケーターの複数のレイヤーを使用して、アトミックアナリストはチャートをスキャンし、複雑な数学的計算をシンプルなシグナルと色に変換します。これにより、どのような初心者トレーダーでも理解して使用し、一貫した取引の決定を行うことができます。 「アトミックアナリスト」は、新規および経験豊富なトレーダー向けにカスタマイズされた包括的な取引ソリューションです。プレミアムインジケーターとトップノッチの機能を1つの取引戦略に組み合わせ、すべてのタイプのトレーダーにとって汎用性のある選択肢にします。 デイリートレーディングとスキャルピング戦略:高
Gold Stuff
Vasiliy Strukov
4.9 (269)
Gold Stuff は、金専用に設計されたトレンド指標であり、あらゆる金融商品にも使用できます。 インジケーターは再描画せず、遅れません。 推奨時間枠 H1. それインディケータでフルオートExpert Advisor EA Gold Stuffが動作します。 あなたは私のプロフィールでそれを見つけることができます. 設定と個人的なボーナスを得るために、購入後すぐに私に連絡してください! トレンド スキャナーの強力なサポートを利用して、無料のインジケーターを入手し、プライバシーを守ります。あーみー!   設定 矢印を描く - オンオフ。 チャートに矢印を描く。 アラート - 可聴アラートのオンオフ。 メール通知 - オンオフ。 電子メール通知。 プチ通知 - オンオフ。 プッシュ通知。 次に、色域を調整します。 Gold Stuff は、金専用に設計されたトレンド指標であり、あらゆる金融商品にも使用できます。 インジケーターは再描画せず、遅れません。 推奨時間枠 H1. それインディケータでフルオートExpert Advisor EA Gold Stuff
Trend Punch
Mohamed Hassan
4.91 (22)
This indicator is unstoppable when combined with our other indicator called  Support & Resistance . After purchase, send us a message and you will get it   for  FREE as a BONUS! Introducing Trend Punch , the revolutionary forex trend indicator that will transform the way you trade! Trend Punch is uniquely designed to provide precise buy and sell arrows during strong market trends, making your trading decisions clearer and more confident. Whether you're trading major currency pairs or exotic sym
現在26%オフ 初心者やエキスパートトレーダーに最適なソリューション! このインジケーターは、独自の機能と新しい計算式を取り入れた、ユニークで高品質、かつ手頃な価格のトレーディングツールです。たった1枚のチャートで28の為替ペアの通貨強度を読み取ることができます。新しいトレンドやスキャルピングチャンスの引き金となるポイントを正確に特定することができるので、あなたのトレードがどのように改善されるか想像してみてください。 ユーザーマニュアルはこちら  https://www.mql5.com/en/blogs/post/697384 これが最初の1本、オリジナルだ! 価値のないクローンを買わないでください。 特別な サブウィンドウの矢印で強い通貨の勢いを表示 GAPがあなたのトレードを導く! 基準通貨や気配値が売られすぎ・買われすぎのゾーン(外相フィボナッチレベル)にあるとき、個別チャートのメインウィンドウに警告表示。 通貨がレンジの外側から反落した場合、プルバック/リバーサルのアラート。 クロスパターンの特別なアラート 複数の時間枠を選択可能で、トレンドを素早く
mql5と Telegramの モーニング・ブリーフィングで、詳細とスクリーンショットを含む毎日のマーケット・アップデートをご覧 ください! FX Power MT4 NGは 、長年の人気を誇る通貨強度計FX Powerの次世代モデルです。 この次世代ストレングスメーターは何を提供するのでしょうか?初代FXパワーの魅力すべて プラス GOLD/XAUの強さ分析 より正確な計算結果 個別に設定可能な分析期間 カスタマイズ可能な計算上限値により、さらに優れたパフォーマンスを実現 もっと見たい人のための特別なマルチインスタンス設定 すべてのチャートでお好みの色を無限に設定可能 数え切れないほどの通知オプションにより、重要なことを見逃すことはありません。 Windows 11とmacOSのスタイルで角を丸くした新しいデザイン 魔法のように動くインジケーターパネル FXパワーの主な機能 すべての主要通貨の強さの完全な履歴 すべての時間枠における通貨の強さの履歴 すべてのブローカーとチャートで同一の計算結果 100%信頼できるリアルタイム計算 -> リペイントなし ドロップダウン・リストから
通貨強さウィザードは、取引を成功させるためのオールインワン ソリューションを提供する非常に強力な指標です。このインジケーターは、複数の時間枠のすべての通貨のデータを使用して、このまたはその外国為替ペアのパワーを計算します。このデータは、使いやすい通貨インデックスと通貨パワーラインの形式で表され、特定の通貨のパワーを確認するために使用できます。 必要なのは、取引したいチャートにインジケーターを接続することだけです。インジケーターは、取引する通貨の実際の強さを示します。このインジケーターは、トレンドに合わせて取引するときに有利に利用できる売買高の圧力の極値も示します。このインジケーターには、フィボナッチに基づく可能なターゲットも表示されます。 このインジケーターは、PUSH 通知を含むあらゆるタイプのアラートを提供します。 購入後ご連絡下さい。私の取引のヒントをあなたと共有し、素晴らしいボーナスインジケーターを無料で提供します! 幸せで有益な取引をお祈りします。
現在31%オフ! 初心者やエキスパートトレーダーに最適なソリューション! このインジケータは、独自の機能と秘密の数式を組み込んだ、ユニークで高品質かつ手頃な価格のトレーディングツールです。たった1枚のチャートで28の通貨ペアのアラートを表示します。新しいトレンドやスキャルピングチャンスの引き金となるポイントを正確に把握することができるので、あなたのトレードがどのように改善されるか想像してみてください! 新しい基本的なアルゴリズムに基づいて構築されているため、潜在的な取引の特定と確認がより簡単になります。これは、通貨の強さや弱さが加速しているかどうかをグラフィカルに表示し、その加速のスピードを測定するためです。加速すると物事は明らかに速く進みますが、これはFX市場でも同じです。つまり、反対方向に加速している通貨をペアにすれば、利益を生む可能性のある取引を特定することができるのです。 通貨の勢いを示す縦の線と矢印は、あなたの取引の指針となるでしょう。 ダイナミックマーケットフィボナッチ23レベルはアラートトリガーとして使用され、市場の動きに適応します。もしインパルスが黄色
現在20%OFF! 初心者やエキスパートトレーダーのためのベストソリューション! このダッシュボードソフトウェアは、28の通貨ペアで動作しています。それは私達の主要な指標(高度な通貨の強さ28と高度な通貨インパルス)の2に基づいています。それは全体の外国為替市場の大きい概観を与えます。それは、すべての(9)時間枠で28の外国為替ペアのための高度な通貨の強さの値、通貨の動きの速度と信号を示しています。チャート上で1つのインディケータを使用して市場全体を観察し、トレンドやスキャルピングの機会をピンポイントで見つけることができたら、あなたのトレードがどのように改善されるか想像してみてください。 このインディケータには、強い通貨と弱い通貨の識別、潜在的な取引の識別と確認がより簡単になるような機能が搭載されています。このインディケータは、通貨の強さや弱さが増加しているか減少しているか、また、すべての時間枠でどのように機能しているかをグラフィカルに表示します。 新機能として、現在の市場環境の変化に適応するダイナミックなマーケットフィボナッチレベルが追加され、すでに当社のAdvan
Scalper Vault は、スキャルピングを成功させるために必要なすべてを提供するプロフェッショナルなスキャルピング システムです。このインジケーターは、外国為替およびバイナリー オプションのトレーダーが使用できる完全な取引システムです。推奨される時間枠は M5 です。 システムは、トレンドの方向に正確な矢印シグナルを提供します。また、トップとボトムのシグナルとギャン マーケット レベルも提供します。 インジケーターは、プッシュ通知を含むすべてのタイプのアラートを提供します。 インジケータの購入後にご連絡ください。私の個人的な取引の推奨事項と素晴らしいボーナス指標を無料で共有します! 幸せで有益な取引をお祈りします!
まず第一に、この取引ツールはノンリペイント、ノンリドロー、ノンラグの指標であり、プロの取引に理想的ですことを強調する価値があります。 オンラインコース、ユーザーマニュアル、デモ。 スマートプライスアクションコンセプトインジケーターは、新米から経験豊富なトレーダーまで、非常 に強力なツールです。Inner Circle Trader AnalysisやSmart Money Concepts Trading Strategiesなど、20以上の有用な指標を1つに組み合わせています。このインジケーターはスマートマネーコンセプトに焦点を当て、大手機関の取引方法を提供し、彼らの動きを予測するのに役立ちます。 特に、流動性分析に優れており、機関がどのように取引しているかを理解しやすくしています。市場のトレンドを予測し、価格の動きを慎重に分析するのに優れています。機関の戦略とトレードを合わせることで、市場の動向についてより正確な予測ができます。このインジケーターは多目的であり、市場構造を分析し、重要な注文ブロックを特定し、さまざまなパターンを認識するのに優れています。 このインジケー
Order Block Hunter
Noha Mohamed Fathy Younes Badr
5 (1)
Order block hunter indicator is the best indicator for  hunt the order blocks that area where there has been a large concentration of limit orders waiting to be executed Order blocks are identified on a chart by observing previous price action and looking for areas where the price experienced significant movement or sudden changes in direction .This indicator does that for you by using very complicated codes and helps you to take the best areas To buy and sell because it make marks at the best a
Enigmera
Ivan Stefanov
5 (4)
エニグメラ:市場の中核 https://www.enigmera.com はじめに このインディケータと取引システムは、金融市場に対する驚くべきアプローチです。ENIGMERAは、フラクタルサイクルを使用して、サポートとレジスタンスレベルを正確に計算します。本格的な蓄積局面を示し、方向性と目標を示します。 トレンド中でも調整中でも機能するシステムです。 どのように作動するのか? ENIGMERAは、支持線・抵抗線、目標線、乖離線の3つのラインで構成されています。このシステムは、過去のデータを現在と未来に外挿する典型的な市場指標とは異なり、現在の完全な画像を提供します。支持線上にある場合、それは本当の支持を意味し、抵抗線上にある場合、それは本当の抵抗を意味する。ある水準が破られた場合、それはトレンドの変化を意味する。再描画はしない。 市場は常に進化しているため、ENIGMERAはその評価ツールを適応させ、定期的に戦略を修正しています。  これにより、すべてのシナリオが徹底的に評価されることが保証されます。この市場指標の独自性は、その能力を見れば明らかです。  ENIGM
- Real price is 80$ - 50% Discount ( It is 39$ now ) Contact me for instruction, any questions! Introduction The breakout and retest strategy is traded support and resistance levels. it involves price breaking through a previous level.  The break and retest strategy is designed to help traders do two main things, the first is to avoid false breakouts. Many false breakouts start with a candlestick that breaks out of a level but ends with an immediate candlestick that brings the price back into t
Trend Screener
STE S.S.COMPANY
4.82 (93)
トレンドインジケーター、1つのツールに組み込まれたすべての重要なトレンド機能を備えたトレンドトレーディングとフィルタリングのための画期的なユニークなソリューション! これは、すべてのシンボル/商品(外国為替、商品、暗号通貨、インデックス、株式)で使用できる100%再描画されていないマルチタイムフレームおよびマルチ通貨インジケーターです。 トレンドスクリーナーは、チャート内のドットで矢印トレンドシグナルを提供するインジケーターに続く効率的なインジケーターです。 トレンド分析インジケーターで使用できる機能: 1.トレンドスキャナー。 2.最大利益分析を備えたトレンドライン。 3.トレンド通貨強度メーター。 4.アラート付きのトレンド反転ドット。 5.アラート付きの強いトレンドドット。 6.トレンド矢印 毎日の分析例、毎日のシグナルパフォーマンス...など、トレンドスクリーナーインジケーターを使用して、ここで見つけることができます: ここをクリックしてください 期間限定オファー:トレンドスクリーナーインジケーターは、50ドルと生涯でのみご利用いただけます。 (元の価格125 $) MQ
Gold Channel is a volatility-based indicator, developed with a specific timing algorithm for the XAUUSD pair, which consists of finding possible corrections in the market. This indicator shows two outer lines, an inner line (retracement line) and an arrow sign, where the theory of the channel is to help identify overbought and oversold conditions in the market. The market price will generally fall between the boundaries of the channel. If prices touch or move outside the channel it is a tra
カスタムMT4インジケーターで外国為替取引を成功させるための秘密を発見してください! 外国為替市場で成功を達成し、リスクを最小限に抑えながら一貫して利益を得る方法を疑問に思ったことはありますか? これがあなたが探している答えです! 取引へのアプローチに革命をもたらす独自のMT4インジケーターを導入できるようにします。 ユニークな汎用性 私たちのインジケータは、RenkoとRangeBarのろうそくのフォーメーションを好むユーザー向けに特別に設計されています。 これらのチャートタイプは多くの経験豊富なトレーダーに好まれていることを理解しています。そのため、私たちのインジケーターはそれらとシームレスに統合され、比類のない市場分析を提供します。 クリアトレンドシグナル 複雑な分析を忘れてください! 私たちのインジケーターは、鮮やかな色と明確なドット構造を利用して、市場の動向を明確に示しています。 赤と青の点は、価格の動きの方向性について疑いの余地がなく、取引の迅速な意思決定を可能にします。 HH/HL HL/LL戦略とのアライメント HH/HLおよびHL/LL構
Automated Trendlines
Georgios Kalomoiropoulos
5 (17)
トレンドラインは、外国為替取引におけるテクニカル分析の最も重要なツールです。残念ながら、ほとんどのトレーダーはそれらを正しく描画していません。自動トレンドラインインジケーターは、市場のトレンドの動きを視覚化するのに役立つ本格的なトレーダー向けのプロフェッショナルツールです。 トレンドラインには、強気トレンドラインと弱気トレンドラインの2種類があります。 上昇トレンドでは、外国為替トレンドラインは価格変動の最低スイングポイントを介して描画されます。 少なくとも2つの「最低安値」を接続すると、トレンドラインが作成されます。 下降トレンドでは、トレンドラインは価格変動の最も高いスイングポイントを介して描画されます。 少なくとも2つの「最高値」を接続すると、トレンドラインが作成されます。 トレンドラインが壊れたとき? 弱気のろうそくが強気のトレンドラインの下で閉じ、ろうそくの高さがトレンドラインの上にあるとき、強気のトレンドラインは壊れます。 強気のろうそくが弱気のトレンドラインの上で閉じ、ろうそくの安値がトレンドラインの下にあるとき、弱気のトレ
Advanced Supply Demand
Bernhard Schweigert
4.9 (314)
現在33%オフ 初心者にもエキスパートトレーダーにも最適なソリューション このインジケーターは独自の機能と新しい公式を多数内蔵しており、ユニークで高品質かつ手頃な取引ツールです。このアップデートでは、2つの時間枠ゾーンを表示できるようになります。より長いTFだけでなく、チャートTFとより長いTF(ネストゾーンを表示)の両方を表示できます。すべてのSupply Demandトレーダーの皆さんのお気に召すはずです。:) 重要情報の公開 Advanced Supply Demandの可能性を最大化するには、 https://www.mql5.com/ja/blogs/post/720245 にアクセスしてください。   エントリーまたはターゲットの正確なトリガーポイントを正確に特定できれば取引がどのように改善されるか想像してみてください。新しい基盤となるアルゴリズムに基づいて構築されているため、買い手と売り手の間の潜在的な不均衡をさらに簡単に特定できます。これは、最も強い需要と供給のゾーンと、過去のパフォーマンス(古いゾーンを表示)がグラフィカルに表現されるためです。これらの機能は、最適
製品を購入する前に、以下の情報をお読みください。 Apollo Pips PLUS SP はユニークな製品です。これは、私の新しい「アポロ ピップス」インジケーターと、私のすべての取引インジケーターにアクセスできる「スーパー パック」ボーナスを手に入れたい人のためのものです。 Apollo Pips PLUS SP 製品を購入すると、実際には私の Apollo Pips インジケーターのまったく新しいバージョンを購入することになります。このバージョンのインジケーターには改良されたアルゴリズムと使いやすいパラメーターがあり、あらゆる市場およびあらゆる取引スタイルでインジケーターを使用する機会が得られます。 この製品の購入者は、私のスーパーボーナスとして、他のすべてのインジケーターにも無料でアクセスできます!私のすべての取引ツールにアクセスしたい場合は、この製品が最適です!:) しかし、これがすべてではありません!:) この製品のすべての購入者は、私の新しいインジケーターを無料で入手する資格もあります!:)新しい取引インジケーターを利用できるようになりました。私の特権のある「スーパー パッ
PZ Day Trading
PZ TRADING SLU
3.67 (3)
このインディケータは、価格アクション分析とドンチャンチャネルのみを使用して、ジグザグ方式で価格の反転を検出します。再描画やバックペインティングを一切行わずに、短期取引向けに特別に設計されています。それは彼らの操作のタイミングを増やすことを目指している賢明なトレーダーにとって素晴らしいツールです。 [ インストールガイド | 更新ガイド | トラブルシューティング | よくある質問 | すべての製品 ] 驚くほど簡単に取引できます すべての時間枠で価値を提供します 自己分析統計を実装します 電子メール/音声/視覚アラートを実装します 可変長のブレイクアウトと混雑ゾーンに基づいて、インディケータは価格アクションのみを使用して取引を選択し、市場が非常に高速に行っていることに反応します。 過去のシグナルの潜在的な利益が表示されます この指標は、独自の品質とパフォーマンスを分析します 負けブレイクアウトは強調表示され、説明されます インジケータは、非バックペインティングおよび非再ペイントです この指標は、日中のトレーダーが単一の価格反転を見逃さないようにするのに役立ちます。ただし、す
AW Trend Predictor
AW Trading Software Limited
4.74 (39)
1 つのシステムでのトレンド レベルとブレイクダウン レベルの組み合わせ。高度なインジケーター アルゴリズムは、市場のノイズをフィルター処理し、トレンド、エントリー ポイント、および可能なエグジット レベルを決定します。インジケーターシグナルは統計モジュールに記録されるため、最適なツールを選択してシグナル履歴の有効性を示すことができます。この指標は、テイクプロフィットとストップロスのマークを計算します。 マニュアル・説明書→   こちら / MT5版→   こちら インジケーターで取引する方法: Trend Predictor での取引は、たった 3 つの簡単なステップです。 ステップ 1 - ポジションを開く 70% 以上の成功率で買いシグナルが受信されました ステップ 2 - ストップロスの決定 逆信号でトランクを選択 ステップ 3 - テイクプロフィット戦略の定義 戦略 1: TP1 に到達したらポジション全体をクローズする 戦略 2: TP1 に達した時点でポジションの 50% をクローズし、TP2 に達した時点で残りの 50% をクローズします。 戦略 3: トレンドの反転で
IX Powerは 、FX Powerの無敵の精度をついにFX以外のシンボルにも提供します。 お気に入りの指数、株式、コモディティ、ETF、さらには暗号通貨の短期、中期、長期のトレンドの強さを正確に判断します。 お使いの端末が提供する すべてを分析する ことができます。ぜひお試しいただき、取引 タイミングが大幅に改善 されることをご体験ください。 IXパワーの主な特徴 100%正確で再描画されない計算結果 - ターミナルで利用可能なすべての取引シンボルに対して 予め設定され、さらに個別に設定可能な強度分析期間のドロップダウン選択 Eメール、メッセージ、モバイル通知による無数の通知オプション EAリクエストのためのアクセス可能なバッファ カスタマイズ可能な計算制限により、さらに優れたパフォーマンスを実現 もっと見たい人のための特別なマルチインスタンス設定 すべてのチャートでお好みの色を無限に設定可能 Windows 11とmacOSのスタイルで角を丸くした新しいパネルデザイン サブ・ウィンドウとメイン・チャートの間をシームレスに移動する、魔法のように動く
M1 Arrow
Oleg Rodin
4.73 (15)
市場の2つの基本原則に基づく日中戦略。 このアルゴリズムは、追加のフィルターを使用したボリュームと価格の波の分析に基づいています。インディケータのインテリジェントアルゴリズムは、2つの市場要因が1つに結合した場合にのみシグナルを出します。インディケータは、より高い時間枠のデータを使用して、M1チャート上の特定の範囲の波を計算します。そして波を確認するために、インジケーターはボリュームによる分析を使用します。 このインディケータはレディトレーディングシステムです。トレーダーが必要とするのは、信号に従うことだけです。また、インジケーターはあなた自身の取引システムの基礎になることができます。取引はミニッツチャートでのみ行われます。 インジケーターがMTFの原則を使用しているという事実にもかかわらず、インジケーターのアルゴリズムは可能な限り安定しています。 購入後、必ず私に書いてください!私の取引設定と推奨事項をあなたと共有します!
Break and Retest
Mohamed Hassan
4.12 (17)
This Indicator only places quality trades when the market is really in your favor with a clear break and retest. Patience is key with this price action strategy! If you want more alert signals per day, you increase the number next to the parameter called: Support & Resistance Sensitivity.  After many months of hard work and dedication, we are extremely proud to present you our  Break and Retest price action indicator created from scratch. One of the most complex indicators that we made with ove
Reversal First Impulse levels (RFI)    INSTRUCTIONS        RUS       -       ENG              R ecommended to use with an indicator   -   TPSpro  TREND PRO -  Version MT5 A key element in trading is zones or levels from which decisions to buy or sell a trading instrument are made. Despite attempts by major players to conceal their presence in the market, they inevitably leave traces. Our task was to learn how to identify these traces and interpret them correctly. Main functions: Displaying activ
回帰取引を意味する専門的かつ定量的なアプローチを実装する独自の指標。これは、価格が予測可能かつ測定可能な方法で迂回して平均に戻るという事実を利用しており、非定量的な取引戦略を大幅に上回る明確な出入りルールを可能にします。 [ Installation Guide | Update Guide | Troubleshooting | FAQ | All Products ] 明確な取引シグナル 驚くほど簡単に取引できます カスタマイズ可能な色とサイズ パフォーマンス統計を実装します ほとんどの取引戦略を上回ります 適切なSLおよびTPレベルを表示します 電子メール/音声/視覚アラートを実装します 使い方 インディケータは、より高い時間枠からの完全にカスタマイズ可能な移動平均の周りの標準偏差を測定し、トレンドフォローアプローチを使用して正確に取引を見つけます。取引は、現在のチャートの価格アクションに飛び込むことによって見つけられ、価格が選択したより高い時間枠から計算された平均価格帯に戻ったときに閉じられます。それがコード化される方法のために、指標は高ボラティリティと強いトレンドの
このインディケータは、当社の2つの製品 Advanced Currency IMPULSE with ALERT  +   Currency Strength Exotics . のスーパーコンビネーションです。 このインジケーターは全ての時間枠で作動し、8つの主要通貨と1つのシンボルの強弱のインパルスをグラフで表示します。 このインジケータは、金、エキゾチックペア、商品、インデックス、先物など、あらゆるシンボルの通貨強度の加速度を表示することに特化されています。金、銀、原油、DAX、US30、MXN、TRY、CNHなどの通貨強度の加速度(インパルスまたは速度)を表示するために、任意のシンボルを9行目に追加できる、この種の最初のものです。 新しいアルゴリズムに基づいて構築され、潜在的な取引の特定と確認がさらに容易になりました。これは、通貨の強さや弱さが加速しているかどうかをグラフィカルに表示し、その加速の速度を測定するためです。加速すると物事は明らかに速く進みますが、これはFX市場でも同じです。つまり、反対方向に加速している通貨をペアリングすれば、潜在的に利益を生む取
作者のその他のプロダクト
5/35 Oscillator to be used with our Elliott Wave Indicator as part of the overall strategy on trading the 5th wave. The Elliott Wave Indicator Suite is designed around a simple but effective Swing Trading Strategy. The Indicator Suite is great for Stocks, Futures and Forex trading on multiple timeframes You can find the main Elliott Wave Indicator here  https://www.mql5.com/en/market/product/44034
FREE
Elliott Wave Indicator Perfect for trading Stocks, Futures, Forex & Crypto The Elliott Wave Indicator Suite is designed around a simple but effective Swing Trading strategy. The Indicator Suite is great for Stocks, Futures and Forex trading on multiple time-frames. By subscribing to this indicator, you will get: Automatic Elliott Wave Count Elliott Wave Isolation High Probability Pull Back Zones Special 5-35 Oscillator 6/4 Moving Average High and Low's for trade entry and management Autom
Roller Coaster Perfect for trading Stocks, Futures, Commodities and Currencies The Roller Coaster is a Stochastic MACD Cross with Special EMA Points of Control for both Long and Short Trades. Our algorithm works everything out behind the scenes, keeping your chart clean. Read more about the inner workings here ==>  https://www.mql5.com/en/blogs/post/734074 With the lease of our indicator, you will have access to: Entry Price Stop Loss Price Trade Management using  Stochastic/MACD Cross T
Think of an Experienced Traders’ Brain as a blueprint for a trading algorithm. Then the desire to keep charts as clutter free as possible. What you see below is a blueprint of Paul Bratby’s thought process but even he admits, he is getting too old to focus on all of these! • 9 Decision Points before Paul considers grading the trade a 3* trade • Then another special Decision Point will make it a 4* trade • Another for 5* trade • And Finally, a total of 12 Decision Points being correct before
With the purchase of the   Auto-Harmonic Pattern Recognition Trading Software for MT4 , you will have access to: The Auto Harmonic Pattern recognition software is designed to take the heavy lifting out of a traders Harmonic trading strategy. The Software automatically Identifies and Projects Harmonic Pattern Completion Zones for the 6 most trade-able Harmonic Patterns.  If the Pattern Completes in the projected zone, then there is a high probability of the resulting trade being successful. Pleas
xBrat Range Breakout For The MT4 Platform. Designed to help define opening ranges of major markets, along with Gold Pit opens, Oil Pit opens and for major economic data points. We recommend timeframes for opening ranges on different type of instruments further down this description. The xBrat Range Breakout combines the xBrat indicator with the range breakouts. It identifies price movements, market momentum, and trends. MT4 xBrat Range Breakout isn’t only about finding breakout chances. It hel
フィルタ:
Aravind Kolanupaka
8925
Aravind Kolanupaka 2024.06.18 16:57 
 

Good supplement indicator than can be used as confirmation for swing trades.

John Winsome Munar
3471
John Winsome Munar 2022.06.21 03:43 
 

Good work

ThorstenKock
2584
ThorstenKock 2021.07.14 16:46 
 

Useless as all Stochastic crossover signals are. No one needs this indicator

Paul Bratby
2893
開発者からの返信 Paul Bratby 2021.07.16 13:49
Hi, Appreciate all feedback, however, as explained in the description, this indicator forms as part of our Elliott Wave Indicator Suite.
However, as we cannot upload 3 files into 1 market listing, we had to create this separate listing for it.
We 100% agree that you should not take Stochastic crossover as a sole signal. In this instance, its used (along with our 5/35 Oscillator) to confirm if a 4th wave is a valid entry point to trade the 5th wave.
レビューに返信