• 概要
  • レビュー
  • コメント

Trend Bilio

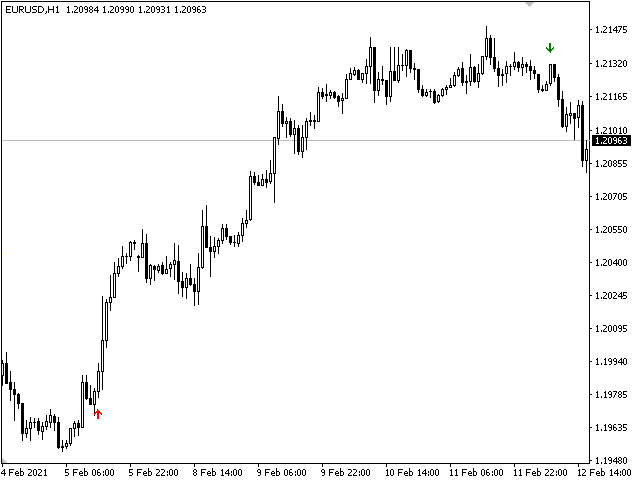
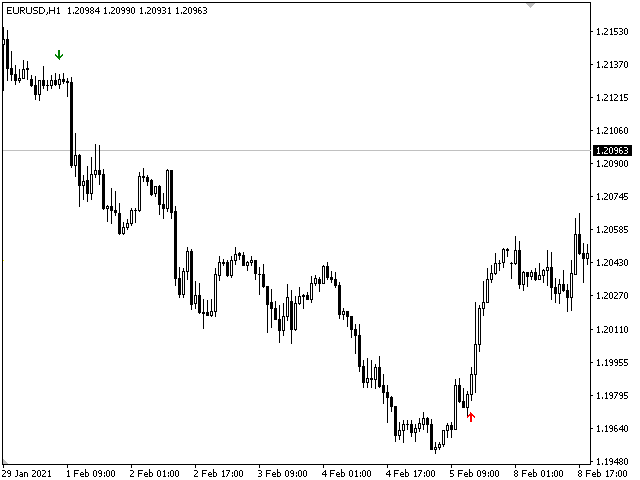
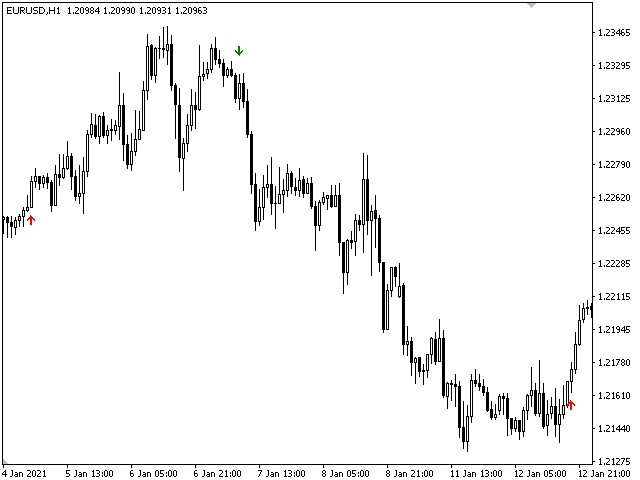
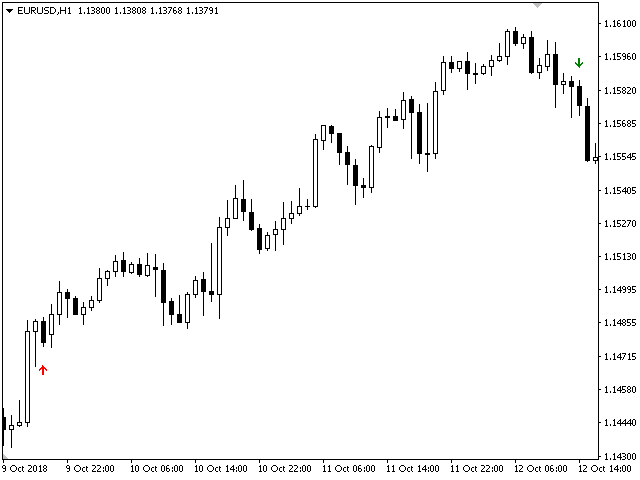
Trend Bilio - an arrow indicator without redrawing shows potential market entry points in the form of arrows of the corresponding color: upward red arrows suggest opening a buy, green down arrows - selling. The entrance is supposed to be at the next bar after the pointer.

The arrow indicator Trend Bilio visually "unloads" the price chart and saves time for analysis: no signal - no deal, if an opposite signal appears, then the current deal should be closed. It is Trend Bilio that is considered a good option for beginners who do not have serious experience in technical analysis.

You need to understand that the arrow Trend Bilio indicator is only a visual form of a signal. This Forex indicator contains a whole trading system, process information from several technical instruments and the appearance of its "arrow"? the final result of the calculation. The indicator itself evaluates how strong a signal appears in the market, signals this, and the trader can only make a trading decision.

Trend Bilio reduces the number of missed entries, which is very important for an intraday strategy, where the mathematical expectation is quite low and the spread costs are high. Arrows will help a beginner trader to better understand the mechanism of formation of signals of a trading system during step-by-step testing. The icons with the entry direction that appear will allow you to check the indicators in the strategy tester in the accelerated visualization mode.
おすすめのプロダクト
これは、キャンドルの終値を予測する指標です。 このインジケータは、主にD1チャートでの使用を目的としていますが. この指標は、従来の外国為替取引とバイナリオプション取引の両方に適しています。 インジケーターは、スタンドアロンのトレーディングシステムとして使用することも、既存のトレーディングシステムへの追加として機能させることもできます。 このインジケーターは、現在のキャンドルを分析し、キャンドル自体の内部の特定の強度係数と、前のキャンドルのパラメーターを計算します。 したがって、この指標は、市場の動きのさらなる方向性と現在のキャンドルの終値を予測します。 この方法のおかげで、この指標は、短期の日中取引だけでなく、中期および長期の取引にも適しています。 インジケーターを使用すると、市場の状況の分析中にインジケーターが生成する潜在的な信号の数を設定できます。 インジケーターの設定には、このための特別なパラメーターがあります。 また、インジケーターは、チャート上のメッセージの形式で、電子メールで、およびPUSH通知の形式で、新しい信号について通知することができます。 購入後は必ず私に書いて
This is a trend indicator without redrawing Developed instead of the binary options strategy (by the color of the Martingale candlestick) Also works well in forex trading When to open trades (binary options) A signal will appear in the place with a candle signaling the current candle It is recommended to open a deal for one candle of the current timeframe M1 and M5 When a blue dot appears, open a deal up When a red dot appears, open a trade down. How to open trades on Forex. When a signal is rec
Noize Absorption Index - is the manual trading system that measures the difference of pressure between bears forces and bulls forces. Green line - is a noize free index that showing curent situation. Zero value of index shows totally choppy/flat market.Values above zero level shows how powerfull bullish wave is and values below zero measures bearish forces.Up arrow appears on bearish market when it's ready to reverse, dn arrow appears on weak bullish market, as a result of reverse expectation. S
VR Cub
Vladimir Pastushak
VR Cub は、質の高いエントリーポイントを獲得するためのインジケーターです。このインジケーターは、数学的計算を容易にし、ポジションへのエントリーポイントの検索を簡素化するために開発されました。このインジケーターが作成されたトレーディング戦略は、長年にわたってその有効性が証明されてきました。取引戦略のシンプルさはその大きな利点であり、初心者のトレーダーでもうまく取引することができます。 VR Cub はポジション開始ポイントとテイクプロフィットとストップロスのターゲットレベルを計算し、効率と使いやすさを大幅に向上させます。取引の簡単なルールを理解するには、以下の戦略を使用した取引のスクリーンショットを見てください。 設定、設定ファイル、デモ版、説明書、問題解決方法は、以下から入手できます。 [ブログ] レビューを読んだり書いたりすることができます。 [リンク] のバージョン [MetaTrader 5] エントリーポイントの計算ルール ポジションをオープンする エントリーポイントを計算するには、VR Cub ツールを最後の高値から最後の安値までストレッチする必要があります。
Forex Gump
Andrey Kozak
2.83 (6)
Forex Gump is a fully finished semi-automatic trading system. In the form of arrows, signals are displayed on the screen for opening and closing deals. All you need is to follow the instructions of the indicator. When the indicator shows a blue arrow, you need to open a buy order. When the indicator shows a red arrow, you need to open a sell order. Close orders when the indicator draws a yellow cross. In order to get the most effective result, we recommend using the timeframes H1, H4, D1. There
This is a new strategy for SUPPLY DEMAND areas It is based on a calculation using the tick volume to detect the big price action in market for both bear /bull actions this smart volume action candles are used to determine the supply and demand areas prices in between main supply and demand lines indicate sideway market  up arrows will be shown when prices moves above the main supply and the secondary supply lines Down arrows will be shown when prices moves below the main demand and the secondary
We present you the indicator "Candle closing counter", which will become your indispensable assistant in the world of trading. That’s why knowing when the candle will close can help: If you like to trade using candle patterns, you will know when the candle will be closed. This indicator will allow you to check if a known pattern has formed and if there is a possibility of trading. The indicator will help you to prepare for market opening and market closure. You can set a timer to create a p
Owl smart levels
Sergey Ermolov
4.63 (54)
MT5版  |   FAQ Owl Smart Levels Indicator   は、 Bill Williams   の高度なフラクタル、市場の正しい波構造を構築する Valable ZigZag、エントリの正確なレベルをマークする Fibonacci レベルなどの一般的な市場分析ツールを含む 1 つのインジケーター内の完全な取引システムです。 利益を得るために市場と場所に。 戦略の詳細な説明 インジケータを操作するための指示 顧問-取引助手 プライベートユーザーチャット ->購入後に私に書いて、私はプライベートチャットにあなたを追加し、あなたはそこにすべてのボーナスをダウンロードすることができます 力はシンプルさにあります! Owl Smart Levels   取引システムは非常に使いやすいので、専門家にも、市場を勉強し始めて自分で取引戦略を選択し始めたばかりの人にも適しています。 戦略と指標に秘密の数式や計算方法が隠されているわけではなく、すべての戦略指標は公開されています。 Owl Smart Levels を使用すると、取引を開始するためのシグナルをすばやく確認し、
Binary Options Support Resistance Indicator This indicator is designed for binary options trading and effectively shows retracements from support and resistance levels. Signals appear on the current candle. A red arrow pointing downwards indicates a potential selling opportunity, while a blue arrow pointing upwards suggests buying opportunities. All that needs adjustment is the color of the signal arrows. It is recommended to use it on the M1-M5 timeframes as signals are frequent on these timef
Introduction It is common practice for professional trades to hide their stop loss / take profit from their brokers. Either from keeping their strategy to the themselves or from the fear that their broker works against them. Using this indicator, the stop loss / take profit points will be drawn on the product chart using the bid price. So, you can see exactly when the price is hit and close it manually.  Usage Once attached to the chart, the indicator scans the open orders to attach lines fo
まず第一に、この取引ツールはノンリペイント、ノンリドロー、ノンラグの指標であり、プロの取引に理想的ですことを強調する価値があります。 オンラインコース、ユーザーマニュアル、デモ。 スマートプライスアクションコンセプトインジケーターは、新米から経験豊富なトレーダーまで、非常 に強力なツールです。Inner Circle Trader AnalysisやSmart Money Concepts Trading Strategiesなど、20以上の有用な指標を1つに組み合わせています。このインジケーターはスマートマネーコンセプトに焦点を当て、大手機関の取引方法を提供し、彼らの動きを予測するのに役立ちます。 特に、流動性分析に優れており、機関がどのように取引しているかを理解しやすくしています。市場のトレンドを予測し、価格の動きを慎重に分析するのに優れています。機関の戦略とトレードを合わせることで、市場の動向についてより正確な予測ができます。このインジケーターは多目的であり、市場構造を分析し、重要な注文ブロックを特定し、さまざまなパターンを認識するのに優れています。 このインジケー
What are Heiken Ashi Candles? Heiken Ashi, derived from the Japanese term 'Heikin Ashi,' translates to average price bars. It's an indicator depicting price bars on a chart. Formula for Heiken Ashi candles: - Heiken Ashi opening price: (previous candle's opening + closing price) / 2 - Closing price Heiken Ashi: (opening + high + low + closing) / 4 - Heiken Ashi peak: Max of high, opening, or closing price - Heiken Ashi bottom price: Min of low, opening, or closing price How to Read Heik
5 signal in 1  Product     TimeFrame   Recommend   1m-5m recommend  signal   TF  5m    Banks Pro Binary Option is Indicator for binary option Can Use Manaul Trade or Robot on Platform  Mt2Trading  https://www.mt2trading.com/?ref=104    Time Trading   good work  EU session    Recommend  Curency   EUR  GBP USD        careful   AUD JPY      Recommend  Martingale 2-5 Step   Recommend  set profit  2%-5%/Day Setting Brake  News Event High volatility   recommend  15-30 min Have Problem Contract
Was: $249  Now: $99   Market Profile defines a number of day types that can help the trader to determine market behaviour. A key feature is the Value Area, representing the range of price action where 70% of trading took place. Understanding the Value Area can give traders valuable insight into market direction and establish the higher odds trade. It is an excellent addition to any system you may be using. Blahtech Limited presents their Market Profile indicator for the MetaTrader community. Ins
To get access to MT5 version please click here . - This is the exact conversion from TradingView: "Stochastic Momentum Index" By "UCSgears". - This is a popular version of stochastic oscillator on tradingview. - This is a light-load processing and non-repaint indicator. - Buffers are available for the lines on chart. - You can message in private chat for further changes you need. Thanks for downloading
This is an arrow indicator without a future function,developed based on the most advanced profit trading algorithms.It has the most innovative and advanced dual trend analysis module, as well as the latest and highly effective market trend prediction algorithm.Trends are your friends, and following larger trends can earn the maximum profit in foreign exchange. This indicator helps traders identify current trends and track them. Someone once made a profit of 10 times in a week by relying on it.No
Magic Filter MTF is perfect for any strategy. you do not need to load the chart with extra indicators like this one indicator will replace all additional filters for you it can also be a great strategy. it combines well with trading at local minima and maximums (resistance levels) multi-timeframe-multi-currency indicator 4 screen system is used 4 rows of arrows UTB indicators adjusted for different periods when two arrows pointing in the same direction on the same timeframe coincide
The Th3Eng PipFinite indicator is based on a very excellent analysis of the right trend direction with perfect custom algorithms. It show the true direction and the best point to start trading. With StopLoss point and Three Take Profit points. Also it show the right pivot of the price and small points to order to replace the dynamic support and resistance channel, Which surrounds the price. And Finally it draws a very helpful Box on the left side on the chart includes (take profits and Stop loss
Trade with Gann on your side!! MASTER CIRCLE 360 CIRCLE CHART, originally created by Gann admitted that this is “The Mother of all charts”. It is one of the last studies that this great trader left for us. The numeric tab le is apparently quite simple like all the tables and is based on square numbers, the SQUARE OF 12 and is by evolution, one of the most important square numbers. Here we can find CYCLE, PRICE AND TIME thanks to angles and grades, to show past and future support and resistance.
まず第一に、この取引インジケーターは再描画されず、再描画されず、遅延しないことを強調する価値があります。これにより、手動取引とロボット取引の両方に理想的なものになります。 ユーザーマニュアル:設定、入力、戦略。 アトミックアナリストは、価格の強さとモメンタムを利用して市場でより良いエッジを見つけるためのPA価格アクションインジケーターです。ノイズや誤ったシグナルを除去し、取引ポテンシャルを高めるための高度なフィルターを備えています。複雑なインジケーターの複数のレイヤーを使用して、アトミックアナリストはチャートをスキャンし、複雑な数学的計算をシンプルなシグナルと色に変換します。これにより、どのような初心者トレーダーでも理解して使用し、一貫した取引の決定を行うことができます。 「アトミックアナリスト」は、新規および経験豊富なトレーダー向けにカスタマイズされた包括的な取引ソリューションです。プレミアムインジケーターとトップノッチの機能を1つの取引戦略に組み合わせ、すべてのタイプのトレーダーにとって汎用性のある選択肢にします。 デイリートレーディングとスキャルピング戦略:高
This unique multi-currency strategy simultaneously determines the strength of trends and market entry points, visualizing this using histograms on the chart. The indicator is optimally adapted for trading on the timeframes М5, М15, М30, Н1. For the convenience of users, the indicator renders the entry point (in the form of an arrow), recommended take profit levels (TP1, TP2 with text labels) and the recommended Stop Loss level. The take profit levels (TP1, TP2) are automatically calculated for
フィボナッチリトレースと拡張ラインツール DiNapoliポイント取引方法とゴールデンセクション取引を使用するトレーダーにとって理想的なMT4プラットフォームのフィボナッチリトレースと拡張ラインツール 主な特長: あなたはフィボナッチリトレースメントの複数のセットを直接描くことができ、重要なリターンポイント間の関係は一目瞭然です。 2.フィボナッチ拡張を描画することができます。 3.フィボナッチフォールドバックとラインの延長は、簡単な観察と数値表示のために左右に動かすことができます。 4.チャートは非常に爽やかな 5.数字キーでサイクルを切り替えることができます。 ファンクションキー: 1。 [戻るを押す、要求に応じて描画する、最大8つのグループにする 2。拡張]を描くには[押す] 3。 \を押すと、現在のサイクルの下にあるすべての拡張機能と折り畳みが削除されます 4。フォールドバックを移動して削除して展開する (1)最初のフォールドバックセットのF5行をクリックします。 一度クリックすると(黄色に変わります)、キーボードのDel
TWO PAIRS SQUARE HEDGE METER INDICATOR Try this brilliant 2 pairs square indicator It draws a square wave of the relation between your two inputs symbols when square wave indicates -1 then it is very great opportunity to SELL pair1 and BUY Pair2 when square wave indicates +1 then it is very great opportunity to BUY pair1 and SELL Pair2 the inputs are : 2 pairs of symbols         then index value : i use 20 for M30 charts ( you can try other values : 40/50 for M15 , : 30 for M30 , : 10 for H1 ,
The indicator draws candles of the selected high timeframe on the current chart. It supports both standard timeframes and custom ones set in minutes. Built-in support for displaying the size of the candle, its body, as well as the upper and lower shadows. Alerts when High / Low breaks the previous candlestick of the selected timeframe. Customized types of elements for the simultaneous operation of several indicators on the same chart.
[ZhiBiCCI]インディケータは全てのサイクル使用に適しており、そして全ての市場品種にも適しています。 [ZhiBiCCI]緑色の実線は強気の発散の逆転です。緑色の点線は古典的な強気の発散です。 [ZhiBiCCI]赤への実線は逆弱気の発散である。赤い点線は古典的な弱気の発散です。 [ZhiBiCCI]はパラメータ(アラート、メール送信、通知送信)で設定でき、(true)に設定するとインスタント信号をアラームウィンドウに送信し、Eメール、インスタントメッセージを送信できます。 パラメータ設定の説明 [displayAlert]:これはアラームスイッチで、trueに設定され、矢印が表示されればプロンプトに自動的に警告され、falseに設定されれば警告されません。 [sendmail_NO_OFF]:これはメールを送信するためのスイッチで、trueに設定します。矢印が表示されていればMT4で設定したメールボックスにメールを送信し、falseに設定されていればメールを送信しません。 [sendnotification_NO_OFF]:これはインスタントメッセー
Insider Scalper Binary This tool is designed to trade binary options. for short temporary spends. to make a deal is worth the moment of receiving the signal and only 1 candle if it is m1 then only for a minute and so in accordance with the timeframe. for better results, you need to select well-volatile charts.... recommended currency pairs eur | usd, usd | jpy .... the indicator is already configured, you just have to add it to the chart and trade .... The indicator signals the next can
Старый, добрый "AP" в версии трендового осциллятора. Это простой индикатор, который использует максимум возможностей языка MQL4. Но при этом он работает достаточно быстро даже на процессорах 1 Гигагерц и менее. При анализе следует обращать внимание на пересечение уровня 50, если вы намеренны использовать его как трендовый индикатор. Индикатор не перерисовывает, и работает на всех типах графиков и таймфреймах. Сделаны основные возможности оповещения, оповещения работают в обоих направлениях
Chart Patterns Detect 15 patterns (Ascending Triangle, Descending Triangle, Rising Wedge, Falling Wedge, Bullish Flag, Bearish Flag, Bullish Rectangle, Bearish Rectangle Symmetrical triangle, Head and Shoulders, Inverted Head and Shoulders, Triple top, Triple Bottom, Double Top, Double Bottom) Use historical data to calculate the probability of each pattern to succeed (possibility to filter notification according to the chance of success) gives graphic indication about the invalidation level and
ROYAL DUTCH SKUNK USES THE TREND WAVE INDICATOR AND IT CAN IDENTIFY THE BEGINNING AND THE END OF A NEW WAVE TREND MOVEMENT. AS AN OSCILLATOR, THE INDICATOR IDENTIFIES THE OVERBOUGHT AND OVERSOLD ZONES. IT WORKS GREAT TO CATCH THE SHORT TERM PRICE REVERSALS AND USES A MARTINGALE STRATEGY TO CLOSE ALL TRADES IN PROFIT. USE DEFAULT SETTINGS ON H1 OR HIGHER TIME FRAME ON ANY PAIR FOR MORE ACCURATE TRADES WHY THIS EA : Smart entries calculated by 6 great strategies The EA can be run on even a $20000
このプロダクトを購入した人は以下も購入しています
Reversal First Impulse levels (RFI)    INSTRUCTIONS        RUS       -       ENG              R ecommended to use with an indicator   -   TREND PRO -  Version MT5 A key element in trading is zones or levels from which decisions to buy or sell a trading instrument are made. Despite attempts by major players to conceal their presence in the market, they inevitably leave traces. Our task was to learn how to identify these traces and interpret them correctly. Main functions: Displaying active zones
現在20%OFF! 初心者やエキスパートトレーダーのためのベストソリューション! このダッシュボードソフトウェアは、28の通貨ペアで動作しています。それは私達の主要な指標(高度な通貨の強さ28と高度な通貨インパルス)の2に基づいています。それは全体の外国為替市場の大きい概観を与えます。それは、すべての(9)時間枠で28の外国為替ペアのための高度な通貨の強さの値、通貨の動きの速度と信号を示しています。チャート上で1つのインディケータを使用して市場全体を観察し、トレンドやスキャルピングの機会をピンポイントで見つけることができたら、あなたのトレードがどのように改善されるか想像してみてください。 このインディケータには、強い通貨と弱い通貨の識別、潜在的な取引の識別と確認がより簡単になるような機能が搭載されています。このインディケータは、通貨の強さや弱さが増加しているか減少しているか、また、すべての時間枠でどのように機能しているかをグラフィカルに表示します。 新機能として、現在の市場環境の変化に適応するダイナミックなマーケットフィボナッチレベルが追加され、すでに当社のAdvan
Enigmera
Ivan Stefanov
5 (3)
エニグメラ:市場の中核 https://www.enigmera.com はじめに このインディケータと取引システムは、金融市場に対する驚くべきアプローチです。ENIGMERAは、フラクタルサイクルを使用して、サポートとレジスタンスレベルを正確に計算します。本格的な蓄積局面を示し、方向性と目標を示します。 トレンド中でも調整中でも機能するシステムです。 どのように作動するのか? ENIGMERAは、支持線・抵抗線、目標線、乖離線の3つのラインで構成されています。このシステムは、過去のデータを現在と未来に外挿する典型的な市場指標とは異なり、現在の完全な画像を提供します。支持線上にある場合、それは本当の支持を意味し、抵抗線上にある場合、それは本当の抵抗を意味する。ある水準が破られた場合、それはトレンドの変化を意味する。再描画はしない。 市場は常に進化しているため、ENIGMERAはその評価ツールを適応させ、定期的に戦略を修正しています。  これにより、すべてのシナリオが徹底的に評価されることが保証されます。この市場指標の独自性は、その能力を見れば明らかです。  ENIGM
ご紹介   クォンタム トレンド スナイパー インジケーターは 、トレンド反転を特定して取引する方法を変革する画期的な MQL5 インジケーターです。 13年以上の取引経験を持つ経験豊富なトレーダーのチームによって開発されました。     クォンタムトレンドスナイパーインジケーター   は、非常に高い精度でトレンドの反転を識別する革新的な方法で、あなたのトレーディングの旅を新たな高みに押し上げるように設計されています。 ***Quantum Trend Sniper Indicatorを購入すると、Quantum Breakout Indicatorを無料で入手できます!*** クォンタム ブレイクアウト インジケーターは、トレンドの反転を特定するとアラートを発し、矢印を示し、3 つのテイクプロフィットレベルを提案します。 初心者トレーダーにもプロのトレーダーにも適しています。 量子EAチャネル:       ここをクリック MT5のバージョン:       ここをクリック 推奨事項: 期間: すべての時間枠。最良の結果を得るには、
Please send me Direct message on MQL5 CHAT after purchasing the Indicator for Training and Installation Support There are some additional files that is important to use with the Indicator . So be sure to contact me after purchasing the Indicator So that I can add you for training and support . If you find any difficulty with installation then send me Direct message here So that I can connect with you via Anydesk or Teamview for the product installation. " Smart Order Block Indicator " to find
FX Volume
Daniel Stein
4.6 (35)
mql5と Telegramの モーニング・ブリーフィングで、詳細とスクリーンショットを含む毎日のマーケット・アップデートをご覧 ください! FX Volumeは、ブローカーの視点から市場のセンチメントをリアルに洞察する、最初で唯一の出来高インジケーターです。 ブローカーのような機関投資家が外国為替市場でどのようなポジションをとっているか、COTレポートよりもはるかに速く、素晴らしい洞察を提供します。 この情報をチャート上で直接見ることは、あなたの取引にとって真のゲームチェンジャーであり、画期的なソリューションです。 以下のようなユニークなマーケットデータ洞察から利益を得てください。 比率は 、通貨のロングポジションとショートポジションの比率をパーセントで表示します。 比率の変化は 、選択した期間内のロング比率とその変化率を表示します。 Volumes Totalは 、通貨の取引量(ロングとショート)の合計をロット単位で表示します。 Volumes Long :全通貨のロングポジションの取引量を表示します。 Volumes(ショート )は、全通貨のショートポジションの取引量を表示
ECM Elite Channel is a volatility-based indicator, developed with a specific time algorithm, which consists of finding possible corrections in the market. This indicator shows two outer lines, an inner line (retracement line) and an arrow sign, where the channel theory is to help identify overbought and oversold conditions in the market. The market price will generally fall between the boundaries of the channel. If prices touch or move outside the channel, it's a trading opportunity. The
Indicator : RealValueIndicator Description : RealValueIndicator is a powerful tool designed specifically for trading on the EURUSD pair. This indicator analyzes all EUR and USD pairs, calculates their real currency strength values, and displays them as a single realistic value to give you a head start on price. This indicator will tell you moves before they happen if you use it right. RealValueIndicator allows you to get a quick and accurate overview of the EURUSD currency pair tops and bottoms,
このインディケータは、当社の2つの製品 Advanced Currency IMPULSE with ALERT  +   Currency Strength Exotics . のスーパーコンビネーションです。 このインジケーターは全ての時間枠で作動し、8つの主要通貨と1つのシンボルの強弱のインパルスをグラフで表示します。 このインジケータは、金、エキゾチックペア、商品、インデックス、先物など、あらゆるシンボルの通貨強度の加速度を表示することに特化されています。金、銀、原油、DAX、US30、MXN、TRY、CNHなどの通貨強度の加速度(インパルスまたは速度)を表示するために、任意のシンボルを9行目に追加できる、この種の最初のものです。 新しいアルゴリズムに基づいて構築され、潜在的な取引の特定と確認がさらに容易になりました。これは、通貨の強さや弱さが加速しているかどうかをグラフィカルに表示し、その加速の速度を測定するためです。加速すると物事は明らかに速く進みますが、これはFX市場でも同じです。つまり、反対方向に加速している通貨をペアリングすれば、潜在的に利益を生む取
Gold Channel is a volatility-based indicator, developed with a specific timing algorithm for the XAUUSD pair, which consists of finding possible corrections in the market. This indicator shows two outer lines, an inner line (retracement line) and an arrow sign, where the theory of the channel is to help identify overbought and oversold conditions in the market. The market price will generally fall between the boundaries of the channel. If prices touch or move outside the channel it is a tra
Introduction to X3 Chart Pattern Scanner X3 Cherart Pattern Scanner is the non-repainting and non-lagging indicator detecting X3 chart patterns including Harmonic pattern, Elliott Wave pattern, X3 patterns, and Japanese Candlestick patterns. Historical patterns match with signal patterns. Hence, you can readily develop the solid trading strategy in your chart. More importantly, this superb pattern scanner can detect the optimal pattern of its kind. In addition, you can switch on and off individu
TrendMaestro
Stefano Frisetti
5 (3)
note: this indicator is for METATRADER4, if you want the version for METATRADER5 this is the link:  https://www.mql5.com/it/market/product/108106 TRENDMAESTRO ver 2.4 TRENDMAESTRO recognizes a new TREND in the bud, he never makes mistakes. The certainty of identifying a new TREND is priceless. DESCRIPTION TRENDMAESTRO identifies a new TREND in the bud, this indicator examines the volatility, volumes and momentum to identify the moment in which there is an explosion of one or more of these data a
SNR LEVEL INDICATOR Accurate Snr level indicator will only display Fresh Levels that are close to the Current Market Price. This indicator is very accurate in mapping Support & resistance levels. there is an alert feature when the price TOUCHES the SNR LEVEL, WHEN CLOSE CANDLE BREAK/REJECT SNR LEVEL. INDICATOR MARKING :: - SUPPORT LEVEL == V SHAPE - RESISTANCE LEVEL == APEX LEVEL - GAP RESISTANCE & GAP SUPPORT == OPEN CLOSE CANDLE - SUPPORT BECAME RESISTANCE & RESISTANCE BECAME SUPPORT INDIC
"The Squeeze indicator attempts to identify periods of consolidation in a market. In general the market is either in a period of quiet consolidation or vertical price discovery. By identifying these calm periods, we have a better opportunity of getting into trades with the potential for larger moves. Once a market enters into a "squeeze," we watch the overall market momentum to help forecast the market direction and await a release of market energy." Modified TTM Squeeze Indicator is a modifica
もちろんです。以下は、提供いただいたテキストの日本語への翻訳です: MT4用の天文学指標をご紹介します:究極の天体トレーディングコンパニオン トレーディング体験を天空の高みに高める準備はできていますか?私たちの革命的なMT4用の天文学指標をご紹介します。この革新的なツールは、複雑なアルゴリズムの力を借りて、類まれなる天文学的洞察と精密な計算を提供します。 あなたの指先で宇宙の情報を: 宝のような天文学的データが明らかになる包括的なパネルをご覧ください。惑星の地理的/太陽中心座標、太陽と地球の距離、星の大きさ、伸び、星座、黄道座標および赤道座標、さらには水平座標まで、それぞれが綿密に計算され美しく表示されています。指標によって生成される垂直線は時間値に対応し、トレーディングの旅に宇宙の視点を提供します。 惑星のラインと関係: グラフを飾る惑星のラインの魔法を体験し、スケールと角度をカスタマイズできます。直感的なコントロールパネルを介して各惑星のラインの表示を簡単に切り替えることができます。指定された時刻範囲内での合会、六分会、四分会、三分会、対会、逆行の指標で天体の関係の芸術を発見してく
収益性の高い取引機会を簡単に特定するのに役立つ強力な外国為替取引インジケーターをお探しですか?ビースト スーパー シグナル以外に探す必要はありません。 この使いやすいトレンドベースのインジケーターは、市場の状況を継続的に監視し、新しいトレンドを検索したり、既存のトレンドに飛びついたりします。ビースト スーパー シグナルは、すべての内部戦略が一致し、互いに 100% 合流したときに売買シグナルを発するため、追加の確認は不要です。シグナル矢印アラートを受け取ったら、単に売買します。 購入後、プライベート VIP グループに追加されるようにメッセージを送ってください! (完全な製品購入のみ)。 購入後、最新の最適化されたセット ファイルについてメッセージを送ってください。 MT5バージョンは こちらから入手できます。 Beast Super Signal EA は こちらから 入手できます。 コメント セクションをチェックして、最新の結果を確認してください。 ビースト スーパー シグナルは、1:1、1:2、または 1:3 のリスクと報酬の比率に基づいて、エントリ
Volatility Trend System - a trading system that gives signals for entries. The volatility system gives linear and point signals in the direction of the trend, as well as signals to exit it, without redrawing and delays. The trend indicator monitors the direction of the medium-term trend, shows the direction and its change. The signal indicator is based on changes in volatility and shows market entries. The indicator is equipped with several types of alerts. Can be applied to various trading
NAM Order Blocks
NAM TECH GROUP, CORP.
5 (1)
MT4マルチタイムフレームオーダーブロック検出インジケーター。 特徴 -チャートコントロールパネルで完全にカスタマイズ可能で、完全な相互作用を提供します。 -必要な場所でコントロールパネルを表示および非表示にします。 -複数の時間枠でOBを検出します。 -表示するOBの数量を選択します。 -さまざまなOBユーザーインターフェイス。 -OBのさまざまなフィルター。 -OB近接アラート。 -ADRの高線と低線。 -通知サービス(画面アラート|プッシュ通知)。 概要 注文ブロックは、金融機関や銀行からの注文収集を示す市場行動です。著名な金融機関と中央銀行が外国為替市場を牽引しています。したがって、トレーダーは市場で何をしているのかを知る必要があります。市場が注文ブロックを構築するとき、それは投資決定のほとんどが行われる範囲のように動きます。 注文の構築が完了すると、市場は上向きと下向きの両方に向かって急激に動きます。注文ブロック取引戦略の重要な用語は、機関投資家が行っていることを含むことです。それらは主要な価格ドライバーであるため、機関投
ご紹介     Quantum Breakout PRO は 、ブレイクアウト ゾーンの取引方法を変革する画期的な MQL5 インジケーターです。 13年以上の取引経験を持つ経験豊富なトレーダーのチームによって開発された Quantum Breakout PROは 、革新的でダイナミックなブレイクアウトゾーン戦略により、あなたの取引の旅を新たな高みに押し上げるように設計されています。 クォンタム ブレイクアウト インジケーターは、5 つの利益ターゲット ゾーンを備えたブレイクアウト ゾーン上のシグナル矢印と、ブレイクアウト ボックスに基づいたストップロスの提案を提供します。 初心者トレーダーにもプロのトレーダーにも適しています。 量子EAチャネル:       ここをクリック MT5バージョン:   ここをクリック 重要!購入後、インストールマニュアルを受け取るためにプライベートメッセージを送ってください。 推奨事項: 時間枠: M15 通貨ペア: GBPJPY、EURJPY、USDJPY、NZDUSD、XAUUSD アカウントの種類: ECN、Raw、また
トレンドトレーディング は、タイミングのプルバックとブレイクアウトにより、市場で起こっているトレンドから可能な限り利益を得るように設計された指標です。確立されたトレンドの中で価格が何をしているかを分析することにより、取引の機会を見つけます。 [ インストールガイド | 更新ガイド | トラブルシューティング | よくある質問 | すべての製品 ] 自信を持って効率的に金融市場を取引する むち打ちにならずに確立されたトレンドから利益を得る 収益性の高いプルバック、ブレイクアウト、早期の逆転を認識する この指標は、独自の品質とパフォーマンスを分析します 複数時間枠のダッシュボードを実装します インジケーターは再描画されていません 電子メール/音声/視覚アラートを実装します 確立されたトレンドは多くの取引機会を提供しますが、ほとんどのトレンド指標はそれらを完全に無視しています。インジケーターの解釈はかなり簡単です: (1) トレンドの変化 (2) トレンドの方向への後退 (3) トレンドの方向へのブレイクアウト 赤いダッシュ は下降トレンド中の修正です 青いダッシュ は上昇ト
How to use Pair Trading Station Pair Trading Station is recommended for H1 time frame and you can use it for any currency pairs. To generate buy and sell signal, follow few steps below to apply Pair Trading Station to your MetaTrader terminal. When you load Pair Trading Station on your chart, Pair Trading station will assess available historical data in your MetaTrader platforms for each currency pair. On your chart, the amount of historical data available will be displayed for each currency pai
The indicator " ZigZag on Trend " is an assistant in determining the direction of price movement, as well as a calculator of bars and points. It consists of a trend indicator, which follows the price direction by the trend line presented in the form of a zigzag and a counter calculating the number of bars traversed in the direction of the trend and the number of points on the vertical scale. (calculations are carried out by the opening of the bar) The indicator does not redraw. For convenience,
Currently Price 20% OFF ( for unlimited use )   BONUS  AUX VIP Club 2024 : Include  EA Airbag  and  Load Data History  to enhance the performance of this tool to its maximum potential  Click Here to Download Files   ( for users only )   Hello World! Introducing.. SMCpro VIP tool and Indicator for MetaTrader 4, designed to revolutionize your trading experience with the ICT Smart Money Concept. This system is meticulously crafted to empower traders with advanced insights and precision in
Step into the realm of Forex trading with confidence and precision using XQ, a cutting-edge Forex indicator designed to elevate your trading game to unprecedented heights. Whether you're a seasoned trader or just stepping into the world of currency exchange,   XQ Forex Indicator   empowers you with the insights and signals needed to make informed trading decisions. The signal conditions are a combination of three indicators, and XQ Forex Indicator only display  medium and long-term trends . The
Cycle Sniper
Elmira Memish
4.39 (36)
NEW YEAR SALE PRICE FOR LIMITED TIME!!! Please contact us after your purchase and we will send you the complimentary indicators to complete the system Cycle Sniper is not a holy grail but when you use it in a system which is explained in the videos, you will feel the difference. If you are not willing to focus on the charts designed with Cycle Sniper and other free tools we provide, we recommend not buying this indicator. We recommend watching the videos about the indiactor and system before pu
Full Forex Market View Dashboard
Opengates Success International
5 (2)
FULL FOREX MARKET VIEWダッシュボードインジケーター これは、トレーダーが市場で何が起こっているかを完全に把握できるようにするために作成されたカスタム指標です。 リアルタイム データを使用して市場にアクセスし、取引を成功させるために必要なあらゆる情報を表示します。 インストール: このインジケーターをウィンドウ チャートに添付する前に、MT4 のマーケット ウォッチ パネルに移動し、不要な通貨ペアまたは取引しないすべての通貨ペアを非表示にして、残りをそこに残します。 その理由は、FFMV ダッシュボードが MT4 の気配値表示に表示されるすべての通貨ペアを表示するためです。 最大 30 通貨ペア以下を表示できます。 MT4 の気配値表示でそれ以上だと、FFMV ダッシュボードのフォントと画像がぼやけて変形します。 正しく表示されません。 使用法:      個人取引の場合      バスケット取引の場合 (方法についてはスクリーンショットを参照してください)      複数注文取引にも使用可能      独自の取引システムなどから
Cyclical indicator for trading and predicting the direction of the market. Shows the cyclical behavior of the price in the form of an oscillator. Gives signals for opening deals when rebounding from the upper and lower boundaries of the oscillator. In the form of a histogram, it shows the smoothed strength of the trend. Will complement any trading strategy, from scalping to intraday. The indicator does not redraw. Suitable for use on all symbols/instruments. Suitable time frames for short-term
The elite (V3) multi-indicator suite from JoaquinTrading specifically geared towards Forex & binary options, including regulated exchanges such Nadex, Cantor Exchange, and other binary option brokers. The Probability Tool Suite Elite will provide the given win/loss outcome probabilities of up to 10 strike levels, a specific expiration duration, based on a combination of up to 16 indicators, rules, or conditions and derivative behavior (i.e. expiry, touch, touch & retrace).  Using this indicat
回帰取引を意味する専門的かつ定量的なアプローチを実装する独自の指標。これは、価格が予測可能かつ測定可能な方法で迂回して平均に戻るという事実を利用しており、非定量的な取引戦略を大幅に上回る明確な出入りルールを可能にします。 [ Installation Guide | Update Guide | Troubleshooting | FAQ | All Products ] 明確な取引シグナル 驚くほど簡単に取引できます カスタマイズ可能な色とサイズ パフォーマンス統計を実装します ほとんどの取引戦略を上回ります 適切なSLおよびTPレベルを表示します 電子メール/音声/視覚アラートを実装します 使い方 インディケータは、より高い時間枠からの完全にカスタマイズ可能な移動平均の周りの標準偏差を測定し、トレンドフォローアプローチを使用して正確に取引を見つけます。取引は、現在のチャートの価格アクションに飛び込むことによって見つけられ、価格が選択したより高い時間枠から計算された平均価格帯に戻ったときに閉じられます。それがコード化される方法のために、指標は高ボラティリティと強いトレンドの
今、147ドル(いくつかの更新後に499ドルに増加します) - 無制限のアカウント(PCSまたはMac) RelicusRoad ユーザー マニュアル + トレーニング ビデオ + プライベート Discord グループへのアクセス + VIP ステータス 市場の新しい見方 RelicusRoad は、外国為替、先物、暗号通貨、株式、および指数の世界で最も強力な取引インジケーターであり、トレーダーに収益を維持するために必要なすべての情報とツールを提供します。初心者から上級者まで、すべてのトレーダーが成功するためのテクニカル分析と取引計画を提供します。これは、将来の市場を予測するのに十分な情報を提供する重要な取引指標です。意味をなさないチャート上のいくつかの異なる指標ではなく、完全な解決策を信じています.これは、信号、矢印 + 価格アクション情報を表示するオールインワンのインジケーターで、他に類を見ない非常に正確です。 強力な AI に基づいて、RelicusRoad は不足している情報とツールを提供して、あなたを教育し、トレーディングのプロ、成功したトレーダーにします。
作者のその他のプロダクト
Introducing the trend indicator! Ready trading system. The principle of the indicator is to automatically determine the current state of the market when placed on a chart. The indicator analyzes market dynamics for pivot points. Shows the favorable moments of entering the market with stripes. Can be used as a channel indicator or level indicator! This indicator allows you to analyze historical data, and on their basis display instructions to the trader on further actions. To find out how to dete
The indicator monitors the market trend with very high reliability. Sharp price fluctuations, as well as noise around averaged prices, are ignored. All intersection points will be ideal points at which the direction of the trend changes. Signal points, places where color changes, can be used as points of potential market reversal. This development can be used both for long-term trading, and for piping on small periods. The indiuctor algorithm implements a kind of technical analysis based on the
This indicator will provide you with everything you need in order to overcome losses due to human emotions. The indicator determines the moments of a trend reversal and the direction of its movements. This development is equipped with the most modern, adaptable trading algorithms. The main secret of short-term trading is to have information on when to enter a deal. The indicator works great on all timeframes and informs the trader about the most successful moments of buying or selling a currency
It can be used as an independent trading system. It is based on the idea that some currency pairs follow one another. The indicator allows you to simultaneously display several other charts on the chart of one currency pair, which allows you to anticipate some movements and fairly accurately determine the beginning of trends. The principle of trading according to indicator signals is also simple: you need to sell a currency pair whose chart is higher, and buy the lower one.
This indicator gives signals about a trend change, shows successful signals. High probability of a successful trend, it can be used with an optimal risk to profit ratio. The indicator does not redraw and is not late; it can be used both for piping on small periods and for long-term trading. The indicator algorithm works using open prices, and you can work with a zero bar. It works on all currency pairs and on all timeframes.
This indicator will provide you with everything you need in order to overcome losses due to human emotions. The indicator determines the moments of a trend reversal and the direction of its movements. This development is equipped with the most modern, adaptable trading algorithms. The main secret of short-term trading is to have information on when to enter a deal. The indicator works great on all timeframes and informs the trader about the most successful moments of buying or selling a currency
The indicator ignores sharp fluctuations and market noise and tracks market trends with absolute reliability. It is suitable for trading on small timeframes and on large ones, it ignores sudden price spikes or price movement corrections due to the reduction of market noise around the average price value. For calculations, the indicator uses indicators: iLow, iHigh, iMA, iATR. Since the output signal relies on reliable indicators, it is also reliable. You can configure both a sound signal and se
Turbo Pro - Advisor uses a number of indicators to search for signals for entry. It works in fully automatic mode! Use default settings. Unlike alternative developments, this bot can simultaneously trade on both buy and sell. This is a significant advantage in real work because it makes it possible to achieve significantly better results due to increased capitalization. The bot works like a scalpel with sharp price movements, or uses series closures by averaging the overall position. Turbo Pro
This is a convenient tool if you are used to trading on a clean chart, but sometimes you need to look at this indicator. If you are not sure how to determine the inflection point of a trend and are concerned about how to draw trend lines, then this indicator is for you. From now on, you do not need to sit near the computer and analyze the price, use this indicator carefully.
This is a hybrid trend indicator, as it is based on the signals of elementary indicators and a special algorithm for analysis. The smart algorithm of the indicator determines the trend, filters out market noise and generates input signals. The indicator uses a color alarm: blue - when changing from descending to ascending, and red - on the contrary, to descending. You can use the indicator as the main indicator for determining the trend. The indicator can work both for entry points and as a filt
Special Volume - Volume indicator, in the Forex market volumes are peculiar (teak). Why is Forex not possible to track normal volumes? The fact is that it is an OTC market. Therefore, it is practically not realistic to calculate the volume of purchases and sales by one instrument. Many Forex traders completely abandon volume indicators in their work. But for those who want to use them, there are some interesting tools, and one of them is Special Volume. The Special Volume indicator shows the ave
Direction Trend indicator. Shows the direction of the current trend. Colors bars in red and blue. It works on all currency pairs and on all timeframes. Do not forget that the approach should be comprehensive, indicator signals require additional information to enter the market. The principle of the indicator is that when placed on a chart, it automatically determines the current state of the market, analyzes historical data, based on historical data.
This indicator is a professional indicator for Forex trading. Shows points for entering the market, points of potential market reversal. Uses one parameter for settings. Ready trading system. The indicator combines several progressive algorithms. Combined systems for analyzing historical data are projected onto lines in the form of straight lines connecting extremes. That is the pivot point of the market. These extremes or pivot points of the market can be used as line levels! Which is very conv
A trend indicator, and not the first view, is a regular indicator, but it can be used with an optimal risk coefficient. The principle of work is simple - the indicator shows the moments for entering the market with arrows, which is very easily perceived visually. It is recommended to use an oscillator with an additional indicator, for example, standard RSI. You need to respond to level 50. Or use some other confirmation system. The indicator can be used both for piping for small periods and
Turbo Fix - the adviser uses a number of indicators to search for signals to enter. It works in fully automatic mode! Use default settings. Unlike alternative developments, this bot can simultaneously trade on both buy and sell. This is a significant advantage in real work because it makes it possible to achieve significantly better results due to increased capitalization. The bot works like a scalpel with sharp price movements, or uses series closures by averaging the overall position. Turbo F
The indicator shows the direction of the trend, signaling this using pivot points. It can be used with an optimal risk ratio. The arrows indicate favorable moments and directions for entering the market. Uses one parameter to adjust (adjust from 1 to 3). It works on all currency pairs and on all timeframes. The indicator can be used both for piping for small periods and for long-term trading. It works on all currency pairs and on all timeframes. When using, it is recommended to look at an add
HighScalpel
Ivan Simonika
5 (1)
Introducing the HighScalpel scalping system. It is enough to optimize once, for example, per month. After that, he shows excellent results on the forward period (several times larger), which can be seen in the screenshots. Be attentive to the spread indicators of your broker! The higher the spread, the less often the market entries. If the spread is above 20 pips, then the number of inputs falls by two orders of magnitude. It is ideal to use a broker with a floating spread of 6 pips. Such b
The Revers Line signals a change in the angle of the moving average, the LevelZero parameter sets the circle of the zero point, there are limits from -LevelZero to LevelZero including those that will be considered a zero point, this can be indicated in red on histograms.   Options:   LevelZero - zero point [-LevelZero, LevelZero];   Length - length of the moving average;   Start - the starting point for calculating the angle;   End - the end point for calculating the angle;   MetodMA - averagin
We present to you a fully automated Expert Advisor designed for trading major currency pairs. The bot uses a set of its own trading algorithms and has protection against crashes. Attention! The bot only works correctly when the spread is less than 6 pips! I ask you to weigh this fact, and if you do not have the appropriate conditions for trading, this bot will not work for you! The robot controls the volume of trading positions, slippage, spread, maintains and protects open orders, can work wit
A new trend determination algorithm has been developed for this indicator. The algorithm with acceptable accuracy generates input signals and output levels. Strategy for trend trading, filtering and all the necessary functions built into one tool! The principle of the indicator’s operation is to automatically determine the current state of the market when placing it on a chart, analyze historical data based on historical data and display instructions for further actions on the screen to the trad
This development is a scalping system. The bot shows excellent results, which can be seen in the screenshots. You can shamelessly start the protest and bot with such a rite, self-confidently chucking in yogo abilities. The bot can be tested on high currency pairs and high periods. In order to install the test tester so it is indicated on the screenshots, for correct test. You need to trade on timeframes M1-M15. An expert created to trade on any instrument. It is preferable to test the adviser w
Traders can use the Trends Histogram indicator to identify potential areas of profit taking in the next section of an uptrend or downtrend. So it is for direct entry into the market. The indicator is used in the same way as any of these indicators individually or in combination with other indicators. This indicator shows an uptrend and a downtrend (green histogram). Only one input parameter is available: Length. It affects the scale of indicator price coverage. Installed input parameters ca
This development is a scalping system. The Forex Go bot shows excellent results, which can be seen in the screenshots. You can shamelessly start the protest and the bot with such a rite, self-confidently churning in your abilities. The bot can be tested on high currency pairs and high periods. In order to install the test tester so it is indicated on the screenshots, for correct test. You need to trade on timeframes M1-M15. Expert Advisor is designed to trade on any instrument. It is preferable
The work of the Stable Pulse bot is displayed in the form of several key mmoments, which can be seen in the screenshots. This development is a scalping system. You can download and test the bot for free this way by yourself making sure of its capabilities. The bot can be tested on different currency pairs and different periods. The main thing is to set the tester settings as shown in the screenshot, for correct testing. You need to trade on timeframes M1-M15. Expert Advisor is designed to trade
Universal scalper with averaged algorithm to exit the drawdown. The Protected Article advisor uses an author's scalping strategy. More than a year of work on a demo and on real accounts. The adviser will be a good assistant when scalping, trading on the news, as well as when opening many transactions on different currency pairs. It must be run on the chart of each pair that you want to trade. The parameters of the adviser are clear and easy to configure. Advisor Goal Scalping results in small
The Trend Agil e indicator tracks the market trend with very high reliability. Sharp price fluctuations, as well as noise around averaged prices, are ignored. All intersection points will be ideal points at which the direction of the trend changes. Signal points, places where color changes, can be used as points of potential market reversal. This development can be used both for long-term trading, and for piping on small periods. The indiuctor algorithm implements a variety of technical analysis
Balanced Bot - the adviser uses a number of indicators to search for signals for entry. It works in fully automatic mode! Use default settings. Unlike alternative developments, this bot can simultaneously trade on both buy and sell. This is a significant advantage in real work because it makes it possible to achieve significantly better results due to increased capitalization. The bot works like a scalpel with sharp price movements, or uses series closures by averaging the overall position. Tur
This indicator gives signals about a trend change, shows successful signals. High probability of a successful trend, it can be used with an optimal risk to profit ratio. The indicator does not redraw and does not lag, it can be used both for pipsing in small periods and for long-term trading. The indicator algorithm works using open prices, and you can work with a zero bar. It works on all currency pairs and on all timeframes.
Introducing the trend indicator! Ready trading system. The principle of the indicator is to automatically determine the current state of the market when placed on a chart. The indicator analyzes market dynamics for pivot points. Shows the favorable moments of entering the market in stripes. It can be used as a channel indicator or level indicator! This indicator allows you to analyze historical data, and on their basis display instructions to the trader on further actions. To find out how to det
Analyst Bot - the adviser uses many moving average indicators to search for signals to enter. Works in fully automatic mode! You do not need any settings, you can use the default settings. The bot passes the historical gap for the 19-year period from 2000 to 2019. Unlike alternative developments, this bot can simultaneously trade both on buy and on sell. That is, it has two independent systems of analysis. This is a significant advantage in real life because it gives the opportunity to achieve
フィルタ:
レビューなし
レビューに返信