PZ Lopez Trend MT4
- インディケータ
- PZ TRADING SLU
- バージョン: 7.0
- アクティベーション: 20
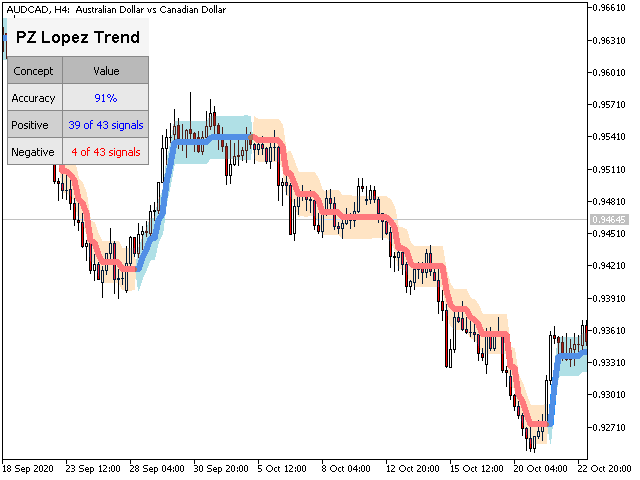
この指標は、突然の変動と市場のノイズを無視することにより、比類のない信頼性で市場動向を追跡します。これは、日中のチャートと小さな時間枠をトレンドトレードするように設計されています。その勝率は約85%です。
[ インストールガイド | 更新ガイド | トラブルシューティング | よくある質問 | すべての製品 ]
- 驚くほど簡単に取引できます
- 売られ過ぎ/買われ過ぎの状況を見つける
- 常にノイズのない取引をお楽しみください
- 日中チャートでむち打ちされるのを避ける
- この指標は、独自の品質とパフォーマンスを分析します
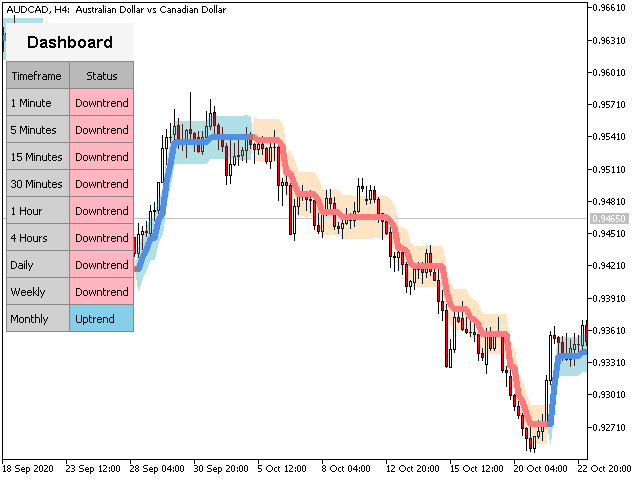
- 複数時間枠のダッシュボードを実装します
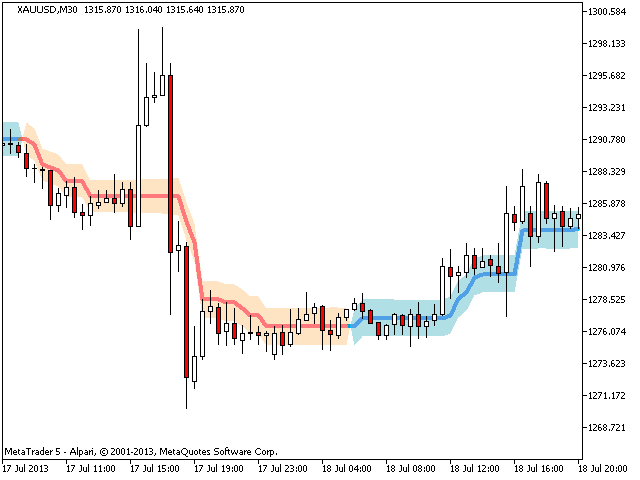
このインディケータは、低価格帯での取引に適しています。なぜなら、平均価格の周りの市場ノイズを減らすことにより、突然の価格の急上昇や修正を無視するからです。
- インディケーターは最適化をまったく必要としません
- 複数時間枠のダッシュボードを実装します
- 電子メール/サウンド/プッシュアラートを実装します
- インジケーターは再描画および非バックペインティングではありません
この指標は、より高い時間枠で非常に長い傾向に浸透する可能性のある小さな時間枠に適した傾向追跡オリエンテーションを実装し、勝ちを増幅します。
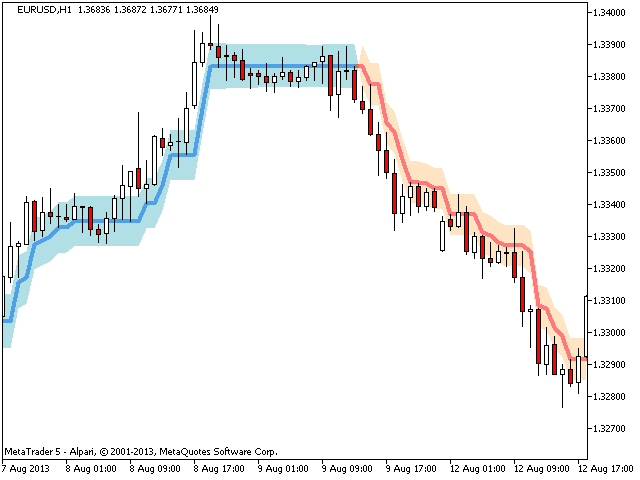
インジケーターの構造
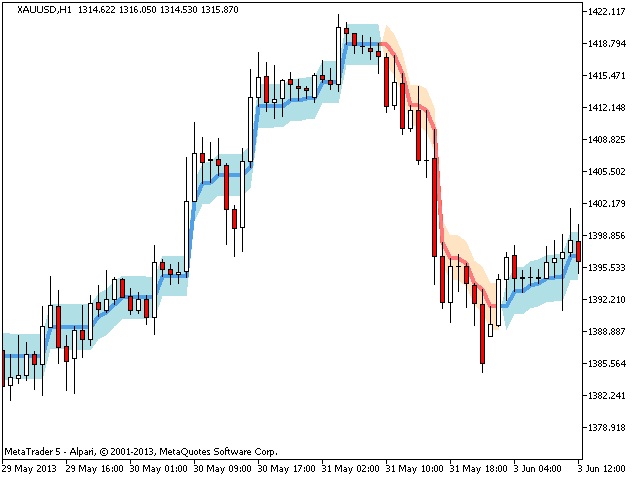
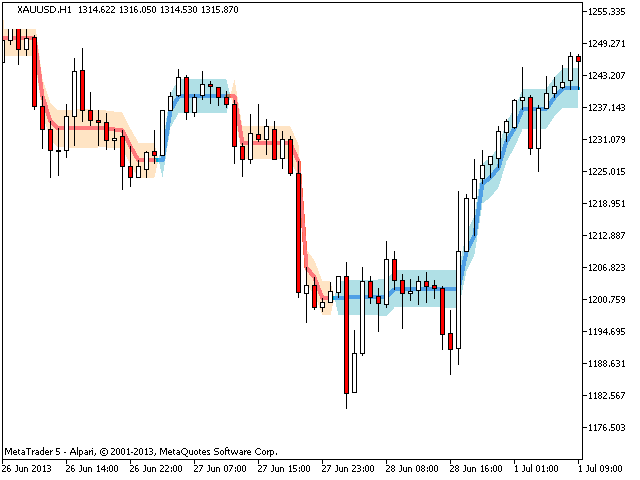
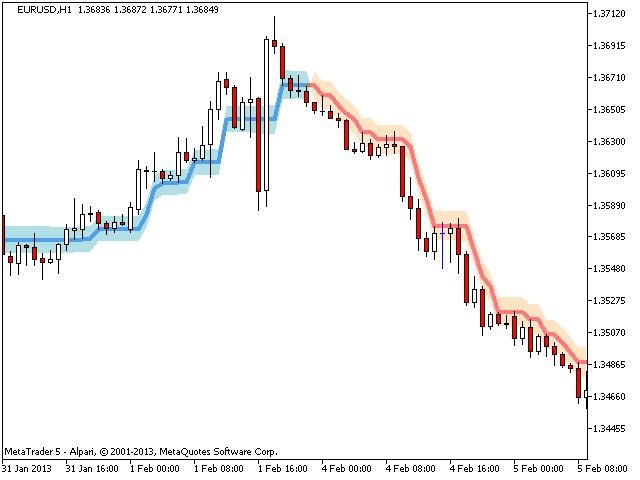
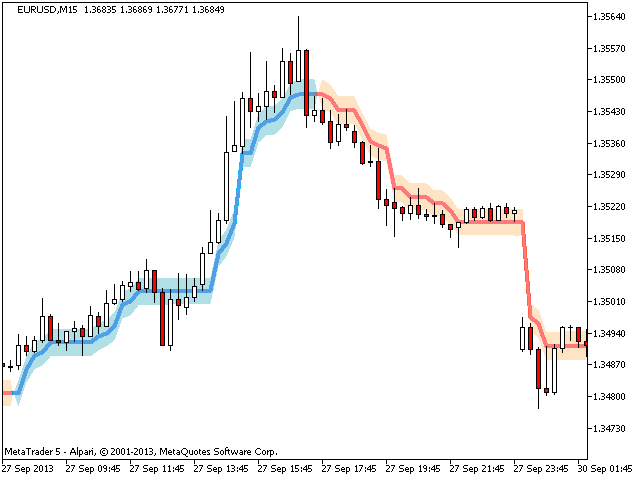
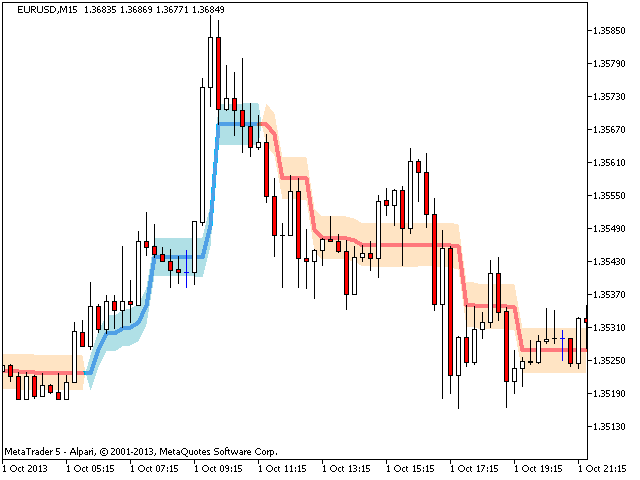
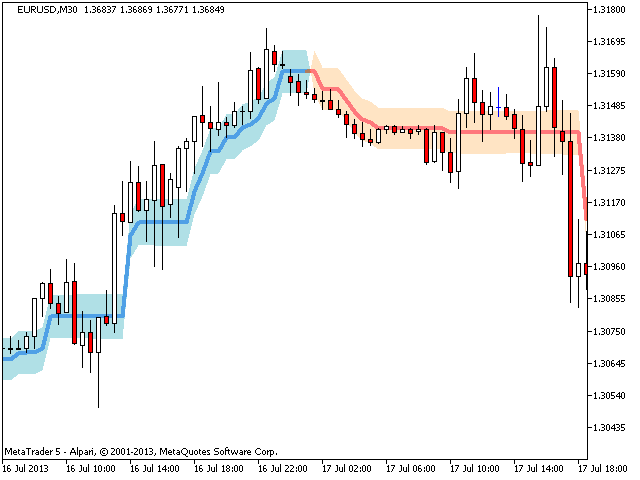
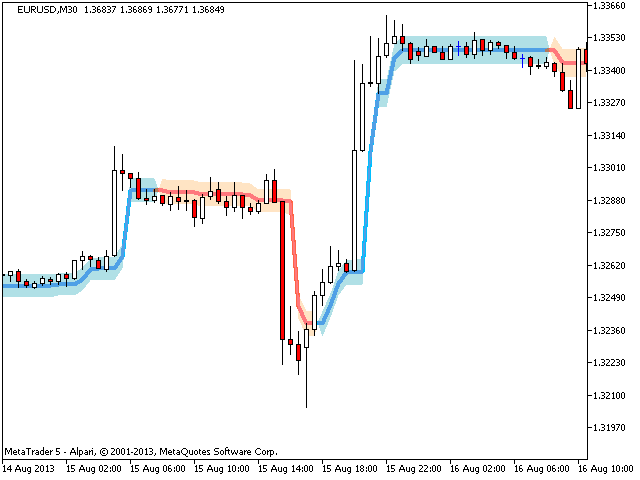
このインジケーターは、価格帯で囲まれた色付きの線を表示します。色付きの線は証券の平均価格であり、価格帯は買われ過ぎ/売られ過ぎレベルを表します。平均価格が青の場合、市場が買われすぎていない場合に長い取引を探し、平均価格が赤の場合、市場が売られすぎていない場合に短い取引を探します。
インディケータのトレンドの変化は、すぐにトレードをしたり、反対のトレードをクローズするシグナルではありません!バンドはタイミングに使用されます。技術的な案内
- インジケーターはティックごとではなくバーごとに評価されます
- インジケーターには、4つの可能な値を持つドロップダウンパラメーターが1つだけあります
- 視覚、音声、電子メール、プッシュアラートを実装します
著者
ArturoLópezPérez、個人投資家および投機家、ソフトウェアエンジニア、Point Zero Trading Solutionsの創設者