Volatility Vision
- インディケータ
- Pavel Bereznichenko
- バージョン: 1.0
- アクティベーション: 10
Volatility Vision: Essential for Forex and Stock Markets
Volatility Visionを発見:あなたの取引革命
初心者とエキスパートトレーダーに最適
簡単スタートガイド: 当社のユーザーマニュアルで効果的な使い方を学びましょう。
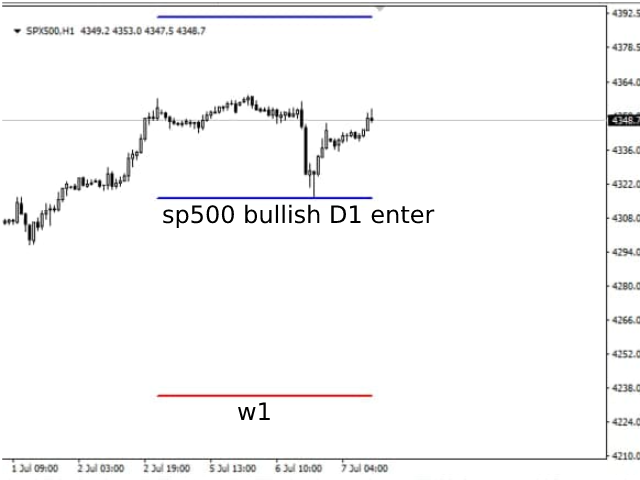
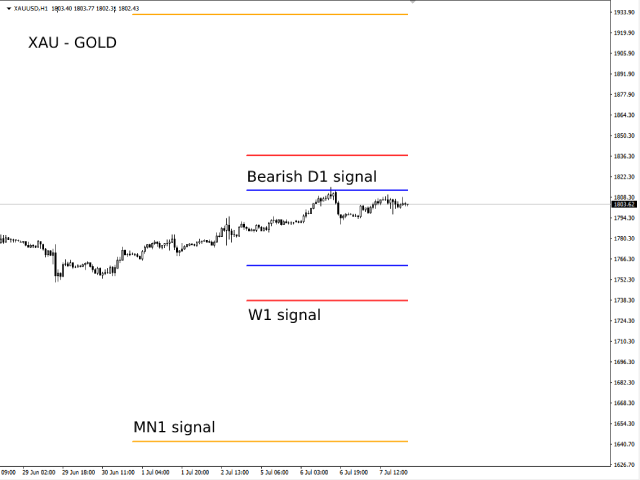
Volatility Vision インディケーターは、チャート上に正確なボラティリティレベルをマッピングする強力なツールです。この多用途なツールは、取引戦略に統合するために不可欠で、すべての通貨ペアおよび株式市場に対応しています。
ボラティリティの閾値を活用して、一週間の取引を自信を持って管理しましょう。
Volatility Visionの利点
- 精度向上:ストキャスティクスオシレーターで一般的な誤検知を大幅に減少させます。
- 早期シグナル:RSIよりも早く取引シグナルをキャッチし、見逃した機会を捉えるのに役立ちます。
- 市場のリーダー:MACDが反応する前に積極的なインサイトを提供します。
- 信頼性:CCIからの誤信号の一般的な問題を回避します。
簡単な設定
開始するにはATR値を入力します(デフォルトは15)。すべてのレベルは一貫した分析のために固定されており、データを更新するために時間枠を切り替えます。
インディケーターガイド
- 青いライン:日次ボラティリティ。
- 赤いライン:週次ボラティリティ。
- オレンジのライン:月次ボラティリティ。
従来のATRとVolatility Visionを組み合わせて、より戦略的な機会を得ましょう。今すぐあなたの取引戦略を強化しましょう!
今すぐインディケーターを入手:マーケットを訪れる
インストールは簡単で、すぐに成功を収める準備が整います!
重要:静的値の制限のため、インディケーターはプラットフォームでの最初の週のみテスト可能です。