Range profile
- インディケータ
- Mikhail Nazarenko
- バージョン: 1.3
- アップデート済み: 18 5月 2024
- アクティベーション: 7
If your strategy is based on taking profit on a rebound from price accumulations, the Range profile indicator will become the main tool in scalping trading. Point of control is calculated based on the total volume for each tick or minute candles, depending on the settings and trading timeframe. In the absence of real volumes on the chart, the POC and market profile are calculated using minute candles and their tick volume.
Application
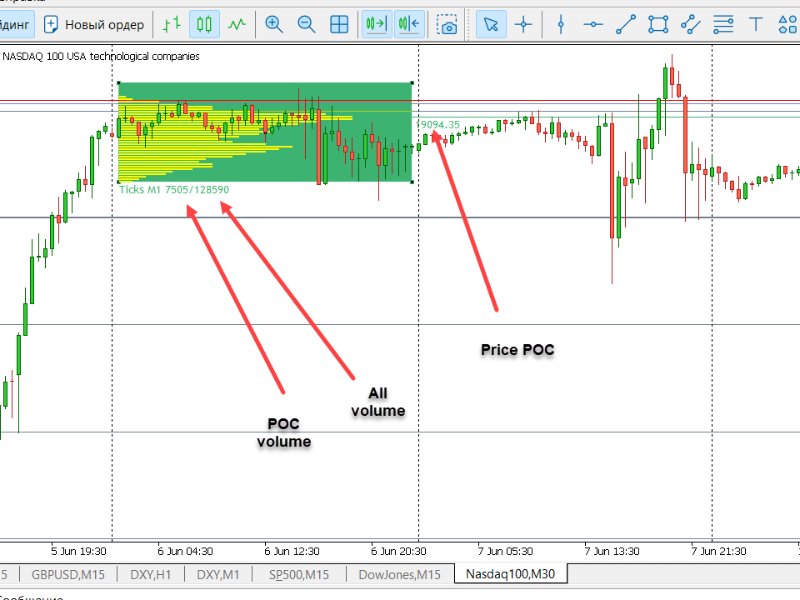
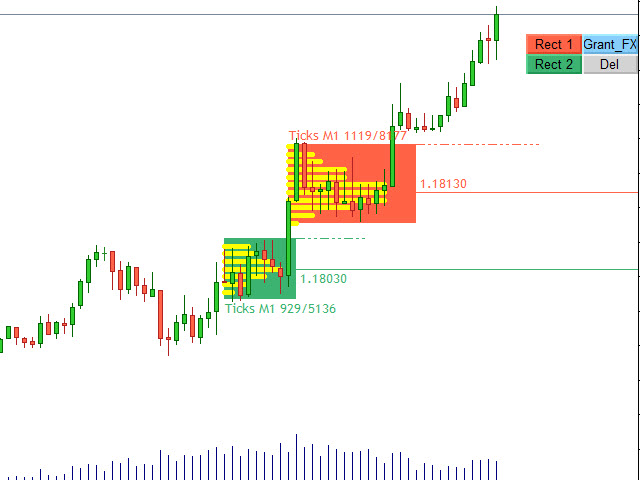
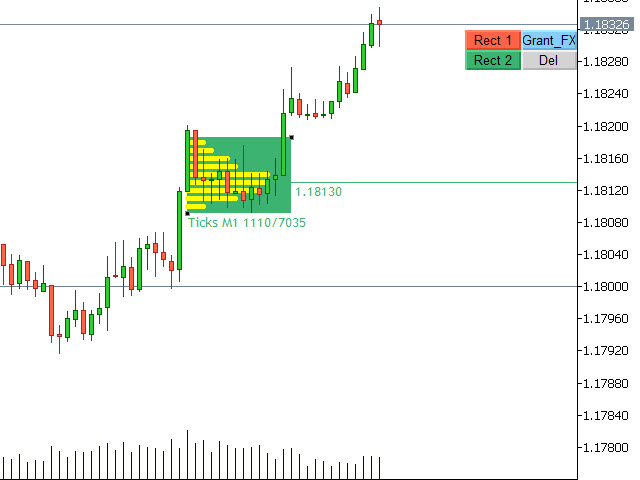
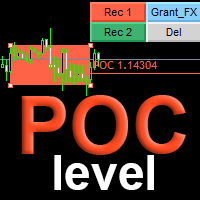
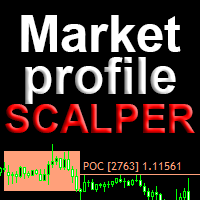
To get the Point Of Control level and market profile for a given area, just create (Rec1 or Rec2 button) and drag a rectangle onto the range of candles on the chart. After dragging or changing the size of the rectangle, the indicator will calculate the market profile and draw a Point Of Control line for candles that fall within the rectangle area.
The POC levels of candlestick flats and accumulations are ideal places to enter a position, since when working with a trend, the probability of a rebound from the POC level is much higher than the probability of a breakout.
To set an alert for a price approaching or leaving a rectangular area, double-click on the edge of the rectangle. When you set an alert, a dotted line will appear at the edge of the rectangle. Now, the first time the price touches the line, an alert will sound.
If you need to display round levels on the chart, turn on the display of round levels and the line drawing step in points in the settings.
Peculiarities
- It will show the level and total maximum volume of the market profile of the rectangular area - Point Of Control, as well as the total volume of the entire range inside the rectangle.
- Draws a histogram of volume distribution within a rectangle.
- For high accuracy in determining the POC level, there is a calculation mode based on the volume of each tick. ( Volume of each tick - true)
- Sets up a grid of round levels.
- When you double click on the rectangle, an alert is activated, which will work when you touch the current price.
- The indicator works on any pairs, cryptocurrencies and timeframes.
- The indicator does not load your computer's processor, since it performs calculations only after dragging or resizing the rectangle.
- When working with a trend, the probability of a rebound from the level of POC savings is more than 65% for all major pairs.
Settings
- Button corner - display indicator buttons at the top or bottom
- Volume of each tick true / M1 volume false - method of calculating the profile by tick volume or minute candles
- Range profile display - show the range profile inside the rectangle as a histogram
- Rectangle 1 color - color of rectangle 1
- Rectangle 2 color - color of rectangle 2
- Range profile color - color of the range profile histogram
- Point of control (true) / Midline (false) - calculate POC and set the middle line
- Rectangle color fill - fill the entire rectangle with color or just the outline
- Round levels step (pips) - step for drawing round levels
- Number of round levels down and up - number of round levels up or
- Sound enable - enable sound when creating a rectangle
For clients
I will definitely respond to all comments, suggestions and reviews with a detailed explanation.
Write to the author personally.
Show all products by this author

