InputLess Signal Generator
- インディケータ
- Igor Gerasimov
- バージョン: 1.2
- アップデート済み: 18 6月 2021
- アクティベーション: 5
////////////////////////////////////////////////
とても簡単です。設定はありません。
矢印の色とサイズのみを指定する必要があります。
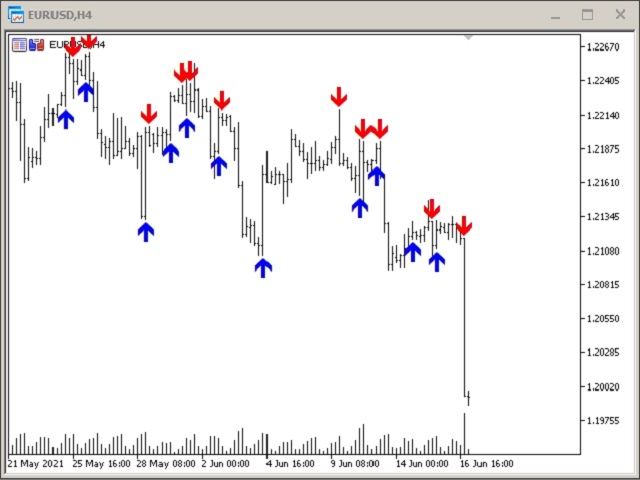
この指標の読みを理解することも非常に簡単です。 上向き矢印は買いシグナルであり、下向き矢印は売りシグナルです。
ストラテジーテスターでテストしてみてください-あなたはそれを好きになるでしょう!!!
////////////////////////////////////////////////// /////////////////////////////////
この指標が取引の成功に非常に役立つことを願っています。
がんばろう。