True Oversold Overbought
- インディケータ
- Innovicient Limited
- バージョン: 2.10
- アップデート済み: 4 3月 2025
- アクティベーション: 10
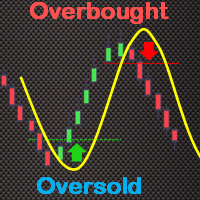
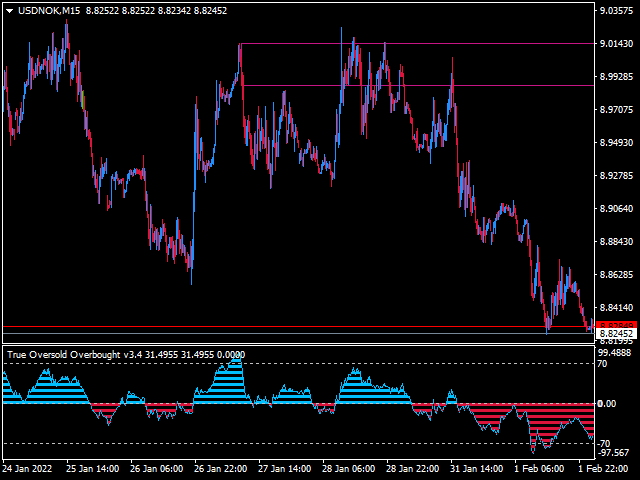
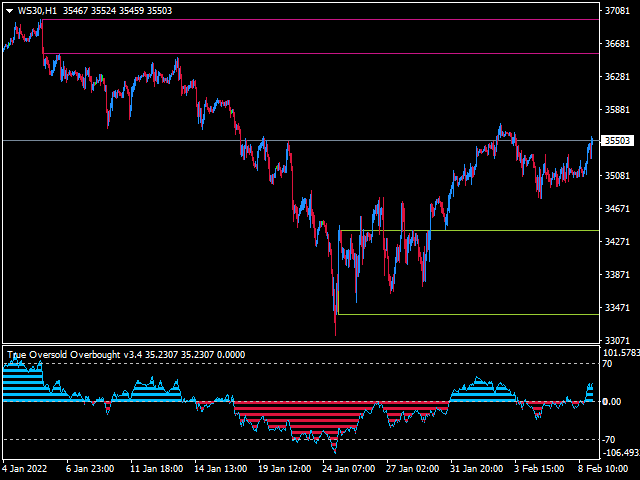
The True Oversold Overbought indicator provides you with ability to swiftly check whether the asset is oversold or overbought.
- Other than complementing your trading with True Oversold Overbought, you can use the indicator as your only trading system.
- It works with all forex instruments and will save you the headache of estimating when the market is due for a reversal or retracement.
- When the "Super Charge" feature is enabled, the areas where the price is in oversold/overbought status are amplified to give you a clear state of the market,therefore, you will not miss the moment to prepare for a reversal/retracement.
- Alternatively, when the "Super Charge" feature is disabled, the indicator still shows the oversold and overbought levels but this time you get a broader view of the market.
- Get alerts when price bleach the oversold/overbought levels.
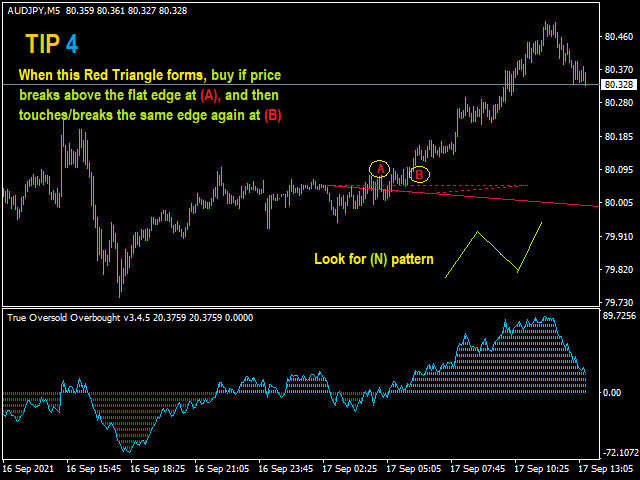
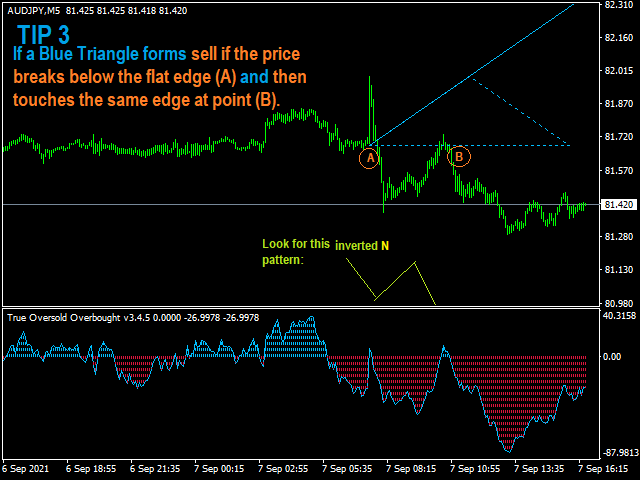
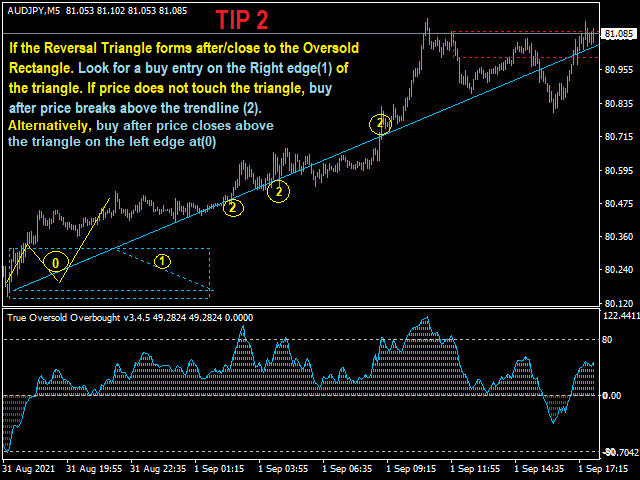
- See reversal areas which are indicated by a triangle and trendline.
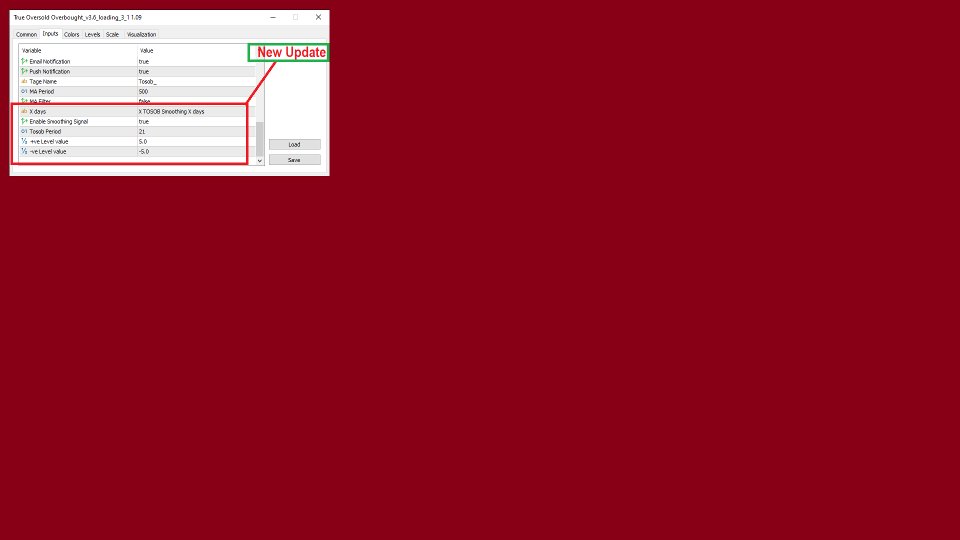
- New Upgrade: TOSOB Smoothing X days
Most indicators that scan for Oversold or Overbought levels have a major downfall; they keep touching and re-touching what was previously otherwise marking oversold overbought state. In this new update, we have introduced smoothing without introducing delayed signaling when the market actually reaches a true Oversold Overbought level.
- It is not overly sensitive or keep touching oversold/overbought levels.
- Open trades early when the price is exiting exiting overbought / oversold levels and close trades at the right time.
- Trade when there is noise and when the market is silent.
Settings
No complex settings since the default settings work perfectly. However, the following is all you can add if you want to change a few things.
- Select between old and new version of the indicator
- Add the Coefficient value.
- Add Price Smoothing
- Add your RSI period
- Add your Money Flow Index (MFI) period
- Enable/Disable the Super Charge feature.
- Add the Super Charge and Ordinary Sell and Buy levels that suits your trading. All is drawn automatically.
- Enable drawing of rectangles - shows boxes where price is in the extremes.
- Alerts
- Reversal settings
Basic Usage
The indicator displays on the separate window and also show rectangles on the main chart.
When the overbought and oversold rectangles draw, it is time to buy if price opens above the rectangles and sell if the candle opens below.
Note: If the overbought rectangle is formed but a candle open above it, its an indication the trend will continue surging for a while before breaking below.
Similarly, the continued drop in price below the oversold rectangle indicates the price might continue in the same direction before bulls takes control.
TOSOB Smoothing X days Usage:
1. Overbought/Oversold states: When the Green line is above 50, the asset is overbought while it is oversold if the red line is below -50 [This is based on the default settings and +ve Level value=50 and -ve Level value=-50]. You can buy/sell breakout or snap early change of market structure.
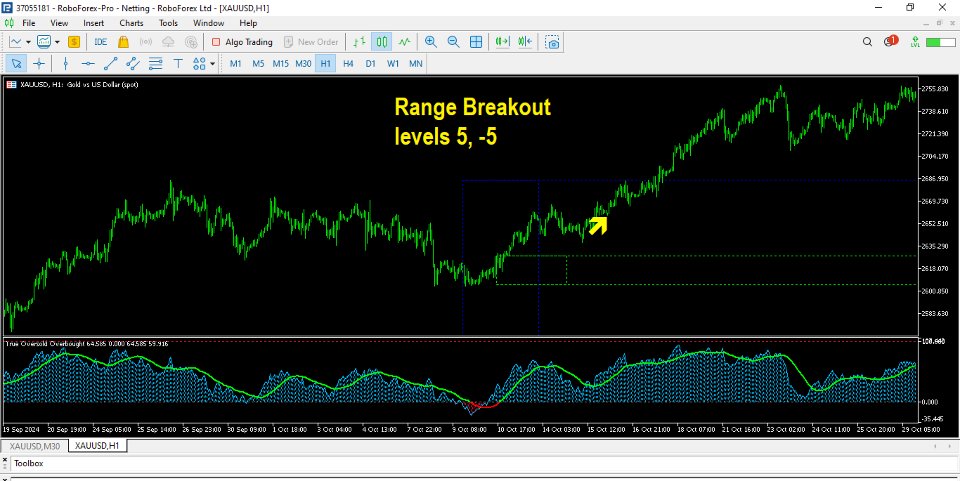
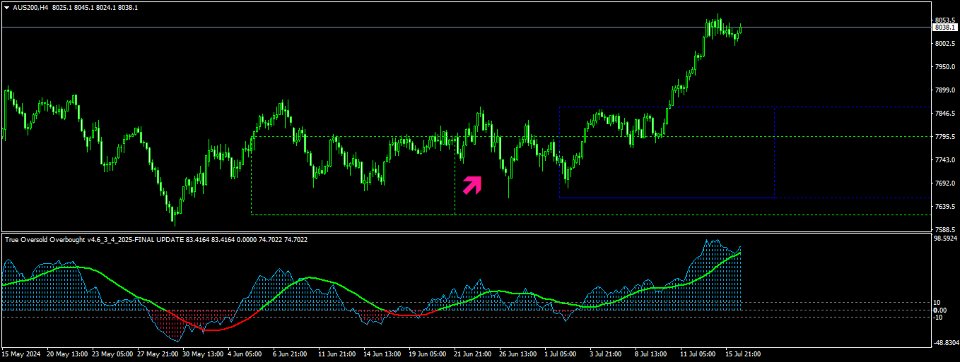
2. Early Range Breakout: To take advantage of this, set the +ve Level value to 5 and -ve Level value to -5 when trading XAUUSD. Open buy if the price breaks above the Green Box and sell when price breaks below the Blue box. Different instruments have different levels, but this is usually below 10 and above -10.
For this to work effectively, follow the trend buy checking the color of the higher smoothing signal. If it is green, only buy and if red, only sell. For example, if you are trading on the 15M chart, confirm with the 1H. If you see an uptrend , buy breakouts on "Asset Up" Zone. If main trend is bears, sell on "Asset Down" Zone.
Another point is that you can adjust the Tosob Period depending on your desired sensitivity.
New Upgrade: TOSOB Smoothing X days: https://www.mql5.com/en/blogs/post/761189
Other indicators: https://www.mql5.com/en/users/pipmontra/seller
TOSOB Smoothing X days | Manual Part 1 | Manual-Multi-timeframe Part 2 | Manual-New update Part 3
