Lisek ATR Levels
- インディケータ
- Darius Hans Lischka
- バージョン: 1.1
- アップデート済み: 9 6月 2021
Are you looking for ATR Levels, ATR Trend, ATR Support and Resistance Indicators ?
Now you have all in one !!!
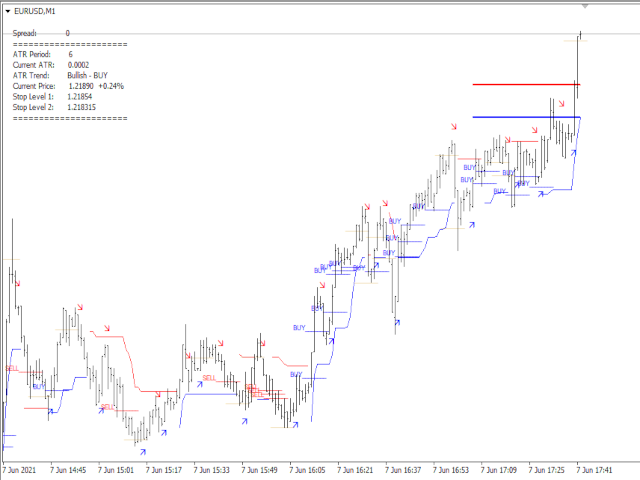
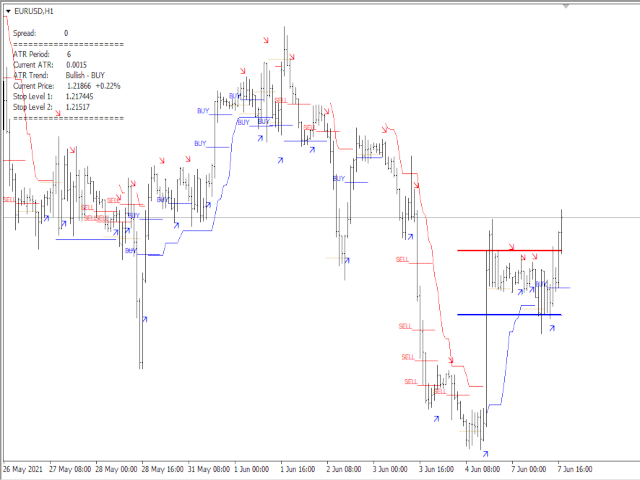
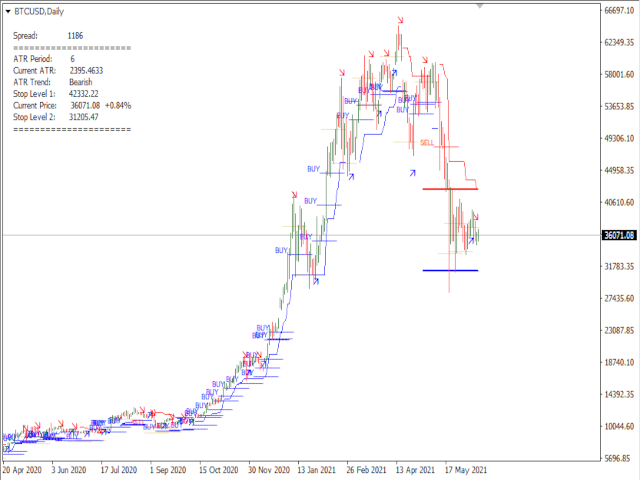
Info on your chart is showing you:
- where current price and levels are,
- what is current trend and signals.
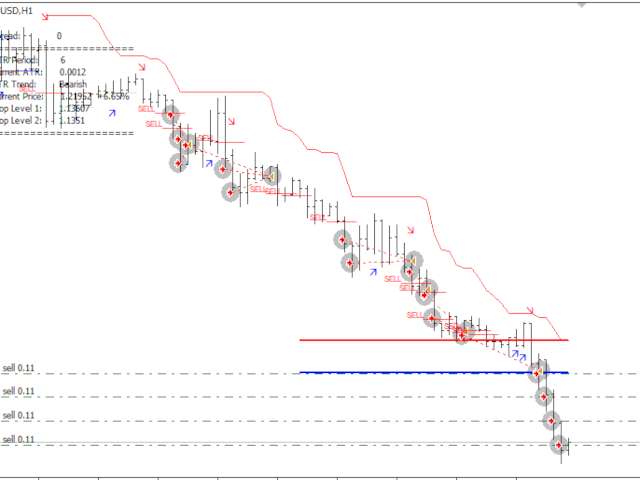
Search for an entry with low risk for trading by Lisek ATR Indicator.
There are many ways to trade with Lisek ATR Indicator:
- Trade Support and Resistance Levels.
- Trade pullbacks (Range trading).
- Trade breakouts.
- Trade reversals.
- Take profit or set stop-loss based on ATR Levels.
- Trail your stop-loss based on ATR Levels.
Happy Trading !!!


Rating is true, the practicality is simple.