ATR SuperTrend
- インディケータ
- Paulo Henrique Faquineli Garcia
- バージョン: 1.1
- アクティベーション: 5
A ‘Supertrend’ indicator is one, which can give you precise buy or sell signal in a trending market. As the name suggests, ‘Supertrend’ is a trend-following indicator just like moving averages and MACD (moving average convergence divergence). It is plotted on prices and their placement indicates the current trend.
The Supertrend indicator is a trend following overlay on your trading chart, much like a moving average, that shows you the current trend direction.
The indicator works well in a trending market but can give false signals when a market is trading in a range.
It uses the ATR (average true range) as part of its calculation which takes into account the volatility of the market. The ATR is adjusted using the multiplier setting which determines how sensitive the indicator is.
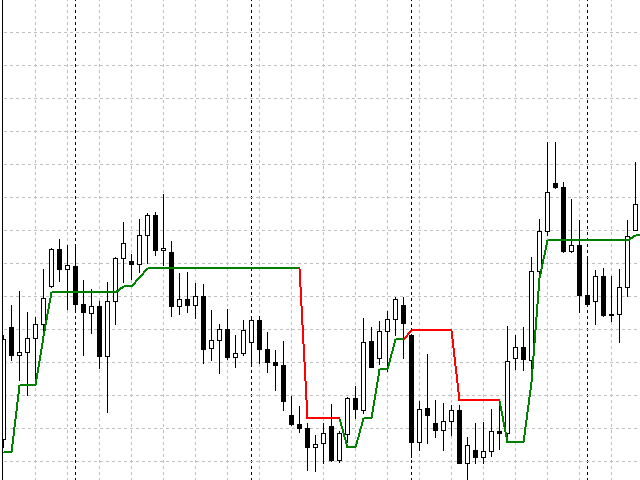
The changing colors determine the trend direction of the instrument you are trading.
When the indicator flips to green due to the closing price being above the line, a buy signal is generated.
Once price closes on the oppositive side of the line, it flips from green to red and a sell signal is generated.
Basically, trading signals can be obtained by watching the closing of candlesticks against Supertrend. When the candlestick closes above the Supertrend line causing it to change color, you can buy the maximum of this candlestick and stop the minimum of the same candlestick. Conversely, when the candlestick closes below the Supertrend line causing it to change color, you can sell at the low of that candlestick and position to stop at the maximum of the same candlestick.


ユーザーは評価に対して何もコメントを残しませんでした