Market Imbalance
- インディケータ
- Scott Edward Merritt
- バージョン: 1.5
- アップデート済み: 10 2月 2023
- アクティベーション: 5
What Is Market Imbalance?
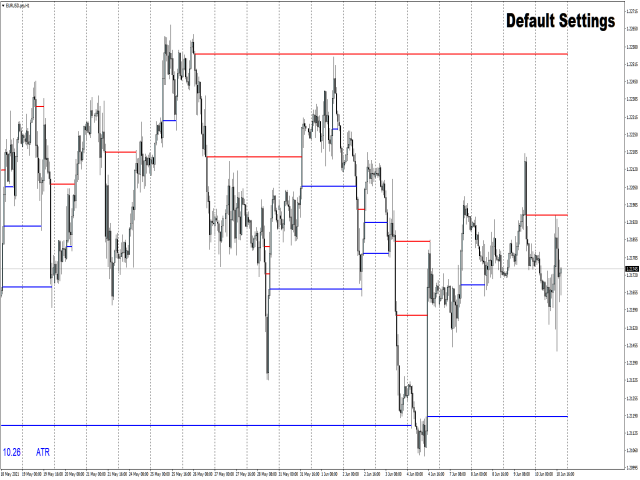
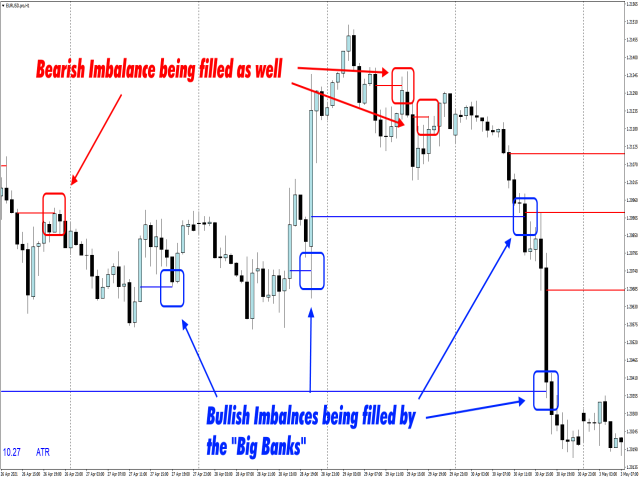
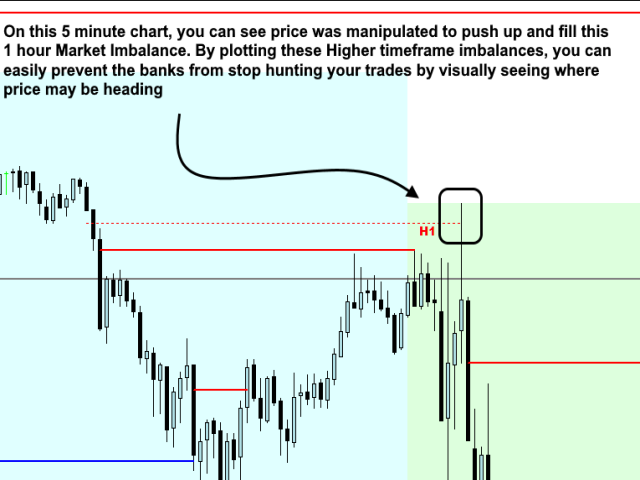
Market Imbalance, also known as "IPA" or Improper Price Action, is when price moves so quick in one direction with no orders on the other side of the market to mitigate the price movement. We all know Big Banks, or "Smart Money", can move the market by placing huge orders which in turn can move price significantly. They can do this because Big Banks are the top 10 Forex traders in the world. But unfortunately, the Big Banks cannot leave these orders in drawdown and must mitigate these orders to continue to move the market in their intended direction. Hence, this is why Smart Money seeks out the retail trader's stop losses (figuratively known as stop-hunting) to capture liquidity in order to move the market back to where they want it to go in order to mitigate their Market Imbalances.
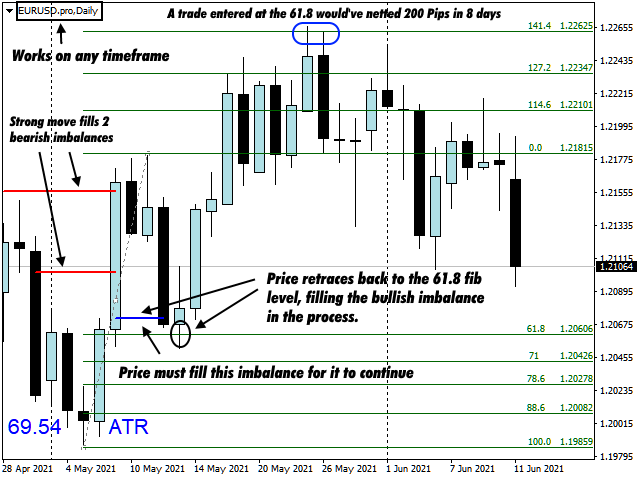
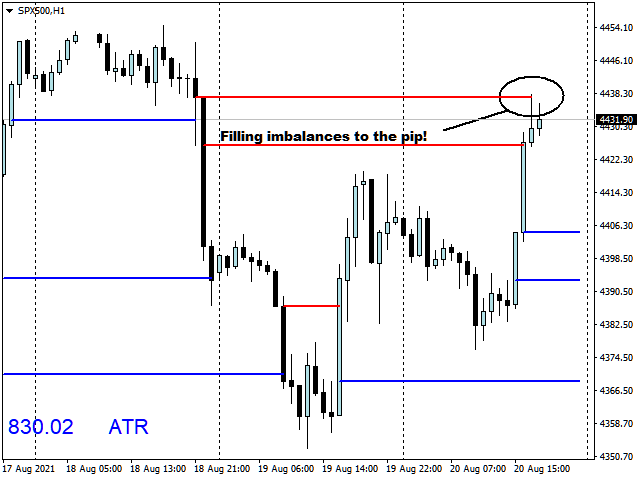
You can use this information in your trading by knowing that Market Imbalances must eventually be filled and mitigated. These "Imbalances" may take a few minutes or a few weeks or months, depending on the timeframe you trade. Market Imbalances are seen on every timeframe, from 1 minute charts up to Monthly charts, and on every instrument. You can use this information along with you own trading strategy and style to be successful in the market.
Current Inputs (Default values)
Imbalance Settings
- Bars to count- Number of bars back to draw lines. For viewing the lines on a larger timeframes, like Daily or higher, keep the bar count to around 250-500 bars. (2000)
- Minimum Pip Size For Imbalance- When ATR Input is False, This will be the Minimum pip size for displaying Imbalances. (5000)
- Enable to use ATR as Pipsize Filter- When True, the ATR value inputted will be used. When False, use "Minimum Pip Size for Imbalance" above to determine the value. (True)
- ATR Period to be used- This is the Average True Range value. (144)
- Minimum Bars For Imbalance- This is the minimum number of bars needed to show an Imbalance. If set to 5 for example, any Imbalances filled in less than 5 bars will not be shown on the chart. (2)
- Line Thickness- Thickness of Imbalance line. (2)
Display Settings
- Up Line Color- Change the Up line Color.
- Down Line Color- Change the Down Line Color.
- HideBlockedLine- When True, all Imbalances that were filled will not be shown. (False)
- HideSecondaryLine- When False, a secondary line is drawn to show how much of the Imbalance has been mitigated. The distance between this line and the main line is unmitigated Market Imbalance. (True)
- Enable Current TF- Shows the current timeframe Imbalances. If set to False, only higher timeframe Imbalance lines will be shown. (True)
- Mainline Style- Line style of Mainline. (Solid)
- 2nd Line Style- Line style of Secondary Line. (Dot)
- Enable HTF (1-4)- Enables HTF Imbalances to be shown on the current chart. Up to 4 can be added. (False)
- Timeframe (1-4)- Allows you to change the timeframe for each HTF level from 1 minute up Monthly. (30 Minute, 1 Hour, 4 Hour, and Daily)
- Line Style (1-4)- Changes the Line Style of the HTF. (Dot)
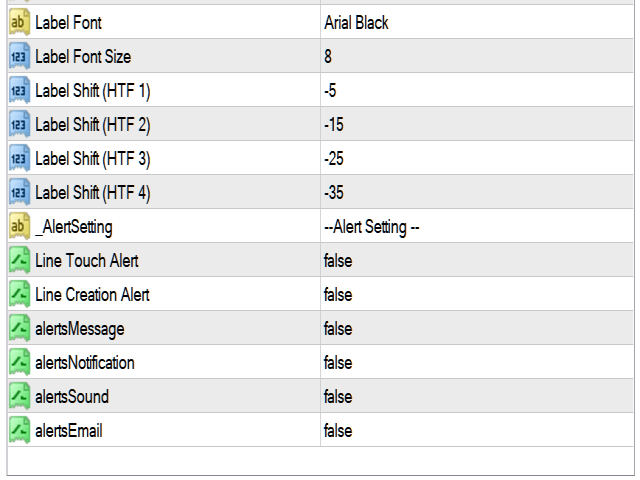
- Label Font- Changes Font Style. (Arial Black)
- Label Font Size- Changes Font Size. (8)
- Label Shift HTF (1-4)-Shifts the label on the Higher Timeframe Lines so they don't overlap. (-5, -15, -25, -35)
Alert Settings
- Line Creation Alert- Alerts at the end of a candle when a Market Imbalance Line has formed. (False)
- Line Touch Alert- Alerts when an Imbalance line has filled. (False)
- alertsMessage- Provides a pop up alert. (False)
- alertsNotification- Provides a Push Notification to MT4 mobile. Push notifications must be set up on MT4. (False)
- alertsSound- Provides a sound when an alert is triggered. (False)
- alertsEmail- Provides email notifications. Email must be set up on MT4. (False)
Risk Disclosure
Please ensure you understand the risks and carefully consider your financial situation and trading experience before trading.
The possibility exists that you could loss of some or all of your initial investment and therefore you should not invest money that you cannot afford to lose!
No information presented on MQL5.com constitutes a recommendation to buy, sell, or hold any security, financial product or instrument, or to engage in any specific investment strategy by using this product.
Good luck and happy trading!


This is the only indicator I use, This is the only indicator you need